In-depth analysis of gold price trends this week!Market news:
During the Asian morning session on Monday (July 21), the London gold price rose slightly to above $3,350 and is currently trading around $3,356/ounce. The weakening dollar and continued geopolitical and economic uncertainties have boosted demand for safe-haven spot gold, supporting international gold prices, but the rebound in the University of Michigan survey index may limit gold's gains.Although gold prices may face correction pressure in the short term, international gold has limited room to fall. Factors such as economic slowdown, lower interest rates and rising inflation will attract more buyers to enter the market. The continued purchases by central banks over the past two and a half years have also provided solid support for gold prices. The tension between Trump and Powell is the main reason why gold prices remain high.Looking ahead, the market focus will shift to this week's ECB monetary policy meeting. Economists generally expect the ECB to keep interest rates unchanged, and preliminary manufacturing data released this week may also trigger some market fluctuations. This week's economic data and Fed dynamics will be key variables in the trend of gold prices. No matter how the market fluctuates, the long-term value of gold cannot be ignored, and investors need to pay close attention to macroeconomic changes and political events.
Technical Review:
Technically, the daily chart of gold still maintains the adjustment of the middle track of the Bollinger Band, forming a yin-yang alternating shock consolidation. However, on Friday, the gold price closed with a small positive K, and the price MA10/7-day moving average closed above 33/42. From the indicator point of view, the MACD indicator momentum column shortened, and the RSI indicator ran around 50, indicating that the market buying and selling forces were balanced.The 4-hour chart shows that the gold price fluctuated and tended to buy and consolidate at 3330-3360. At present, the moving average system opened upward. As long as gold does not lose 3320, it is expected to continue to sprint upward to 3375/3400. On the contrary, if it loses the support of 3320/10 again, it is regarded as a short-term weak shock downward. On the whole, the current trend of gold is oscillating and tending to buy and consolidate. Today's trading idea is mainly to buy at a low price and sell at a high price.
Today's analysis:
Since there is no major economic data this week, in the absence of geopolitical risks and emergencies, it is expected that gold will still see a small range of shocks and consolidation this week, and the range can be focused on 3400-3300. The daily Bollinger Bands continue to close, with the upper track at 3375 and the lower track at 3288. The short-term moving averages are intertwined near the middle track, suggesting that gold will still be dominated by fluctuations in the short term. In terms of operation, keep the idea of selling at high prices and buying at low prices. Do not chase the rise and sell at the fall. Wait for the breakthrough signal to be confirmed before following the trend. Today’s support is at 3340. You can use this as a key point to arrange buy orders during the day. The key point above is 3361, which is the high point of last Friday. 3361 is a short-term pressure point. If there is no correction today and it directly breaks 3361, we can follow the trend directly. If there is a correction, pay attention to the bottom structure above 3340 and buy at the bottom!
Operation ideas:
Buy short-term gold at 3340-3343, stop loss at 3332, target at 3370-3390;
Sell short-term gold at 3377-3380, stop loss at 3388, target at 3340-3320;
Key points:
First support level: 3340, second support level: 3332, third support level: 3320
First resistance level: 3375, second resistance level: 3388, third resistance level: 3410
Goldprediction

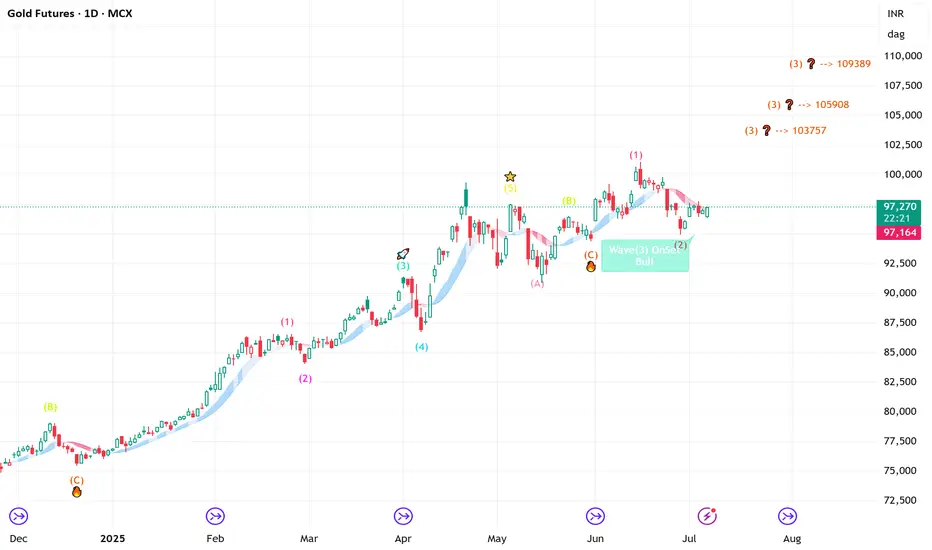
GOLD - Lovers Elliott wave - looking strong Short/Medium termGOLD-----Daily counts indicate Excellent bullish wave structure.
Both appear to be optimistic and this stock invalidation number (S L) wave 2 low
target short / long term are already shared as per charts
correction wave leg seems completed (C)
Investing in declines is a smart move for short/ long-term players.
Buy in DIPS recommended
Long-term investors prepare for strong returns over the next two to five years.
one of best counter
Every graphic used to comprehend & LEARN & understand the theory of Elliot waves, Harmonic waves, Gann Theory, and Time theory
Every chart is for educational purposes.
We have no accountability for your profit or loss.
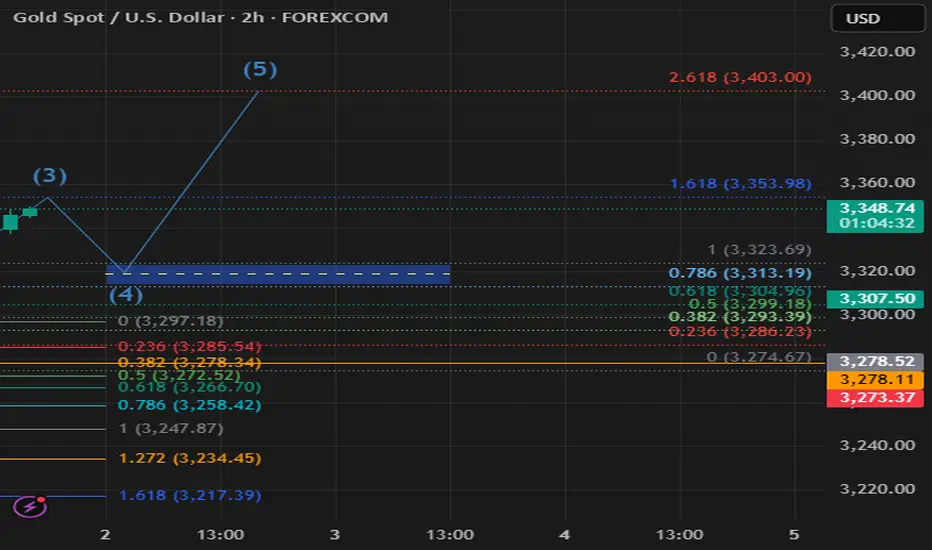
XAU/USD Start July 20251. i start after XAU/USD break previous High and correction (fibbo 32.0) respected. based on elliot wave strategy we can targeting end of wave 3 at 3353 area and than correction wave 4 (target at fibbo 32.0 - 50.0). after target correction, continue wave 5 at target 3403 area.
2. fundamentally speaking, new months new quarter. there ins't new catalist and sentiment. Macro Economic this week focus on labour market at US and FED projection to cut rate.
3. War at Iran and Israel, Russia and Ukraine, India and Pakistan, Trade War case, etc,.
4. Will be update
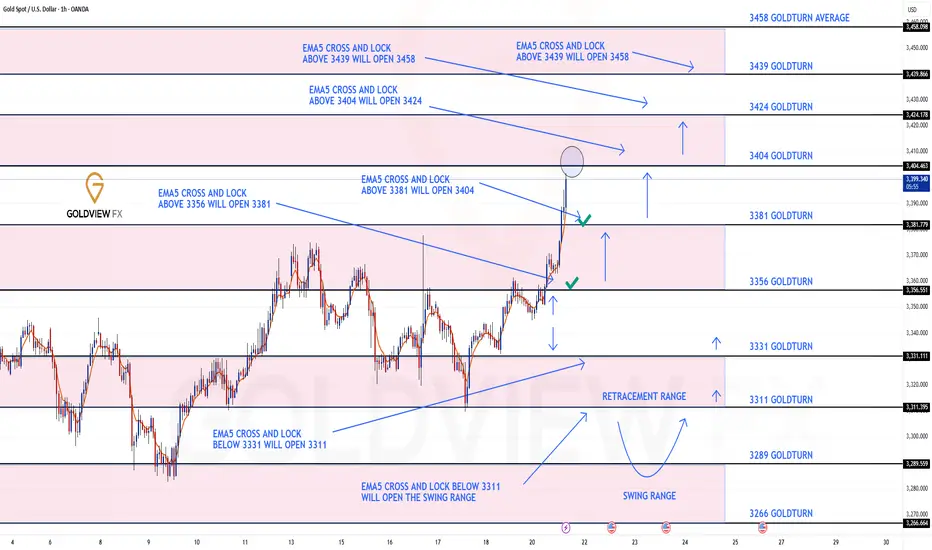
GOLD ROUTE MAP UPDATEHey Everyone,
Great start to the week with our chart idea playing out, as analysed.
We started with our Bullish target 3356 hit, followed with ema5 cross and lock above 3356 opening 3381. This was also hit perfectly completing this target. We now have a further ema5 cross and lock above 3381 leaving 3404 open with already a nice push up, just short of the full gap.
We will keep the above in mind when taking buys from dips. Our updated levels and weighted levels will allow us to track the movement down and then catch bounces up.
We will continue to buy dips using our support levels taking 20 to 40 pips. As stated before each of our level structures give 20 to 40 pip bounces, which is enough for a nice entry and exit. If you back test the levels we shared every week for the past 24 months, you can see how effectively they were used to trade with or against short/mid term swings and trends.
The swing range give bigger bounces then our weighted levels that's the difference between weighted levels and swing ranges.
BULLISH TARGET
3356 - DONE
EMA5 CROSS AND LOCK ABOVE 3356 WILL OPEN THE FOLLOWING BULLISH TARGETS
3381 - DONE
EMA5 CROSS AND LOCK ABOVE 3381 WILL OPEN THE FOLLOWING BULLISH TARGET
3404
EMA5 CROSS AND LOCK ABOVE 3404 WILL OPEN THE FOLLOWING BULLISH TARGET
3424
EMA5 CROSS AND LOCK ABOVE 3424 WILL OPEN THE FOLLOWING BULLISH TARGET
3458
BEARISH TARGETS
3331
EMA5 CROSS AND LOCK BELOW 3331 WILL OPEN THE FOLLOWING BEARISH TARGET
3311
EMA5 CROSS AND LOCK BELOW 3311 WILL OPEN THE SWING RANGE
3289
3266
As always, we will keep you all updated with regular updates throughout the week and how we manage the active ideas and setups. Thank you all for your likes, comments and follows, we really appreciate it!
Mr Gold
GoldViewFX
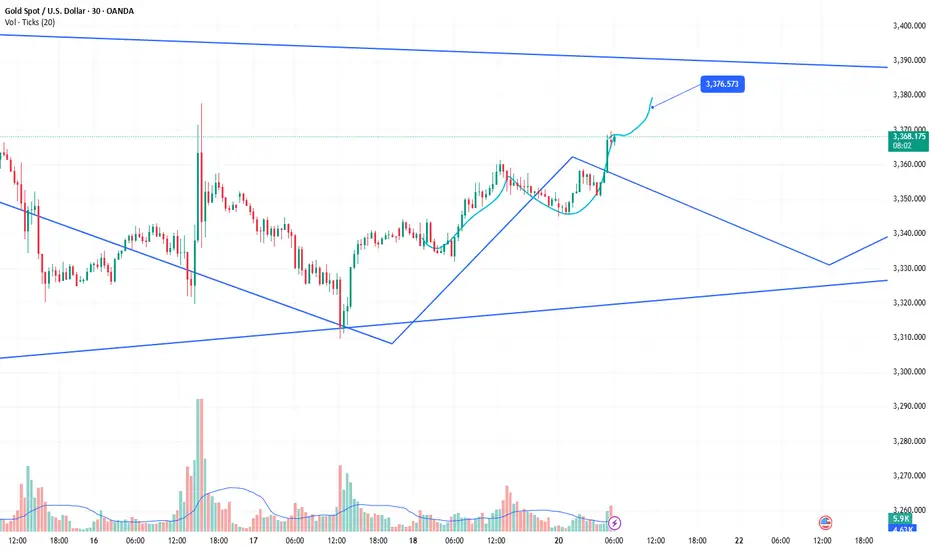
Ultra-short-term trading. Profit of $10/ounceThe order to buy XAUUSD successfully made a profit. The current gold price is 3367. Stimulated by the weekend news, the expected trend was achieved smoothly, and the short-term bulls were strong. Buying can continue to be the main focus. Relying on the half-hour and one-hour trends, trading can be carried out in the London market for the purpose of buying and profit. The increase is about $10/ounce.
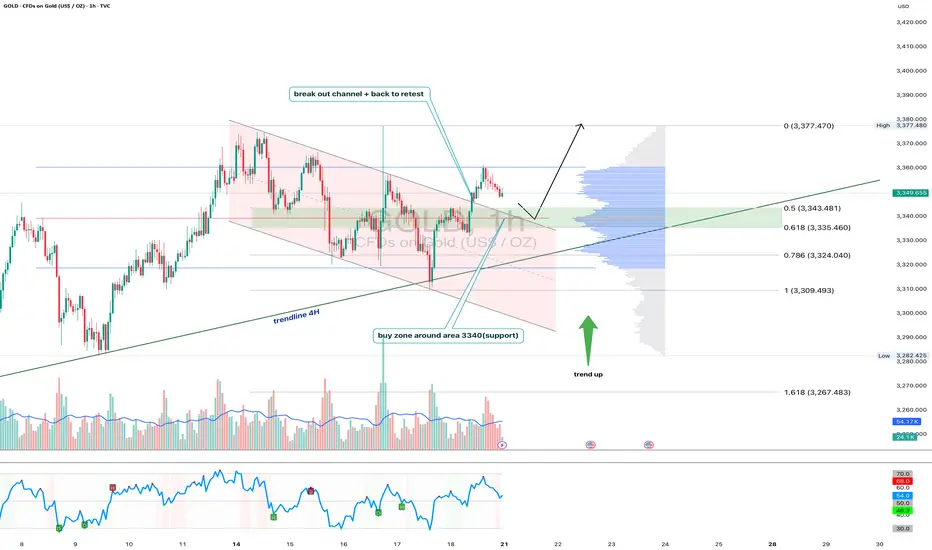
Gold 1H - Retest of channel & support zone at 3340After breaking out of the falling channel, gold is currently retesting its upper boundary — now acting as support. The 3340 zone is particularly important as it aligns with the 0.618 Fibonacci level and high volume node on the visible range volume profile. The price action suggests a potential bullish rejection from this area. With both the 50 and 200 EMA below price on the 1H, the short-term trend remains bullish. The 4H trendline further supports this setup. RSI is cooling off near the neutral zone, leaving room for another leg higher toward the 3377 resistance zone. If 3340 fails, 3324 (0.786 Fibo) becomes the next line of defense. Until then, the structure remains bullish following the successful breakout and retest of the channel.
Gold momentum is about to explode, is 3400 still far away?
💡Message Strategy
Gold prices rose as expected on Friday as a weaker dollar and continued geopolitical and economic uncertainty boosted demand for safe-haven gold. Spot gold rose 0.4% to $3,353.25 an ounce, down 1.1% in the previous session. U.S. gold futures also rose 0.4% to $3,359.70. Gold prices remained largely stable around $3,350 an ounce this week.
The trend of gold prices is currently mainly affected by the following three factors:
1. US economic data supports the US dollar
The latest US real estate data is generally positive, and building permits and new housing starts data are both above expectations. The recovery of the real estate market has reduced market concerns about economic recession, which has provided some support to the US dollar, thereby constituting a certain suppression on gold.
2. Fed policy differences trigger market games
Fed officials have obvious differences in their statements on monetary policy. Christopher Waller, a Fed governor, prefers to directly cut interest rates by 25 basis points in July, worried about economic slowdown and weak job market. San Francisco Fed President Daly believes that two interest rate cuts in 2025 are "reasonable", but is wary of the impact of excessive tightening policies on the job market.
On the contrary, Fed Governor Kugler is more hawkish, believing that recent tariffs have been transmitted to consumer prices, and high interest rates should continue to be maintained, and it is not appropriate to cut interest rates for the time being. The existence of differences has caused market expectations to waver, and gold has fallen into consolidation.
3. Inflation expectations determine the medium-term direction of gold prices
The June CPI data from the United States showed signs of rising inflation, which may cause the Federal Reserve to postpone the pace of interest rate cuts.
📊Technical aspects
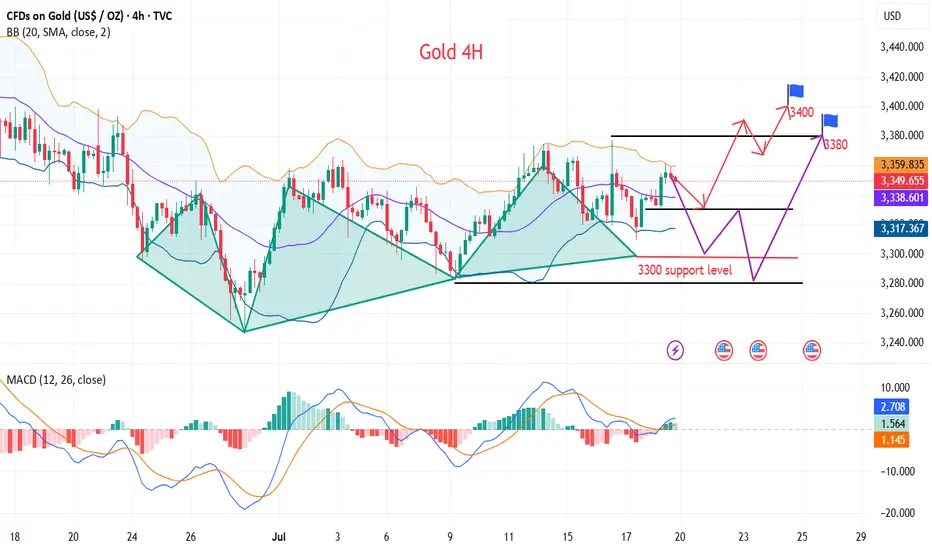
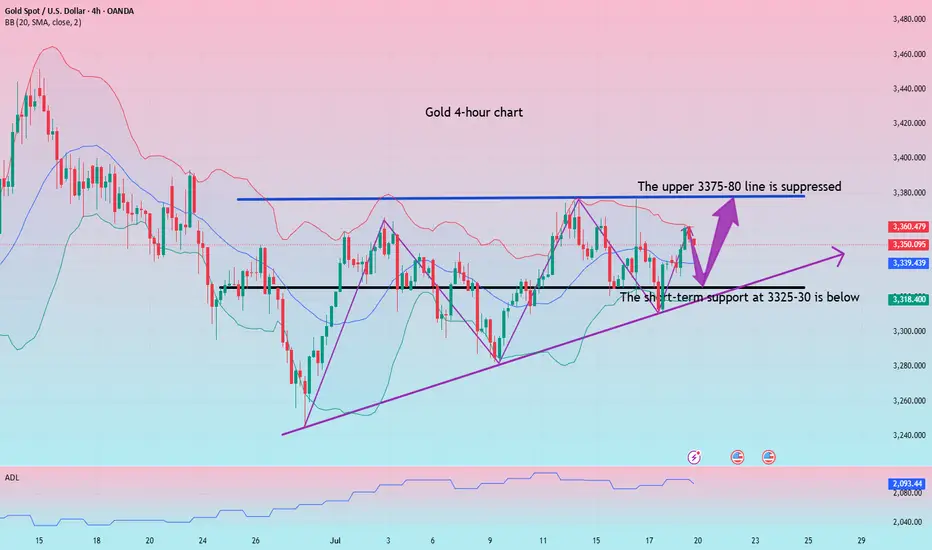
From the 4H chart, gold is currently oscillating in an obvious symmetrical triangle, forming a consolidation pattern in the short term.
Bollinger Band indicator: The middle track of the Bollinger Band is at $3345, the upper track is at $3405, and the lower track is at $3280. The current price is running near the middle track, indicating that volatility is converging and there is an expectation that a direction will be chosen soon.
Support and resistance: The current key support level is $3,280; short-term support is 3,300, and the upper resistance is $3,380. After breaking through, it is expected to test the previous highs of $3,451 and $3,499.
MACD indicator: The MACD histogram is gradually converging, and the DIFF line (3.19) and the DEA line (1.91) are in a sticky state, indicating that the momentum is exhausted and the probability of short-term shocks is high, but once the volume breaks through, the trend may form quickly.
RSI indicator: The RSI indicator is currently at 53.64, which is in the neutral area and has not entered the overbought or oversold area, indicating that the market is still waiting for new direction signals.
Overall, the analysis believes that gold is at the end of a symmetrical triangle, and the technical side shows that it is about to face a breakthrough. The direction choice may appear tonight or early next week, and the idea is still mainly low-level bulls.
💰Strategy Package
Long Position:3320-3330,SL:3300,Target: 3370-80,3400
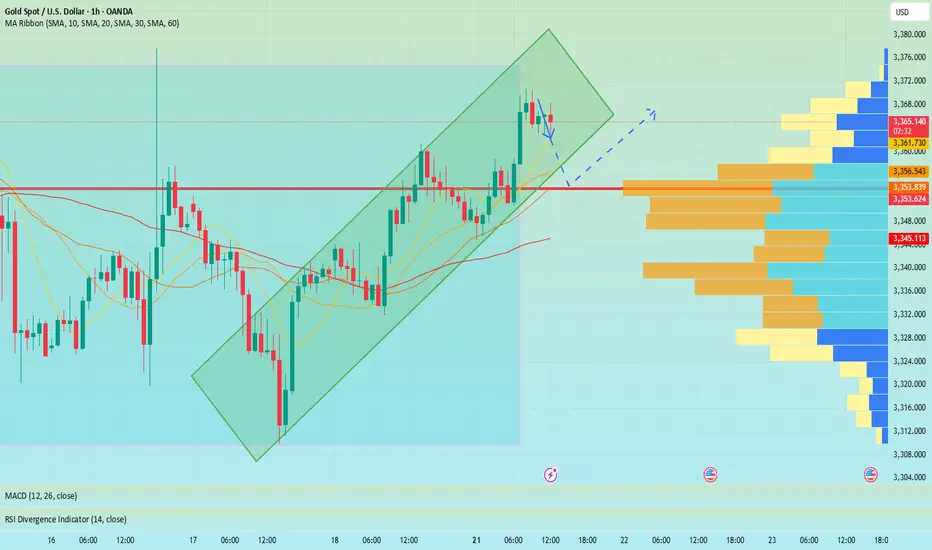
Gold is waiting for a pullback to break through 3400In the short term, gold is stuck in a sideways trend near 3365. It is not recommended to enter this point regardless of long or short positions. It is expected that there will be certain variables in the NY period. If gold retreats and falls in the short term as we expect, it may first touch around 3361. If it falls below 3361, it is expected to touch around 3353, which is also the point I gave this morning to see support.
Judging from the market, our focus on the upper side is still the 3375-3385 resistance area. If it can be effectively broken through, it is expected to hit the 3400-3420 mark. Although the daily MACD is oscillating near the zero axis, the 4H market shows that the oscillation is strong. Our trading strategy remains unchanged in the short term. The pullback in the NY period provides an opportunity, and we can consider going long. If there is new news during the day that requires adjustment, I will notify you immediately. Bros, please be patient and wait for trading opportunities.
OANDA:XAUUSD
GBPAUD's wide trading range remains intact✏️GBPAUD is trading in a wide range. After the increase on Friday, the pair is retesting the support zone breaking past resistance. And the current reaction point also coincides with the 20 SMA. There is not much momentum for the pair to break out of the wide trading range, so buying the pair to the upper range of 2.097 is a reasonable choice at the moment.
📉 Key Levels
Support: 2.058
Resistance: 2.083-2.096
BUY Trigger: Confirmed bounce from 2.059 (EMA support)
Target 2.09600
BUY DCA Trigger: Break 2.083
Leave your comments on the idea. I am happy to read your views.

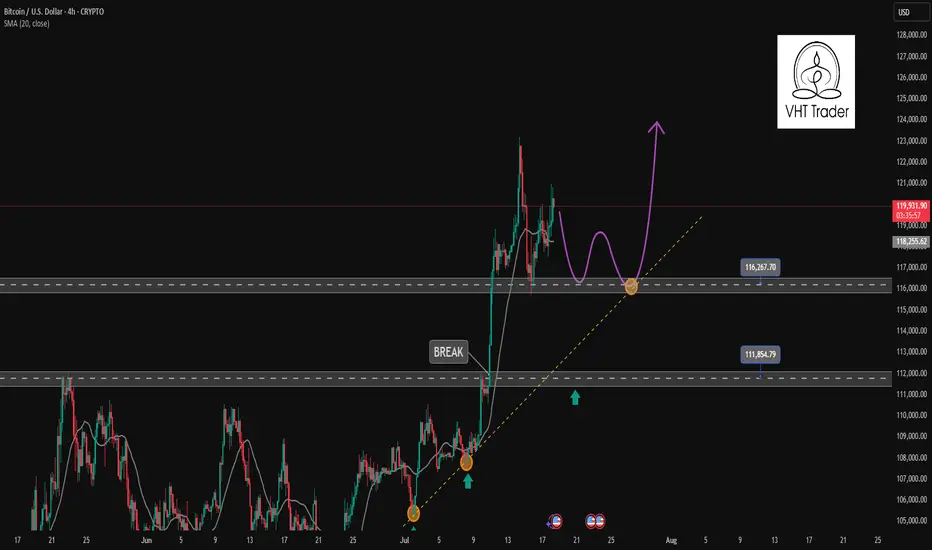
Find a recovery point to continue buying BTC✏️ CRYPTO:BTCUSD is trading near the all-time high. The trading strategy is to wait for some investors to take profit so that the price can return to the nearest support zones and continue to buy to the new all-time high zones.
📉 Key Levels
BUY Trigger: confirms the recovery from the support trend line 116000
BUY zone 112000 (Strong support zone)
Target 129000
Leave your comments on the idea. I am happy to read your views.
Gold returns to its original nature. Price increase towards 3400✏️ OANDA:XAUUSD is back to its inherent uptrend. Currently trading in a wide range. Shaped by CPI news last week. Trendline is still supporting Gold price towards 3400 next week. Pay attention to the important zone 3373 to DCA BUY and do not SELL when breaking this important zone 3373. Effective trading strategy is to wait for Gold to correct and buy.
📉 Key Levels
Support: 3343 - 3322
Resistance: 3373-3400
Buy Trigger: Rejects the support zone 3343 and reacts to the upside
Buy Trigger: Rebound from 3322
Target 3400
Leave your comments on the idea. I am happy to read your views.

Gold Price Analysis July 21After being reinforced by CPI data last week, gold prices have regained their bullish momentum and are currently trading in a wide range. The technical structure still shows a dominant uptrend, with the trendline continuing to act as reliable support, targeting the important resistance zone of 3400 next week.
📌 Preferred trading strategy:
Watch the price reaction around the support zone of 3343. If there is a rejection signal of this zone accompanied by buying pressure, that will be the ideal entry point.
If the price continues to correct deeper, the strong support zone of 3322 will be a reasonable DCA point.
It is not recommended to SELL if the price breaks the confluence zone of 3373, as this is a signal confirming the strong bullish momentum continues.
📍 Important price zones:
Support: 3343 – 3322
Resistance: 3373 – 3400
🚀 Buy Trigger:
Price rejects 3343 zone with clear bullish signal
Strong bounce from 3322 zone

Monday market forecast, pay attention to the 3339 retracement📰 News information:
1. The Trump administration puts pressure on the Federal Reserve to cut interest rates
2. The continued impact of tariffs and the responses of various countries
📈 Technical Analysis:
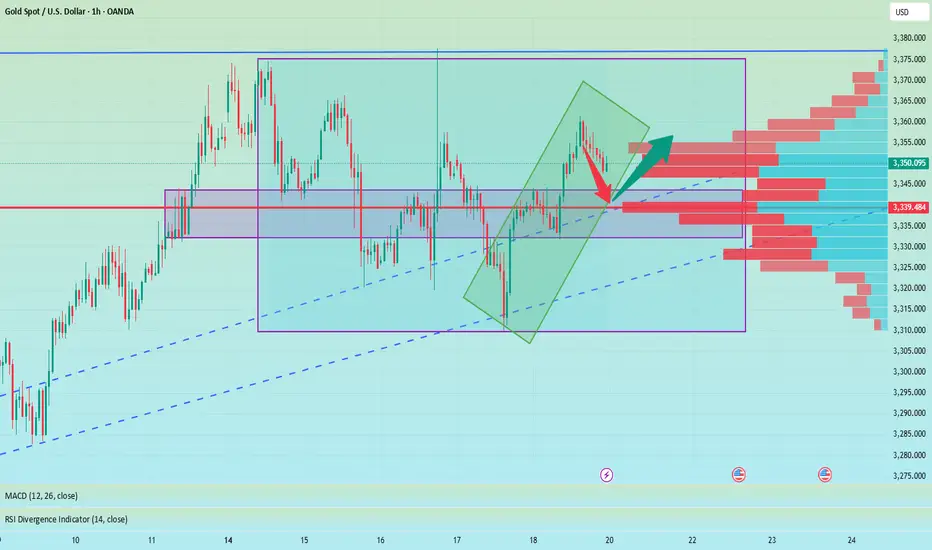
This week's basic judgment and forecast on the gold market trend were consistent, but on Friday, the overall gold fluctuations were not large. The overall trend of the daily line fluctuated around 3345, and the 3345 line also became a short-term long-short watershed. Although prices are likely to rise more easily than fall in the short term, it should be noted that the three-month adjustment cycle is coming to an end while the fundamentals of the bull market have not changed. It is recommended that you focus on preventing risks from short position operations next week. At the same time, the overall strong shock pattern, the anti-pulling momentum has not reached the top suppression position, and the area around 3339 below is the previous intensive trading area, which constitutes a certain support in the short term. If the market fails to effectively break below next week, it will greatly boost the bullish momentum, and it is not ruled out that there will be a possibility of refreshing the high point near 3380 next week.
On the whole, the short-term focus next week is the 3345-3335 area below. If it falls back to this point, you can consider arranging long orders. The short-term target is 3355-3365, and the strong trend is expected to continue to touch 3375-3385.
🎯 Trading Points:
BUY 3345-3335
TP 3355-3365-3375-3385
In addition to investment, life also includes poetry, distant places, and Allen. Facing the market is actually facing yourself, correcting your shortcomings, confronting your mistakes, and strictly disciplining yourself. I hope my analysis can help you🌐.
TVC:GOLD PEPPERSTONE:XAUUSD FOREXCOM:XAUUSD FX:XAUUSD OANDA:XAUUSD FXOPEN:XAUUSD
GOLDGOLD needs some more upside, reaction zone is 3380-3395, will see how gold reacts at that level.
Disclosure: We are part of Trade Nation's Influencer program and receive a monthly fee for using their TradingView charts in our analysis.

Gold market directional biasGold currently in a balance sentiment. Now it continues buy rally. In cot report there is still chance of buy rally. but in the upper side there should be a strong sell zone. we have to prepare for this also.
Analysis of gold market operation strategies and market trends n
Remember not to act on impulse when trading. The market is a place where you can deal with all kinds of dissatisfaction, so you must not hold orders. I believe many people have experienced this. The more you resist, the more panic you will feel. The floating losses will continue to magnify, and you will not be able to eat or sleep well, and you will miss many opportunities in vain. If you also have these troubles, then you might as well follow my pace and try to see if it can make you suddenly enlightened. If you need help, I will always be here, but if you don't even extend your hand, how can I help you?
The trend of gold on Friday was mainly oscillating upward. It can be said that gold on Friday was a volatile market, closing at 3350. If there is no stimulation from international news over the weekend, we will continue to be bullish next week. If your current gold operation is not ideal, I hope I can help you avoid detours in your investment. Welcome to communicate with us!
From the 4-hour analysis, the short-term support below continues to focus on the vicinity of 3340-45, the strong support is at the 3310 mark, and the key pressure above focuses on the 3380 line. First, rely on this range to maintain the main tone of high-altitude low-multiple cycles. In the middle position, watch more and do less, be cautious in chasing orders, and wait patiently for key points to enter the market.
Gold operation strategy:
Gold goes long when it falls back to the 3335-43 line, and covers long positions when it falls back to the 3320-25 line, stop loss at 3313, target 3370-75 line, and continue to hold if it breaks;
GOLD 1H CHART ROUTE MAP UPDATE & TRADING PLAN FOR THE WEEKHey Everyone,
Please see our updated 1h chart levels and targets for the coming week.
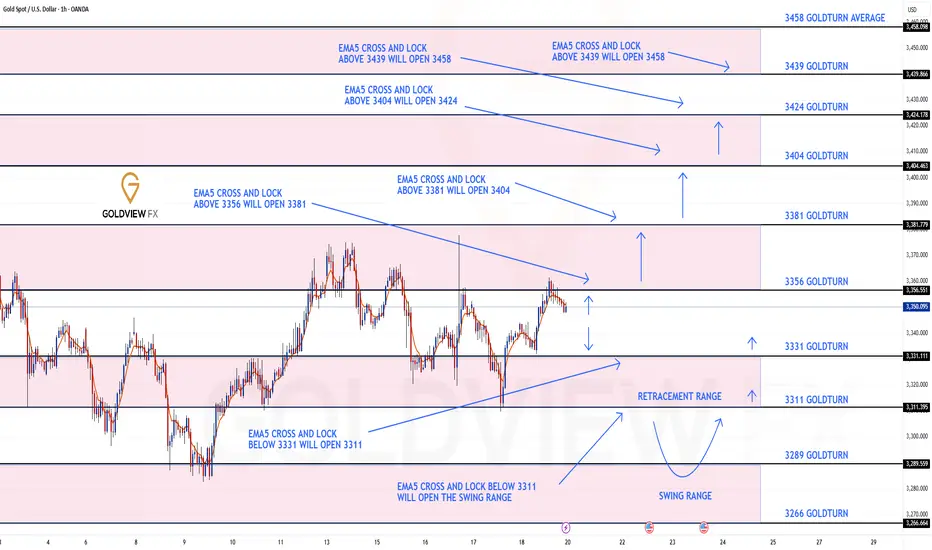
We are seeing price play between two weighted levels with a gap above at 3356 and a gap below at 3331. We will need to see ema5 cross and lock on either weighted level to determine the next range.
We will see levels tested side by side until one of the weighted levels break and lock to confirm direction for the next range.
We will keep the above in mind when taking buys from dips. Our updated levels and weighted levels will allow us to track the movement down and then catch bounces up.
We will continue to buy dips using our support levels taking 20 to 40 pips. As stated before each of our level structures give 20 to 40 pip bounces, which is enough for a nice entry and exit. If you back test the levels we shared every week for the past 24 months, you can see how effectively they were used to trade with or against short/mid term swings and trends.
The swing range give bigger bounces then our weighted levels that's the difference between weighted levels and swing ranges.
BULLISH TARGET
3356
EMA5 CROSS AND LOCK ABOVE 3356 WILL OPEN THE FOLLOWING BULLISH TARGETS
3381
EMA5 CROSS AND LOCK ABOVE 3381 WILL OPEN THE FOLLOWING BULLISH TARGET
3404
EMA5 CROSS AND LOCK ABOVE 3404 WILL OPEN THE FOLLOWING BULLISH TARGET
3424
EMA5 CROSS AND LOCK ABOVE 3424 WILL OPEN THE FOLLOWING BULLISH TARGET
3458
BEARISH TARGETS
3331
EMA5 CROSS AND LOCK BELOW 3331 WILL OPEN THE FOLLOWING BEARISH TARGET
3311
EMA5 CROSS AND LOCK BELOW 3311 WILL OPEN THE SWING RANGE
3289
3266
As always, we will keep you all updated with regular updates throughout the week and how we manage the active ideas and setups. Thank you all for your likes, comments and follows, we really appreciate it!
Mr Gold
GoldViewFX
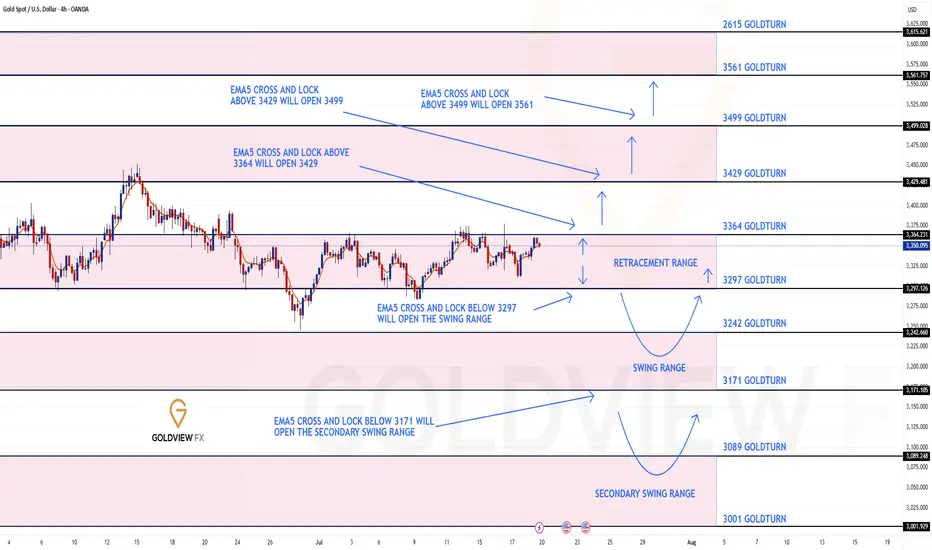
GOLD 4H CHART ROUTE MAP UPDATE & TRADING PLAN FOR THE WEEKHey Everyone,
Please see our updated 4h chart levels and targets for the coming week.
We are seeing price play between two weighted levels with a gap above at 3364 and a gap below at 3297. We will need to see ema5 cross and lock on either weighted level to determine the next range.
We will see levels tested side by side until one of the weighted levels break and lock to confirm direction for the next range.
We will keep the above in mind when taking buys from dips. Our updated levels and weighted levels will allow us to track the movement down and then catch bounces up.
We will continue to buy dips using our support levels taking 20 to 40 pips. As stated before each of our level structures give 20 to 40 pip bounces, which is enough for a nice entry and exit. If you back test the levels we shared every week for the past 24 months, you can see how effectively they were used to trade with or against short/mid term swings and trends.
The swing range give bigger bounces then our weighted levels that's the difference between weighted levels and swing ranges.
BULLISH TARGET
3364
EMA5 CROSS AND LOCK ABOVE 3364 WILL OPEN THE FOLLOWING BULLISH TARGETS
3429
EMA5 CROSS AND LOCK ABOVE 3429 WILL OPEN THE FOLLOWING BULLISH TARGET
3499
EMA5 CROSS AND LOCK ABOVE 3499 WILL OPEN THE FOLLOWING BULLISH TARGET
3561
BEARISH TARGETS
3297
EMA5 CROSS AND LOCK BELOW 3297 WILL OPEN THE SWING RANGE
3242
3171
EMA5 CROSS AND LOCK BELOW 3171 WILL OPEN THE SECONDARY SWING RANGE
3089
3001
As always, we will keep you all updated with regular updates throughout the week and how we manage the active ideas and setups. Thank you all for your likes, comments and follows, we really appreciate it!
Mr Gold
GoldViewFX
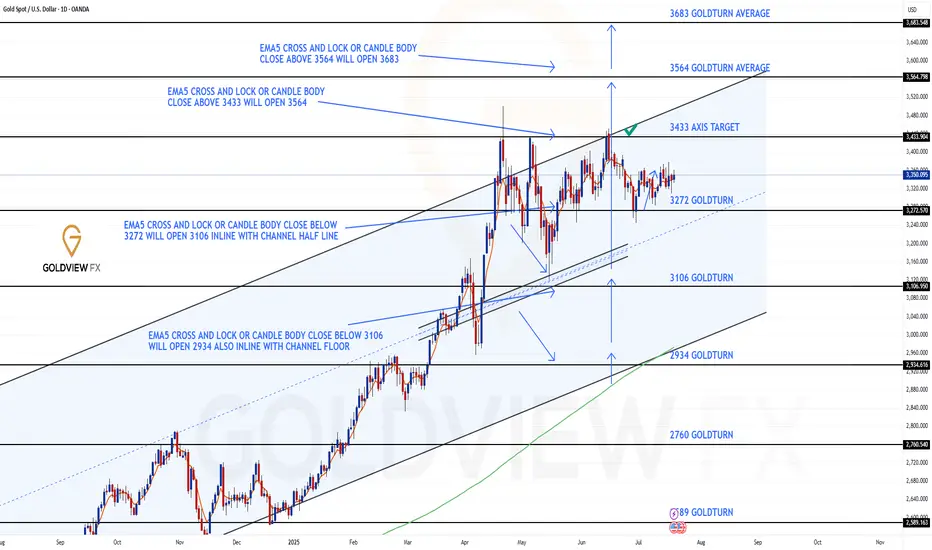
GOLD DAILY CHART ROUTE MAPHey Everyone,
Daily Chart Follow-Up – Structure Still in Full Control
Just a quick update on our daily structure roadmap. Price continues to respect our Goldturn levels with surgical precision.
After the previous bounce off 3272, we saw over 800 pips of upside follow through. That level once again proved its weight, holding beautifully as support and launching price firmly back toward the upper boundary.
Since last week’s update, nothing has changed structurally – the range remains intact and fully respected. Price is still trading between the well defined 3272 support and the untested 3433 resistance. We’ve yet to revisit 3433, which remains our key upside target and a potential inflection point.
Here’s what we’re focusing on next:
🔹 Range scenario active:
Until price breaks out cleanly, we anticipate continued swings between 3433 resistance and 3272 support. This remains the active range setup.
🔹 EMA5 cross and lock:
We’re still watching for a decisive EMA5 break and lock. Without that, we expect more range-bound action rather than a breakout.
🔹 Structure remains intact:
No EMA5 breakdown off 3272 during the recent retest means buyers are still in control. Dips into 3272 remain valid long entries within this structure.
Key Levels This Week
📉 Support – 3272
Proven bounce zone. Continues to hold structure. As long as this holds, the bias remains constructive.
📈 Resistance – 3433
Open gap + channel top confluence. Still untested. Watching for a reaction or breakout confirmation here.
Thanks again for all the continued support, your likes, comments, and follows mean the world.
Wishing you another focused and profitable week ahead!
Mr Gold
GoldViewFX
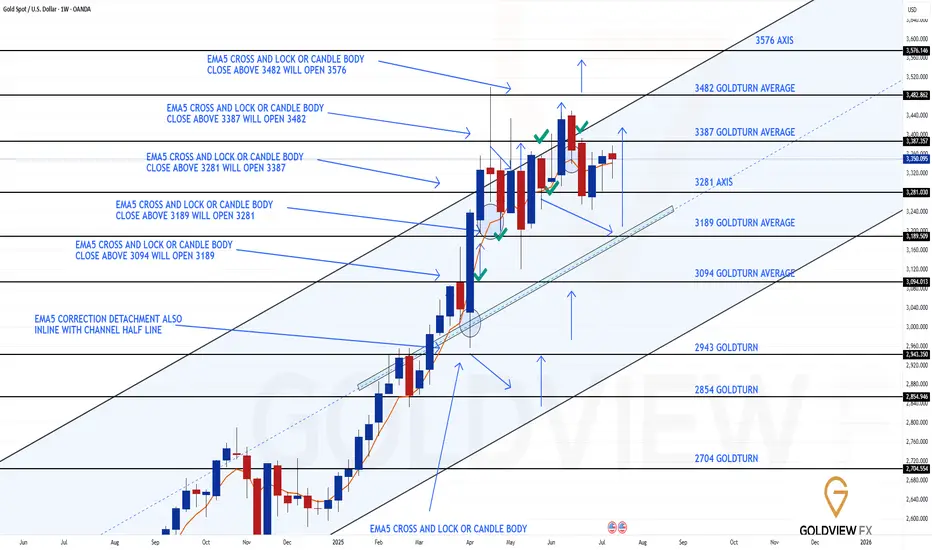
GOLD WEEKLY CHART MID/LONG TERM ROUTE MAPHey Everyone,
Please see update on our Weekly Chart idea.
As of now, nothing has changed structurally, the framework remains fully intact, and price continues to trade cleanly within the defined range.
After delivering a rejection at the channel top, price pulled back into 3281 support, where buyers once again stepped in decisively. That level held firm on a weekly closing basis, validating it as a reliable pivot and launching price back into bounce mode.
Despite the progress, we’ve yet to test the 3387 gap, which continues to act as a short term magnet. The longer range gap at 3482 also remains open and in focus as the larger objective.
Key takeaways from the current structure:
🔹 Structure unchanged:
The rising channel remains orderly. EMA5 still hasn’t locked bearishly, and the mid-line continues to climb beneath price, maintaining a constructive bias.
🔹 Support confirmed – 3281:
Held for a second time, reaffirming its significance in the broader structure.
🔹 3387 gap still in play:
While price is gravitating toward this zone, it has not yet been tested. Expect a reaction on first contact.
Updated Levels to Watch:
📉 Immediate Support – 3281
Held again, reinforcing its status as the key structural axis.
📈 Resistance 1 – 3387
Still untested. Remains the active near term target.
📈 Resistance 2 – 3482
Unfilled weekly gap and broader objective.
Plan:
As long as 3281 continues to hold, the bias remains for a measured grind higher toward 3387 and, eventually, 3482. If 3281 fails, we’ll reassess at the rising mid line for the next structured long opportunity.
As always, we will keep you all updated with regular updates throughout the week and how we manage the active ideas and setups. Thank you all for your likes, comments and follows, we really appreciate it!
Mr Gold
GoldViewFX
Gold breaks trendline and returns to uptrend. BUY NOW!✏️ OANDA:XAUUSD A deep sweep to 3310 and bounce back to the trading range. Gold is reacting at the Trendline around the price zone of 3344. This is an important price zone that if broken will return to the uptrend and head towards 3373 soon. 3332 plays an important role in the current bullish wave structure, which is a suitable SL placement point for BUY signals.
📉 Key Levels
Support: 3332-3312
Resistance: 3344-3357-3373-3389
BUY trigger: Break and trading above Resistance 3344 (trendline, top uptrend wave 1)
BUY DCA trigger: Break Resistance 3353
Target 3373
Leave your comments on the idea. I am happy to read your views.

Trapped orderflow. Gold Weekly Outlook. 19.07.2025,SaturdayExpecting a range bound market condition until any one of the VI on the weekly inverse. Trapped Orderflow

Double Top + Zigzag Complete: Are Bears About to Take Over Gold?Yesterday, the financial markets in general, including Gold ( OANDA:XAUUSD ) , acted like a roller coaster after the news of Powell's dismissal . After this news was denied , Gold returned to its main trend, which I published in my previous idea .
Gold is currently re-attacking the Support line , Support zone($3,326-$3,325) and 50_SMA(Daily) .
In terms of classic technical analysis , it seems that gold has formed a Double Top Pattern for support breakdowns, where a Support line breakdown can also be accompanied by a neckline breakdown .
From the perspective of Elliott Wave theory , it seems that Gold has managed to complete the Zigzag Correction(ABC/5-3-5) , and we should wait for the next bearish waves .
I expect Gold to break its supports and move towards $3,290 ; support breaks are best done with high momentum . An important price that can change the direction of Gold's downside is $3,350 .
Note: If Gold breaks the Resistance lines and forms an hourly candle above $3,351(Stop Loss (SL)), we can expect further Gold gains.
Gold Analyze (XAUUSD), 2-hour time frame.
Be sure to follow the updated ideas.
Do not forget to put a Stop loss for your positions (For every position you want to open).
Please follow your strategy; this is just my idea, and I will gladly see your ideas in this post.
Please do not forget the ✅ ' like ' ✅ button 🙏😊 & Share it with your friends; thanks, and Trade safe.
