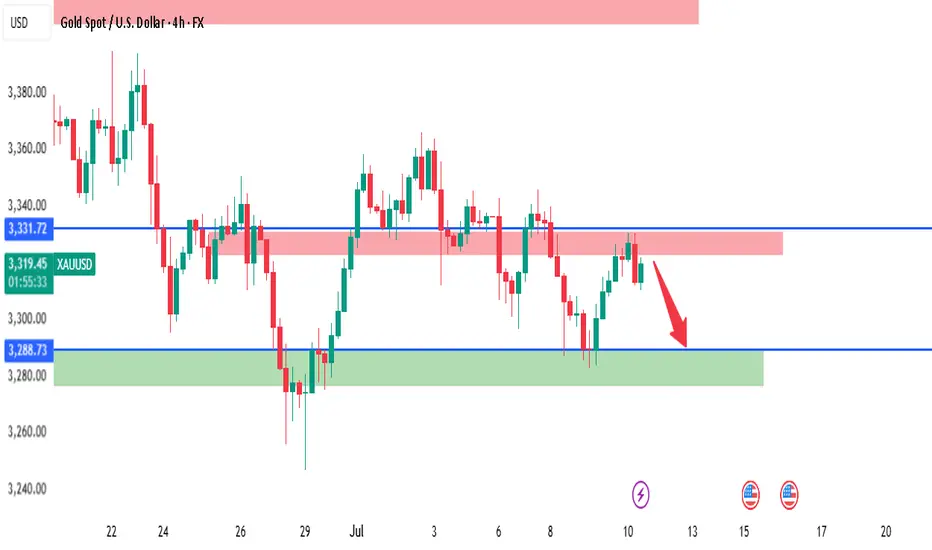
XAUUSD - 4H Bearish Rejection from Supply Zone | SMC AnalysisGold is showing signs of weakness after reacting strongly from a 4H Supply Zone around the 3331.72 level. Price tapped into the red supply zone, failed to break above, and is now forming lower highs — suggesting bearish momentum is building.
🔍 Key SMC Observations:
Supply Zone: Price rejected the 3331.72 level, which acted as a clear supply area based on past liquidity grabs and bearish institutional moves.
Change of Character (CHoCH): We saw a CHoCH around July 5th–6th, indicating a shift from bullish to bearish order flow.
Lower High Formation: Price failed to make a new high after tapping supply, showing signs of distribution.
Imbalance + Target Zone: Clean imbalance exists down to 3288.73 and potentially to the green demand zone around 3260–3270.
📍Trade Setup Idea:
Sell Opportunity: If price continues to reject the supply zone, look for bearish confirmation on the lower timeframes (e.g., 1H) to enter.
Target 1 (TP1): 3288.73 (near-term liquidity level)
Target 2 (TP2): 3260–3270 demand zone
Invalidation: A break and close above 3331.72 would invalidate the short-term bearish bias.
🔴 Watch for reaction around 3288.73 – if it holds, expect a possible bounce. If broken, further downside is likely.
Goldprediction
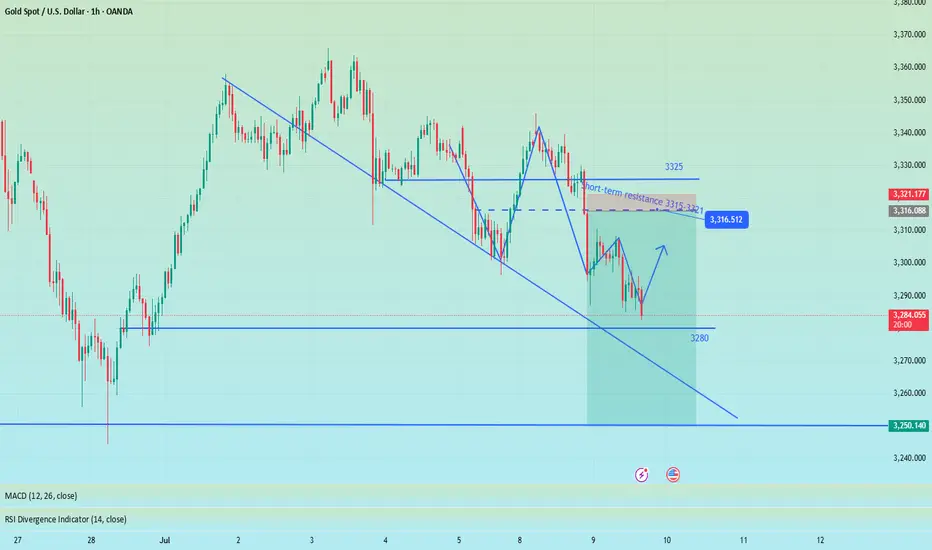
Night range operation, technical outlook is still bearishGold fell as expected after repeated battles at 3330. Currently, gold has returned to around 3320. This shows that the rebound was mainly driven by short-term risk aversion. As market news calms down and sentiment stabilizes, the market will most likely return to the technical trend. If it unexpectedly breaks through 3330, it is expected to touch the 3345 line I mentioned this morning. The short-term 3310 line currently has certain support. From a technical point of view, I prefer to short. Once it falls below 3310, the subsequent support will move to 3295-3285. Therefore, I think it is a good choice to short again at 3320-3330.
OANDA:XAUUSD
Bearish is still the main trend, first test 3250 supportYesterday, as the market expected a trade agreement to be reached between the US and its trading partners, risk sentiment was boosted. The strengthening of DXY and the rise in US Treasury yields put some pressure on gold.
On Monday, gold rebounded to 3320, and on Tuesday it touched above 3320 and began to fall sharply. In the short term, 3320 is a key trading position that we need to pay attention to. From the daily chart, the support line of 3320 has been completely broken, and the two major support points below are 3250 and 3200 respectively. Judging from the 4H chart, the decline may have just begun. Next, we may first face a test of the 3250 support line. If the 3250 support can be maintained, gold will maintain a volatile consolidation in the short term. Otherwise, if it falls below 3250, it will test the 3200 mark.
OANDA:XAUUSD
Perfect prediction, pay attention to the high short entry pointTrump extended the tariff agreement to August 1 and began to collect tariffs again. Although it eased market tensions, his remarks will not be extended after the expiration, and he issued a tariff threat, which increased global trade uncertainty and pushed up risk aversion. There was no clear direction coming out of the Fed's meeting minutes last night, but the potential bias was bullish.
At the beginning of the Asian session this morning, I also indicated that gold would rise and then fall. At present, it has reached the highest point near 3325 and then began to retreat, but the 4H golden cross has just been formed. There is still a certain pressure above 3333. If the gold price repeatedly competes for this position, we can continue to short without hesitation. The second short position today is near 3340-3345. There is potential momentum for the bulls in the short term. If the European session continues to fluctuate below 3333, then the entry of short positions will be slightly more stable. Yesterday, short orders were given at the key points of 3321 and 3333, and TP looked at 3310. If the bulls re-emerge below 3310-3305, you can consider short-term long positions and target 3330-3335.
Gold rebounds as expected, NY focuses on the Fed meeting📰 News information:
1. Federal Reserve meeting minutes
📈 Technical Analysis:
Gold fell into a narrow range of fluctuations during the European trading session. As I said this morning, gold is expected to rebound in the short term and the bullish momentum needs to be released. From a technical perspective, the overall market is still in a volatile pattern. The support at the 3280 level below is still a key point that needs attention in the short term. The European session has repeatedly tested this area. If it falls below this support, it is expected to touch the 3250 level as I said. While guarding against gold diving during the NY session, the upper resistance of 3315-3321 cannot be ignored to prevent bullish retaliation.
🎯 Trading Points:
SELL 3315-3321-3333
TP 3300-3290-3280-3250
In addition to investment, life also includes poetry, distant places, and Allen. Facing the market is actually facing yourself, correcting your shortcomings, facing your mistakes, and exercising strict self-discipline. I share free trading strategies and analysis ideas every day for reference by brothers. I hope my analysis can help you.
OANDA:XAUUSD PEPPERSTONE:XAUUSD FOREXCOM:XAUUSD FX:XAUUSD FXOPEN:XAUUSD TVC:GOLD
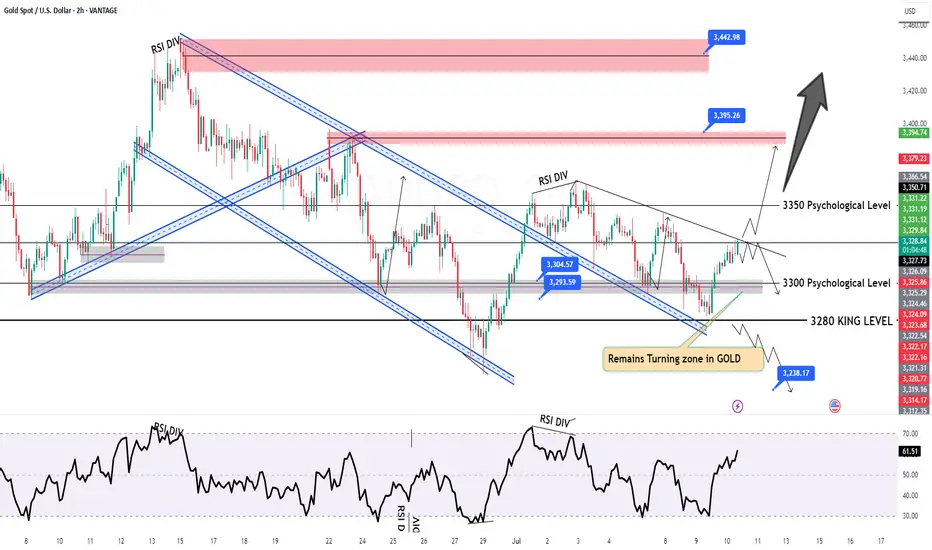
Support Under Siege – Is Gold Ready for Another Leg Down?As I expected in the previous idea , Gold ( OANDA:XAUUSD ) rose to $3,343 on the 1-hour time frame , but failed to break the Resistance zone($3,350-$3,326) and started to fall with relatively good momentum .
Do you think Gold can finally break the Support zone($3,312-$3,280) and Support lines , or will it rise again?
Gold is currently trading in the Support zone($3,312-$3,280) and near the Support line s. It has also managed to break the downtrend line .
In terms of Elliott Wave theory on the 15-minute time frame , Gold appears to be completing a main wave 4 . The main wave 4 appears to follow Double Three Correction(WXY) . Also, the main wave 3 is extended due to the high downward momentum.
I expect Gold to start falling again by entering the Potential Reversal Zone(PRZ) or Resistance zone($3,302-$3,296) and eventually breaking the Support zone($3,312-$3,280) and Support lines, Gold's falling targets are clear on the chart.
Note: Stop Loss (SL) = $3,313
Gold Analyze (XAUUSD), 15-minute time frame.
Be sure to follow the updated ideas.
Do not forget to put a Stop loss for your positions (For every position you want to open).
Please follow your strategy; this is just my idea, and I will gladly see your ideas in this post.
Please do not forget the ✅ ' like ' ✅ button 🙏😊 & Share it with your friends; thanks, and Trade safe.

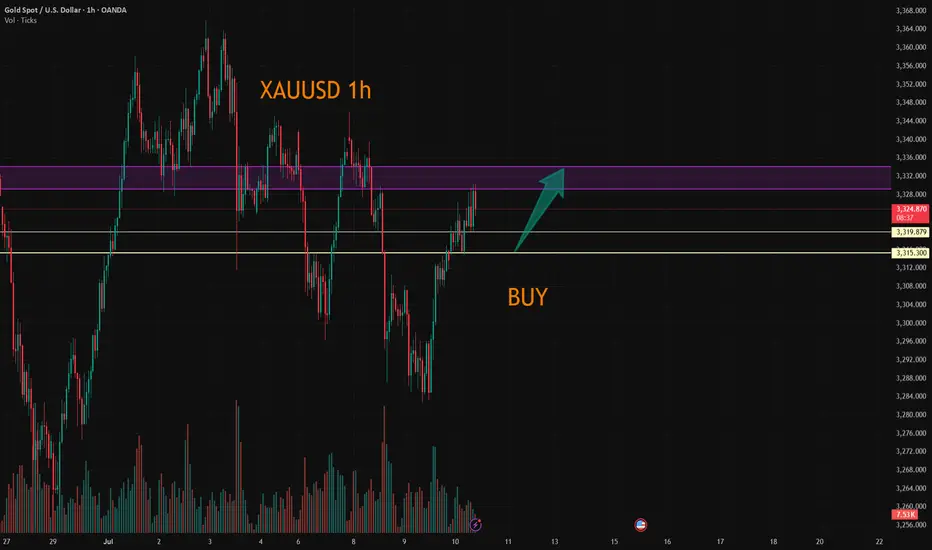
XAUUSD:Wait for 3315-19 to go long.
The market is experiencing short-term narrow-range fluctuations. There is a certain level of pressure at 3330. I tend to view it more positively as a breakthrough.The trading range for today has narrowed.
Trading Strategy:
BUY@3315-19
TP3329-34
I will closely follow up on every trading strategy I develop. If you are unsure about how to conduct a trade, you can simply come to me for help.
More detailed strategies and trading will be notified here ↗↗↗
Keep updated, come to "get" ↗↗↗
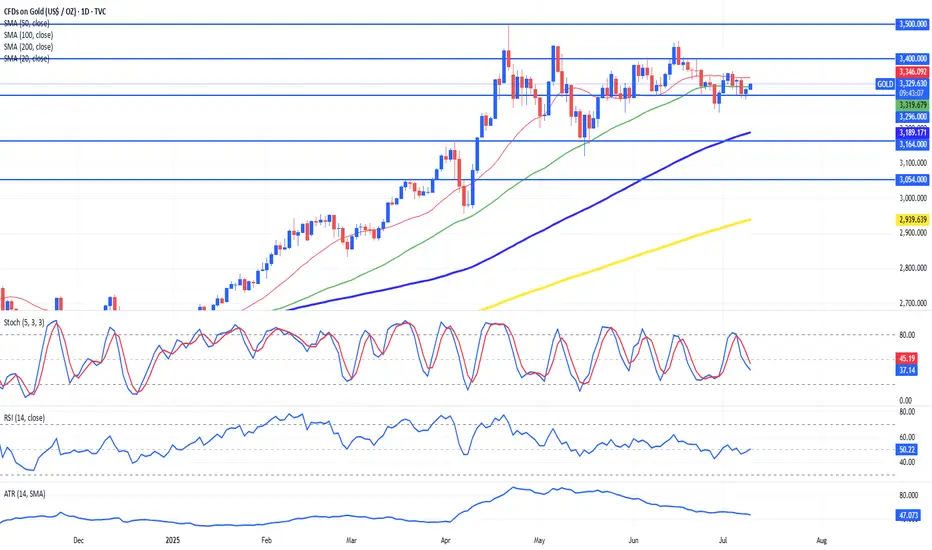
Gold Stuck in Neutral: Range Trading PersistsSince its impressive rally towards $3,500 earlier this year, Gold (XAUUSD) has settled into a consolidation phase, oscillating steadily between $3,250 and $3,400. Prices have consistently gravitated towards the 20-period SMA, reflecting a neutral sentiment among traders. Despite staying above key trend supports (50- and 200-period SMAs), gold has lacked sustained directional momentum.
Technically, indicators confirm this balanced outlook. RSI remains neutral around 49, indicating evenly matched bulls and bears, while the stochastic oscillator similarly shows neither oversold nor overbought conditions. A declining ATR highlights reduced volatility, signaling cautious market participation. Critical near-term support lies at $3,164 and $3,054, while resistance holds firm at $3,296 and $3,400. Traders should anticipate continued mean reversion and look to fade extremes within this established range.
Fundamentally, Gold faces competing drivers. Geopolitical uncertainties and central bank diversification away from the U.S. dollar provide bullish tailwinds. Conversely, resilient U.S. economic data periodically boosts the dollar, restricting gold’s upside potential. Traders should monitor this week's Fed minutes closely, as surprises here could trigger volatility or even a breakout scenario toward $3,500 or a deeper correction below $3,164. For now, expect gold to remain range-bound, reacting sensitively to headlines and macroeconomic cues.
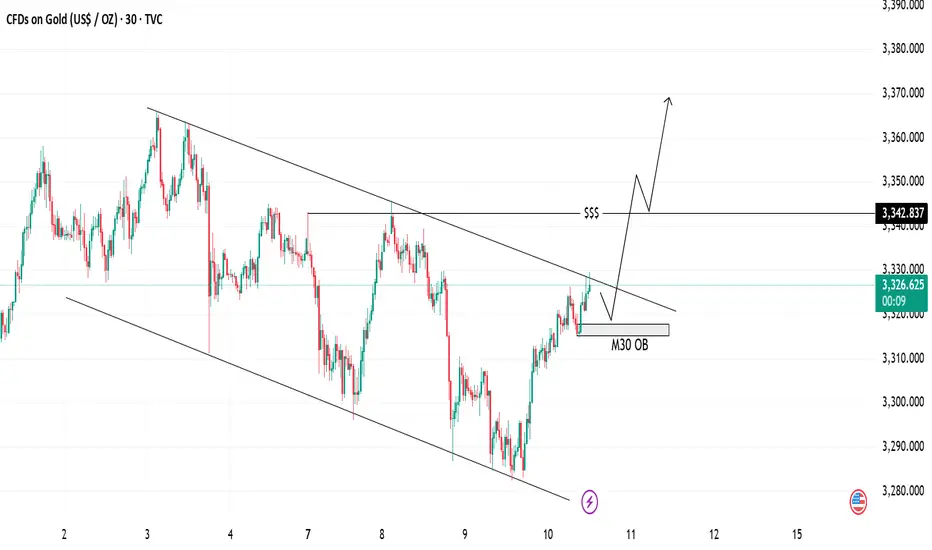
Gold Analysis Bullish Breakout | Trendline & OB Setup📈 Gold Analysis
We are currently seeing price action within a descending channel, testing key support at the M30 OB (Order Block). The price is pushing higher after bouncing off the support level, and the trendlines suggest a potential breakout to the upside.
💡 Key Levels:
Support Zone: 3326
Resistance Zone: 3342
The market is primed for a possible rally, indicated by the upward momentum and price breaking out above the trendline. Watch for confirmation as we approach the liquidity level for further bullish movement.
⚡ Trade Idea: Look for a long entry if price closes above the trendline for a continuation towards the next resistance.
GOLD Intraday Chart Update For 10 July 25Hello Traders,
as you can see that GOLD is stuck in tight range between 3300-3330 all eyes on clear breakout for now
further only market will break clearly 3345 level then we will consider market will move further advance below 3300 GOLD will move towards 3250
Scalping Range 3300 - 3330 for the short time period
Disclaimer: Forex is Risky
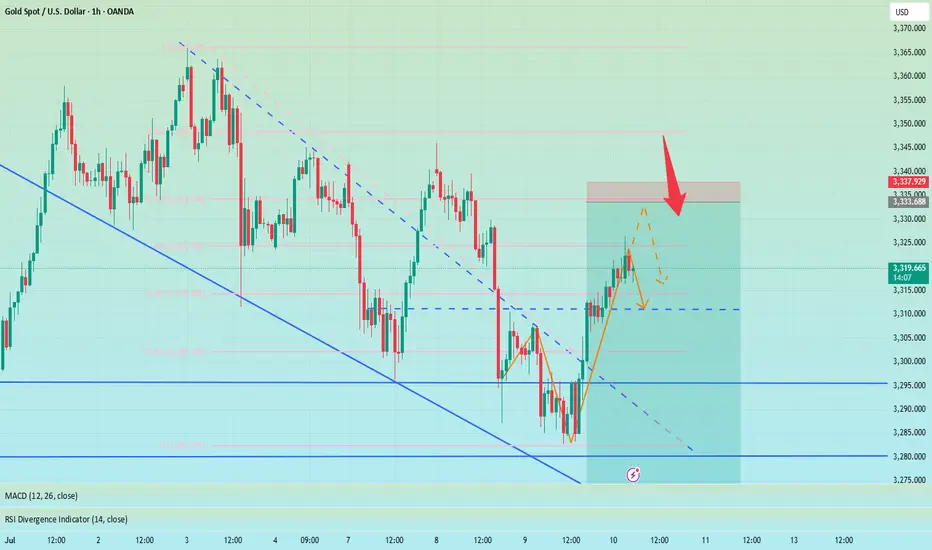
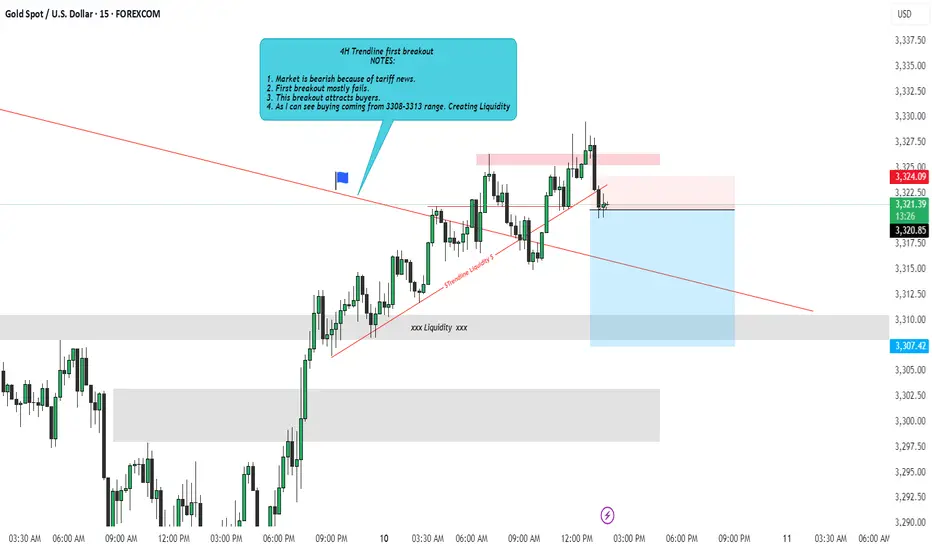
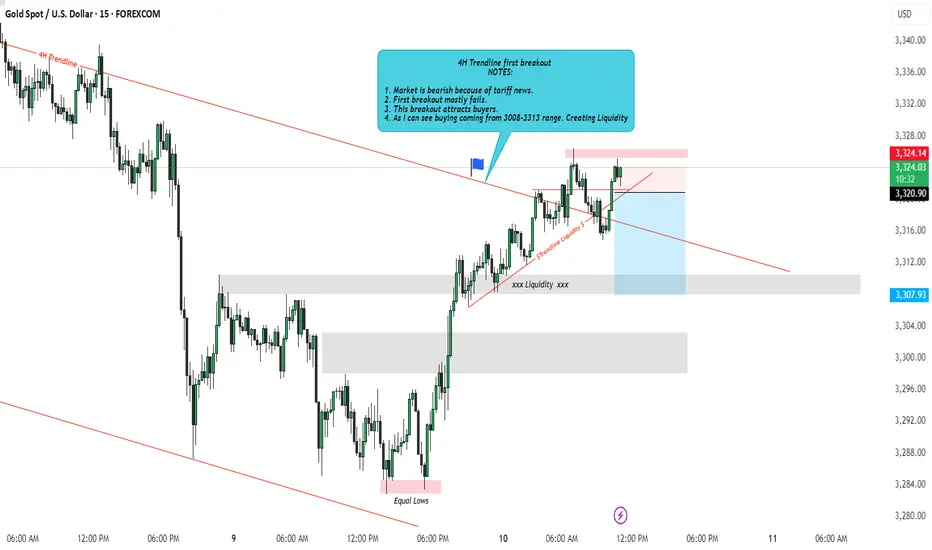
XAUUSD Idea: 4H Trendline First Breakout - Liquidity PlayFOREXCOM:XAUUSD
🔍 Analysis Overview:
Price has just broken above a 4H descending trendline for the first time. However, I remain cautious due to the following key observations:
📌 NOTES:
The broader market sentiment is still bearish due to recent tariff-related news, which often fuels risk-off behavior.
Historically, the first breakout of a strong trendline often fails, trapping early buyers.
This breakout is likely attracting buy-side liquidity, giving institutions an opportunity to hunt stops.
My observation shows buying interest started around the 3308–3313 range, suggesting smart money accumulation and a possible trap.
📉 I'm watching for a fake breakout and potential reversal targeting the liquidity zones marked below around 3307 and possibly lower.
The liquidity sweep below equal lows could offer a better risk-reward setup.
💡 Conclusion:
If price fails to hold above this breakout and shows signs of rejection, I will be anticipating a return towards the previous demand zone for a liquidity grab.
#XAUUSD #GoldAnalysis #SmartMoneyConcepts #LiquidityGrab #ForexTrading #TrendlineBreak #MarketPsychology #TradingSetup #SMC #PriceAction
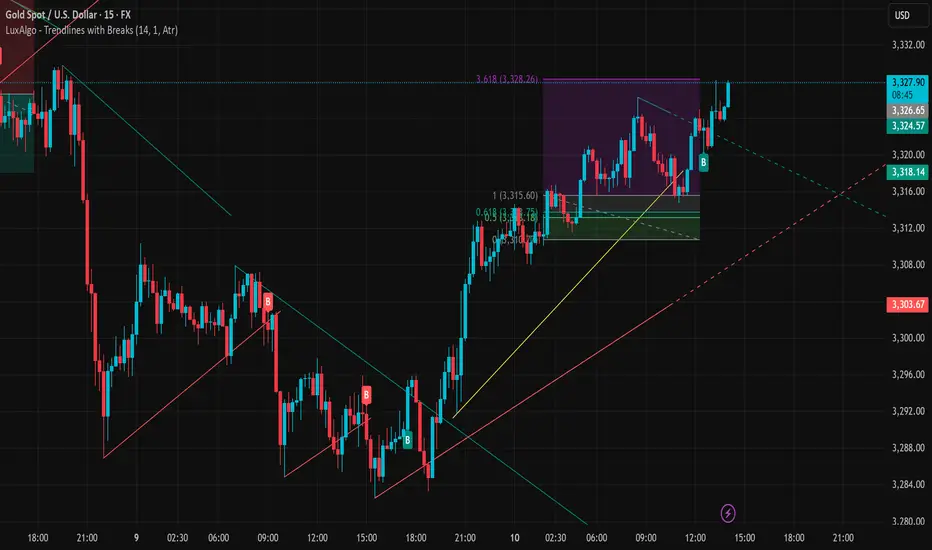
XAUUSD Loses Short-Term Support – Deeper Decline May FollowAt the current moment, gold (XAUUSD) has made a significant breakout, surpassing the key resistance zone at 3,326 USD and is now trading around 3,328.94 USD. This breakout confirms that the short-term bullish trend remains strong.
1. Short-Term Trend: Bullish Momentum Expands
After holding the key support zone around 3,311 – 3,315 USD (aligned with the 0.618 Fibonacci retracement), XAUUSD bounced back and broke above the previous high at 3,326 USD. The current uptrend is confirmed by higher lows and a clear breakout candle from the recent consolidation.
2. Updated Support and Resistance Zones:
Immediate Support: 3,318 – 3,320 USD, near the rising yellow trendline and breakout retest zone.
Next Resistance Target: No clear barrier on the 15-min chart, but psychological levels and Fibonacci extensions suggest 3,332 – 3,335 USD could act as the next upside targets.
3. Price Action Highlights:
The breakout candle closed strongly above the 3.618 Fibonacci extension level (3,326.26 USD), showing solid buying pressure.
A bullish signal ("B") from LuxAlgo was triggered near the minor pullback at 3,318 USD, adding further confirmation.
4. Key Technical Signals:
Price has broken out of the purple rectangle consolidation zone, expanding its trading range.
The 0.618 Fibonacci level at 3,311.78 USD continues to act as firm support.
The ascending yellow trendline remains intact, providing dynamic support to the bullish trend.
5. Suggested Trading Strategy:
Buy on Pullback: Consider long positions around 3,318 – 3,320 USD if price retests this zone with bullish confirmation.
Breakout Continuation Buy: A firm close above 3,330 USD with high volume could signal a move toward 3,335 – 3,340 USD.
If price falls below 3,315 USD and closes weakly, the bullish momentum may begin to fade.
XAUUSD is in an extended bullish phase after breaching the 3,326 USD resistance. As long as price holds above the 3,318 – 3,320 USD zone, there is room for the uptrend to continue.
Do you think gold will break above 3,330 USD? Drop your thoughts in the comments and let’s discuss trading strategies together!
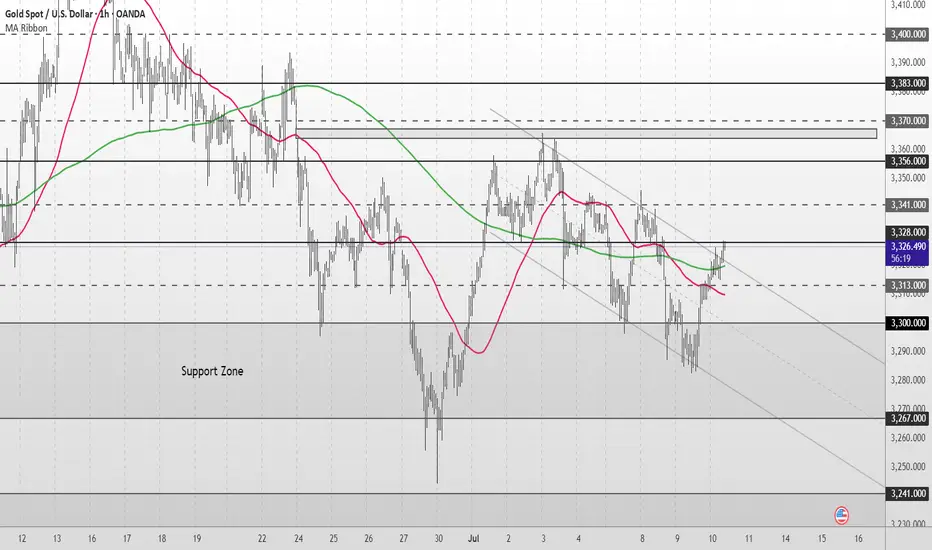
Gold Short Term OutlookGold continues its short-term recovery after bouncing from the Support Zone and reclaiming the $3,300 level. Price is now testing the $3,328 resistance zone, with both the 50MA and 200MA converging just below price.
A confirmed break and hold above $3,328 would open the door to higher resistance levels. However, failure to clear this zone could lead to a retest of the Support Zone. If that fails to hold, a deeper retracement toward the HTF Support Zone may follow.
📌 Key Levels to Watch
Resistance:
‣ $3,328
‣ $3,341
‣ $3,356
‣ $3,383
Support:
‣ $3,313
‣ $3,300
‣ $3,267
‣ $3,241
🔎 Fundamental Focus
All eyes on U.S. unemployment claims today
Expect volatility around the release – stay sharp.
XAUUSD Idea: 4H Trendline First Breakout - Liquidity PlayFOREXCOM:XAUUSD
🔍 Analysis Overview:
Price has just broken above a 4H descending trendline for the first time. However, I remain cautious due to the following key observations:
📌 NOTES:
The broader market sentiment is still bearish due to recent tariff-related news, which often fuels risk-off behavior.
Historically, the first breakout of a strong trendline often fails, trapping early buyers.
This breakout is likely attracting buy-side liquidity, giving institutions an opportunity to hunt stops.
My observation shows buying interest started around the 3308–3313 range, suggesting smart money accumulation and a possible trap.
📉 I'm watching for a fake breakout and potential reversal targeting the liquidity zones marked below around 3307 and possibly lower.
The liquidity sweep below equal lows could offer a better risk-reward setup.
💡 Conclusion:
If price fails to hold above this breakout and shows signs of rejection, I will be anticipating a return towards the previous demand zone for a liquidity grab.
#XAUUSD #GoldAnalysis #SmartMoneyConcepts #LiquidityGrab #ForexTrading #TrendlineBreak #MarketPsychology #TradingSetup #SMC #PriceAction
Waiting for the Perfect Entry: XAUUSD Market Structure Breakdown🔍 Taking a look at XAUUSD today: it’s clearly in a downtrend 📉 on the 4H chart, with consecutive lower highs and lower lows 🔽.
📌 My bias is bearish, and I’m patiently waiting for price action to set up for an entry 🎯.
If we get a break of market structure 🧱, followed by a retest and failure of the current range high 🚫, that could present an opportunity 👀 — not financial advice ⚠️.

Trump blasted Powell again. Interest rates remain unchanged.Information summary:
Trump blasted Powell on Wednesday, saying that the current interest rate is "at least 3 percentage points higher" and once again accused Fed Chairman Powell of "making the United States pay an extra $360 billion in refinancing costs each year." He also said that "there is no inflation" and that companies "are pouring into the United States," and urged the Fed to "cut interest rates."
During the U.S. trading session, gold also showed a significant rebound momentum, rebounding from a low of 3285 to above 3310 in one fell swoop. As of now, gold has stood above 3320.
Market analysis:
From the daily chart:
It can be seen that the first suppression position above gold is currently at 3325, followed by around 3345. Gold did not close above 3320 on Wednesday, which means that even if gold is currently above 3320, as long as today's daily line closes below 3320, it is still in a bearish trend. On the contrary, if the closing price today is above 3320, then the subsequent test of the suppression position near 3345 may be further carried out.
Secondly, from the 4-hour chart, the current suppression position above 4 hours is around 3330-3335. Therefore, today we should focus on this position. If we cannot stand firm and break through the range suppression here in the 4-hour chart, we may retreat again in the future. The key support position below is around 3310, which is the opening price today. If the price is to retreat, it is likely to fall below 3310. But it may also remain above 3310 for consolidation.
However, as long as it falls below 3310, I think the low point near 3285 may be refreshed, so pay attention to this.
Operation strategy:
Steady trading waits for 3310 to fall and break through to short, and the profit range is 3385 or even lower.
Aggressive trading can short near 3340, with a stop loss of 3350.
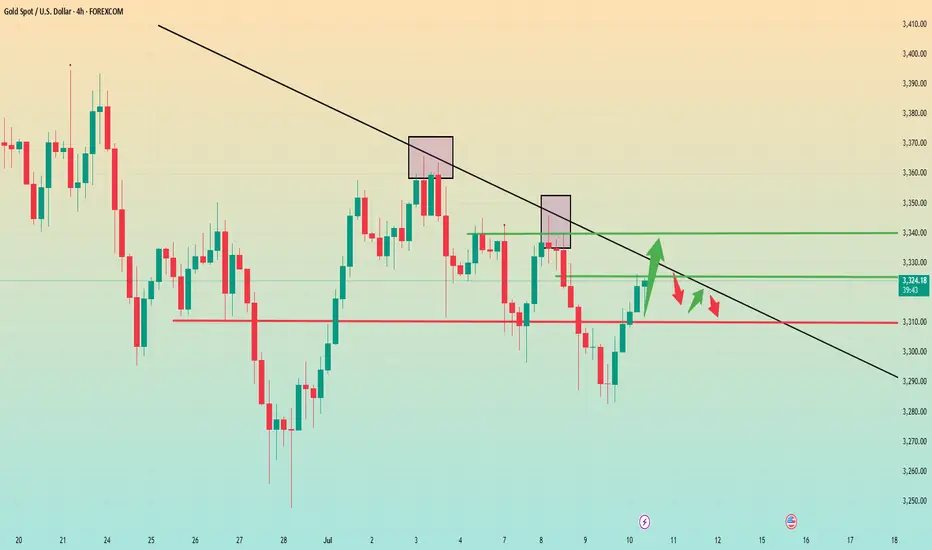
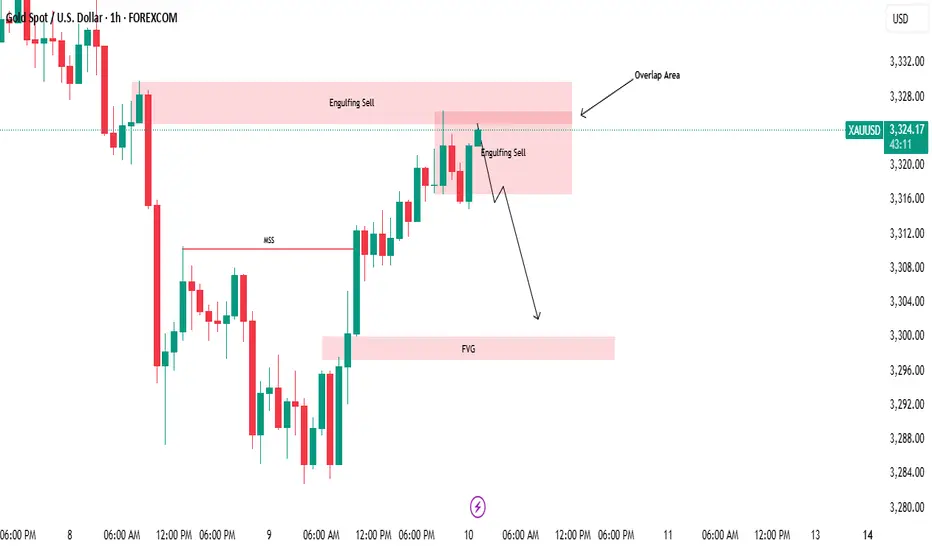
Market Structure Break & Bearish Reaction from Supply Zone.🔍 GOLD – Market Structure Break & Bearish Reaction from Supply Zone
Gold has recently broken its market structure (MSS), which is a significant shift in momentum and a potential indication of a change in the prevailing trend. Following this break, price retraced into a key supply zone, where it was rejected sharply—this rejection came in the form of a strong bearish engulfing candle, highlighting aggressive selling interest.
Interestingly, the market has now printed a second consecutive bearish engulfing from the same zone. This is a powerful signal that sellers are active and defending this level, making it a valid and confirmed short-term resistance zone. The repeated rejection suggests that smart money or institutional sellers may be positioned here.
Given this price action, we can anticipate a potential retracement from the current levels. The most probable downside target for this retracement would be the Fair Value Gap (FVG) that has been marked on the chart. If price respects the FVG and reacts bullishly from there, we may then see a resumption of the uptrend, possibly taking price higher again.
This setup presents a good opportunity for both short-term intraday traders and swing traders to watch for confirmation signals before entering the trade.
📌 Key Takeaways:
MSS indicates shift in trend
Consecutive bearish engulfing candles from supply zone
Sellers likely active in this area
Potential retracement toward marked FVG
Possible bullish continuation from FVG zone
🚨 As always, Do Your Own Research (DYOR) and manage your risk accordingly before making any trading decisions.
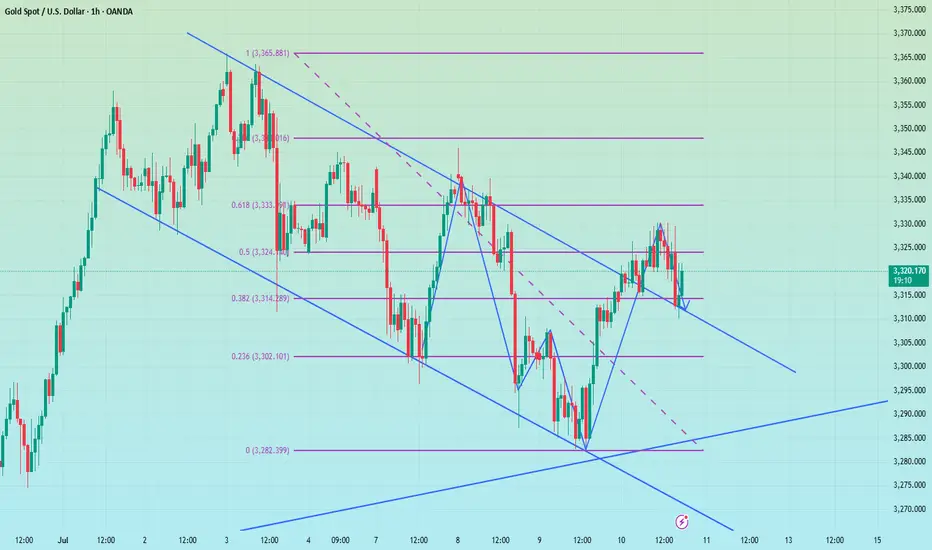
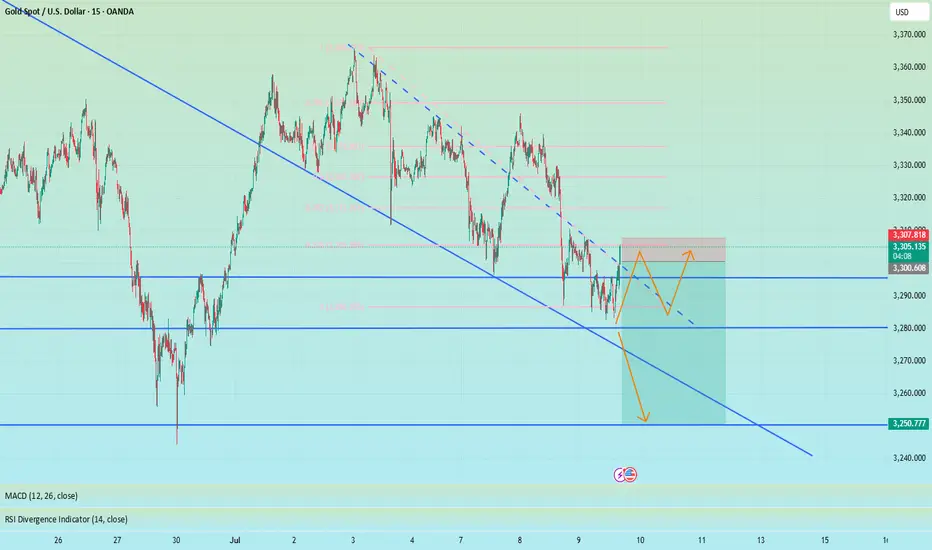
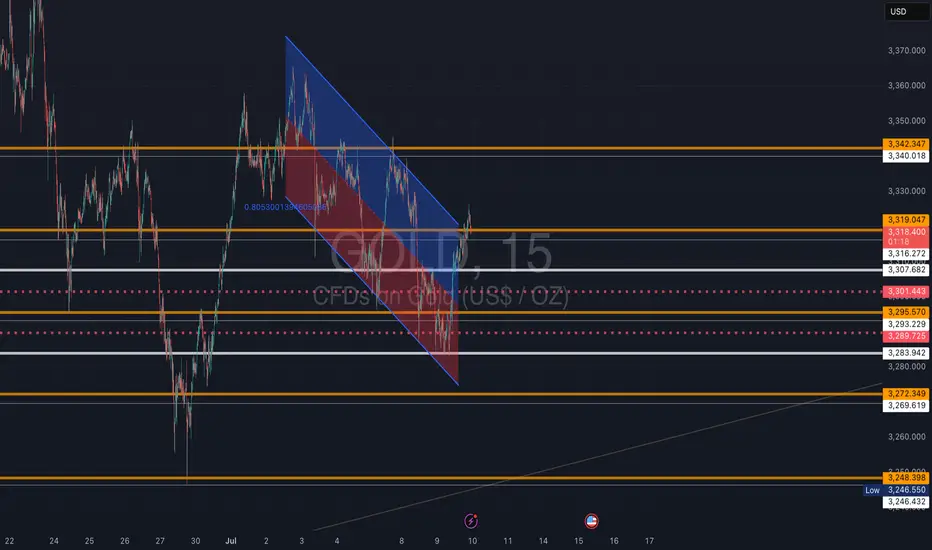
Gold (XAUUSD) Trade Setup – Valid Until July 10, 2025This 15-minute chart shows a clean technical breakout from a falling channel. Here's how to interpret and potentially trade this move:
🧠 Context: What Just Happened
Price was locked inside a descending channel (blue) for multiple sessions.
A breakout occurred above the channel, indicating a potential short-term bullish reversal.
The bounce aligns with recent tariff-related headlines easing off and short-covering momentum building.
I trade these support and resistance lines daily on micro gold futures.
What these lines represent:
Golden Line: Heavy Support or Resistance depending on the price direction towards the lines for major reversal or $10-$15 swings.
Silver Lines: Consolidation areas or mid way support and resistance for a scalping few touches.
Bronze dotted lines: Low volume days support and resistance for a quick $5 up or down.
Also, I can see a directional setup. Here is a hypothetical scenario that could play out:
📌 Key Zones to Watch
🔼 Resistance $3,342 Next major target / sell zone
🟧 Resistance $3,319 Current breakout level retest
⚪ Support $3,307–$3,316 Minor consolidation area
🔻 Support $3,295–$3,289 Strong demand / invalidation
🚨 Bear Pivot $3,272 Break below = bearish return
🧭 Trading Playbook
Bullish Bias (Preferred Scenario)
✅ Break and hold above $3,319 = potential move to $3,342
🎯 Target: $3,340–$3,342
🔒 SL below: $3,307
Optional re-entry on retest of $3,316 zone
Bearish Reversal (If Bulls Fail)
⚠️ If price fails $3,319 and breaks back below $3,307, sellers may reclaim control
📉 Look for short setups toward $3,295 and even $3,272
SL above: $3,319
📌 Key Tip
Watch for volume confirmation and 5m candle closes at each level. Don’t chase — let price come to your levels.
⏳ Validity
This setup remains valid through July 10, or until $3,342 target is hit or $3,272 is broken.
This is not financial advice; it's for educational purposes only.
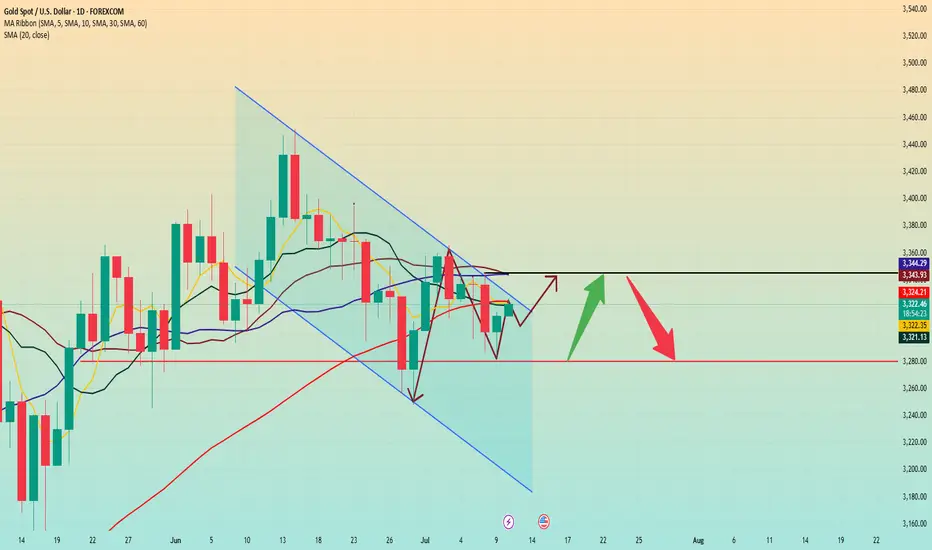
Gold rose. Trend reversed.Gold rose slightly in early Asian trading on Wednesday, but fell under pressure near 3308. It fluctuated in the European trading range of 3296-3282. It broke through the US trading range and rose to around 3317 in the late trading. The daily line closed with a positive line with a lower shadow.
After a sharp drop on Tuesday, gold showed a downward recovery trend on Wednesday and closed positive. It rose slightly in early Asian trading today. From the daily level, in the short term, we should first pay attention to the resistance near 3325-3330. This area brings together the current positions of the 5-day moving average, the 10-day moving average and the 60-day moving average, which is an important gateway for the game between long and short forces in the short term. If the gold price continues to be under pressure in this area, it means that the short-term upward momentum is insufficient, and we need to be alert to the risk of a market decline.
If the above resistance area can be broken and the price continues to rise strongly, the next target will be the resistance near 3345, which is not only the high point on Tuesday, but also the current location of the 20-day moving average and the 30-day moving average, which has a strong technical resistance significance.
In terms of support below, first pay attention to the support near 3280, which is the current support level of the trend line formed by the low points of May 15 and June 30, which provides certain support for the gold price.
Operation strategy:
Short at price rebound near 3345, stop loss at 3355, profit range 3320-3300
Long at price drop near 3315, stop loss at 3305, profit range 3320-3340
Gold is in the Bearish direction from a Support levelHello Traders
In This Chart GOLD HOURLY Forex Forecast By FOREX PLANET
today Gold analysis 👆
🟢This Chart includes_ (GOLD market update)
🟢What is The Next Opportunity on GOLD Market
🟢how to Enter to the Valid Entry With Assurance Profit
This CHART is For Trader's that Want to Improve Their Technical Analysis Skills and Their Trading By Understanding How To Analyze The Market Using Multiple Timeframes and Understanding The Bigger Picture on the Charts

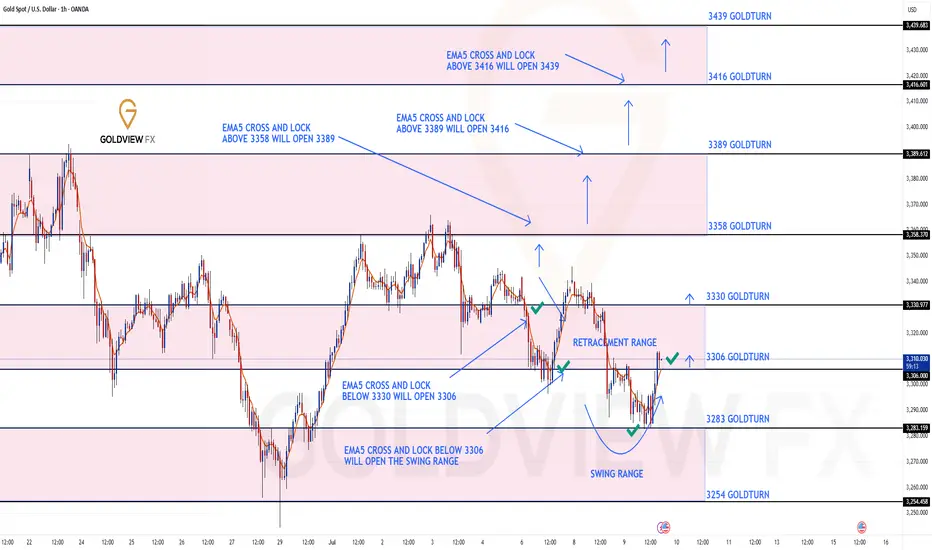
GOLD ROUTE MAP UPDATEHey Everyone,
Absolutely beautiful to see our 1h chart idea playing out perfectly. After completing the bearish targets earlier this week, we had the ema5 cross and lock below 3306 opening the swing range.
- This played out perfectly hitting the first swing range level and doing exactly what it say son the tin giving the full swing into 3306 just like we highlighted.
We will now look for ema5 lock above 3306 for a continuation into the bullish targets above or failure to lock will see rejections into the lower Goldturns for suport and bounce.
If it continues to fail breakout above, into the first Bullish target, then we are likely to see the full swing range tested on the rejections.
We will keep the above in mind when taking buys from dips. Our updated levels and weighted levels will allow us to track the movement down and then catch bounces up.
We will continue to buy dips using our support levels taking 20 to 40 pips. As stated before each of our level structures give 20 to 40 pip bounces, which is enough for a nice entry and exit. If you back test the levels we shared every week for the past 24 months, you can see how effectively they were used to trade with or against short/mid term swings and trends.
The swing range give bigger bounces then our weighted levels that's the difference between weighted levels and swing ranges.
BULLISH TARGET
3358
EMA5 CROSS AND LOCK ABOVE 3358 WILL OPEN THE FOLLOWING BULLISH TARGETS
3389
EMA5 CROSS AND LOCK ABOVE 3389 WILL OPEN THE FOLLOWING BULLISH TARGET
3416
EMA5 CROSS AND LOCK ABOVE 3416 WILL OPEN THE FOLLOWING BULLISH TARGET
3439
BEARISH TARGETS
3330 - DONE
EMA5 CROSS AND LOCK BELOW 3330 WILL OPEN THE FOLLOWING BEARISH TARGET
3306 - DONE
EMA5 CROSS AND LOCK BELOW 3306 WILL OPEN THE SWING RANGE
3283 - DONE
3254
As always, we will keep you all updated with regular updates throughout the week and how we manage the active ideas and setups. Thank you all for your likes, comments and follows, we really appreciate it!
Mr Gold
GoldViewFX
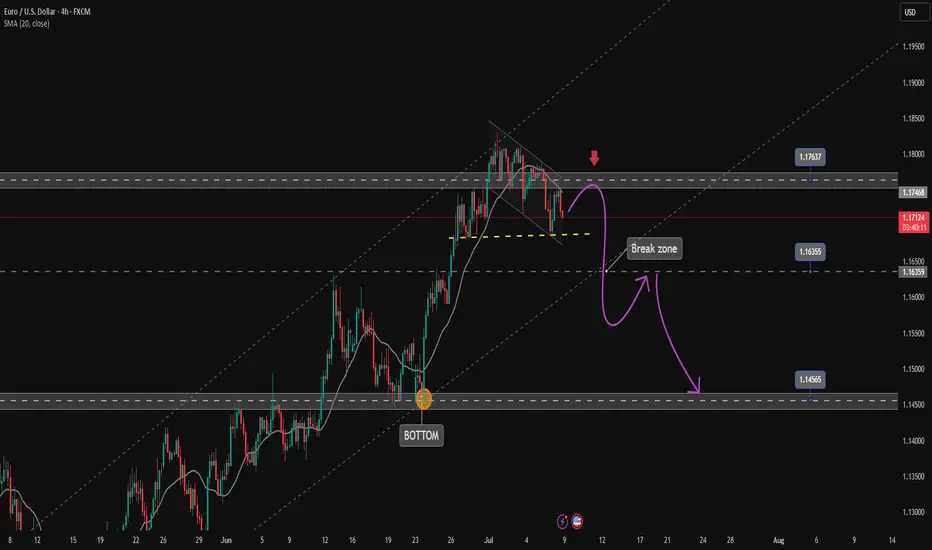
Confirming EURUSD corrective downtrend✏️EURUSD is trading in a downtrend channel. SELL signal is triggered at the current price around 1.172 as the H4 candle failed to break 1.176 and confirmed the Sellers' entry into the market clearly. Target for the downtrend is at 1.145, the Sellers' strength needs to overcome the Break out zone of 1.163 first.
📈 Key level
Support 1.163-1.146
Resistance 1.176
SELL DCA Trigger: Break 1.163
BUY Trigger: The price trades about 1.163.