XAUUSD Trade Setup Short📉 Trade Idea: Sell XAU/USD
Entry Zone: 3290–3293
Stop Loss (SL): 3300 (tight risk cap above resistance)
Take Profit (TP): 3270 (next support level)
🔍 Explanation:
🟠 Trade Logic:
Expecting price to reject 3290–3293, possibly a minor resistance zone or lower high in a downtrend.
A break below 3290 signals weakness continuation, with sellers in control.
TP at 3270 targets the next meaningful support area, offering a decent reward.
Goldprediction
Data is about to be released. Where will gold go?Yesterday, the market expected a trade agreement between the United States and its trading partners, which boosted risk sentiment, and the strengthening of the US dollar and the rise in US bond yields further added pressure on gold prices. Gold fell 1% during the day and once lost the $3,300 mark during the session.
After gold bottomed out and stabilized at 3,320 on Monday, it fell sharply above 3,320 again on Tuesday and has now completely fallen below 3,320. The position of 3,320 is very important. In the 3,320-50 range, it chose to break down at 3,320 again.
Today, the Federal Open Market Committee of the United States will release the minutes of the June monetary policy meeting. Although Federal Reserve Chairman Powell remained neutral on the June interest rate decision, many Federal Reserve officials released dovish signals. Federal Reserve Board member Bowerman has turned to support the possibility of a rate cut in July.
From a technical point of view, the market has penetrated into the area around the lower support of 3,275-3,295.
The rhythm of the entire market is still a process of oscillating decline. From the perspective of pressure position, the daily MA5 average line has not fallen below, and may fall again to around 3270. Once the market falls too fast and approaches this position, there is a high probability that there will be a rebound demand.
Operation strategy:
Buy near 3375, stop loss at 3365, profit range 3315-3320.
Continue to hold position after breakthrough.
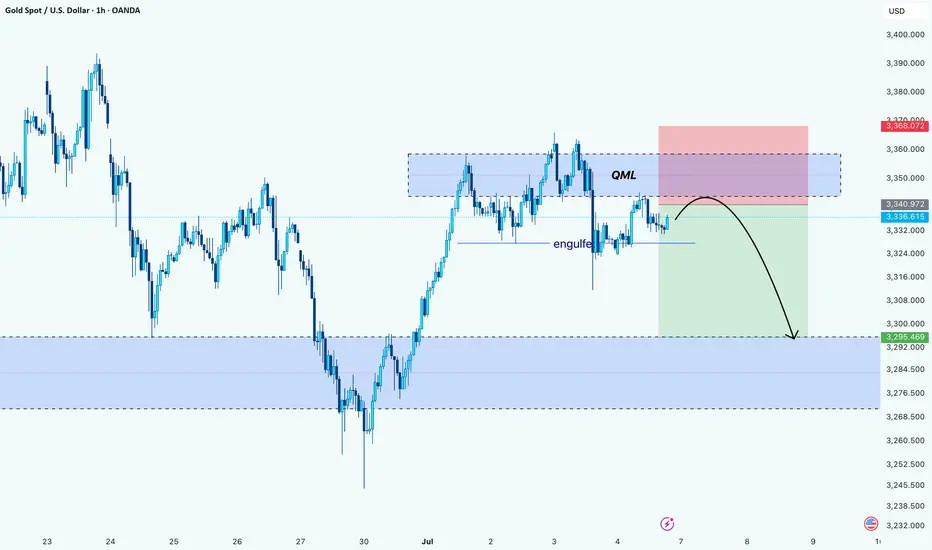
Gold’s Trap Above QML: Bearish Play UnfoldingHello Guys!
Gold appears to be forming a textbook Quasimodo reversal setup after printing a lower high into a key supply zone. Price aggressively tapped into the QML area (around 3,350–3,360), where sellers previously stepped in, and we’re now seeing signs of rejection.
The engulf zone marked earlier confirms bearish intent. It broke structure and flipped momentum. Price is currently retesting below that engulf level, likely as a last attempt to grab liquidity before heading down.
The projected move suggests a drop toward the next significant demand zone around 3,295–3,285, where the price previously found a strong bullish reaction.
Bias: Bearish below QML
Target: 3,295 zone
Invalidation: Above 3,368 (high of supply zone)
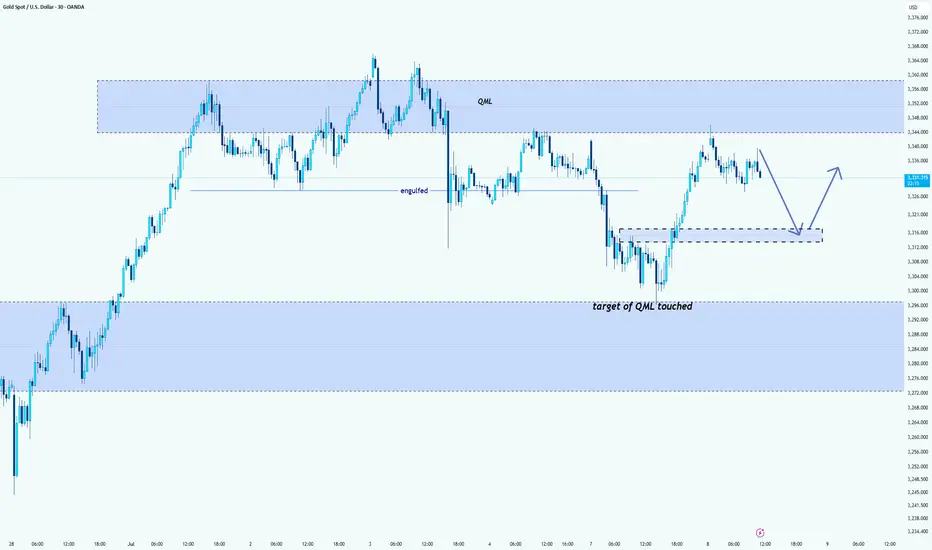
Gold (XAU/USD): Playbook in ActionHello guys!
We’ve seen a textbook QML (Quasimodo Level) setup play out beautifully on gold. Price pushed into a key supply zone and formed a QML structure, followed by a clean engulfing of the previous demand. confirming smart money involvement. As expected, the target of that QML has now been hit, tapping into the major demand zone below.
After the deep sweep and reaction from demand, price retraced upward into a potential lower high area. Based on structure and liquidity dynamics, two potential scenarios are in play:
We’re executing a two-step plan here:
Step 1: Short position from the QML + supply area, aiming for the next blue demand zone. Liquidity has been taken above the high, confirming the setup.
If we get a clean reaction near the blue area, that’s our signal to flip long. We expect a pullback toward $3310 area.
GOLD Intraday H2 Chart update for 9 July 2025Hello Traders
as you can see that we have strong resistance on 3310 level only break above that level will consider bullish move
Below 3300 Psychological level market remains Bearish and move towards 3245 level
FOMC Meeting minutes dues today
Disclaimer: Forex is Risky

XAUUSD SELL ANALYSIS SETUP READ (CAPTION)hi trader's. what do you think about gold
current price: 3293
gold is breakout low 3289 in (H1) candle pettran and now gold resistance zone 3295 and 3308 and gold is reject this area and create sell candle then gold fall down
resistance zone: 3295-3308
target : 3270-3250
stop loss: : 3310
please don't forget to like comment and follow thank you

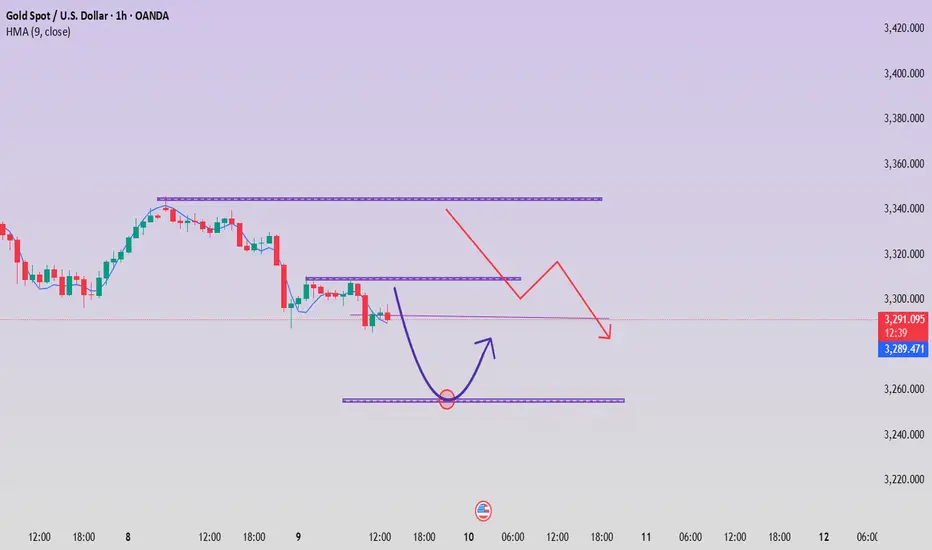
Buy Gold! The short-term bottom may have appeared!Gold continued to retreat yesterday and hit a recent low, reaching around 3287. Then gold gradually rebounded to above 3300. Relatively speaking, the rebound momentum was weak. It is expected that the long and short sides will fight fiercely around 3300. However, from the recent characteristics of gold operation, it can be seen that although the short position of gold is strong, it is difficult to continue in the short term, and I think the short-term decline of gold is basically in place, so at this stage, in terms of short-term trading, I do not advocate shorting gold directly;
As gold did not continue to fall after reaching around 3287, on the contrary, it gradually rebounded to above 3300, which may strengthen the market's consensus on the short-term bottom, thereby attracting the favor of off-site funds; from the current gold structure, if gold can maintain above 3300-3295, it may be combined with the 3287 low to build a "W" double bottom structure, which is conducive to supporting the rebound of gold.
However, as gold fell below 3300 again, the bearish trend is relatively strong, so we need to moderately lower our expectations for a gold rebound. In the short term, gold is under pressure in the 3315-3325 area, so we can temporarily look to this area for the rebound target. Therefore, in short-term trading, I do not advocate shorting gold directly, and you can first consider going long on gold in the 3300-3295 area, TP: 3310-3320-3330.
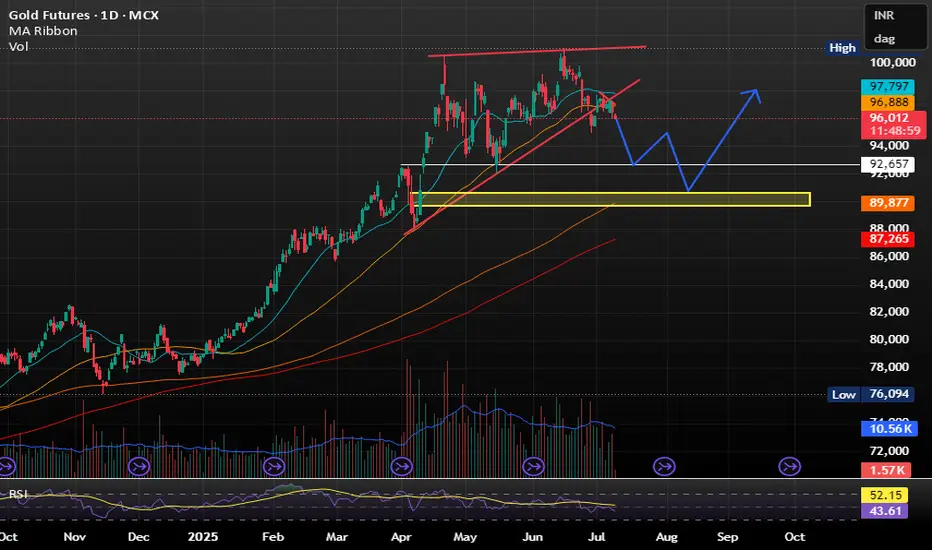
GOLD IS MELTING LIKE A ICEGOLD IS MELTING LIKE A ICE -
Trading below 20SMA and 50SMA making it less attractive at current price level.
ALSO RELATIVE STRENGH IS WEAKNING .
As per my view Sell on rise will be profitable for short term .
DOWNSIDE TARGET SHOULD BE WITHIN 92000 TO 90000 .
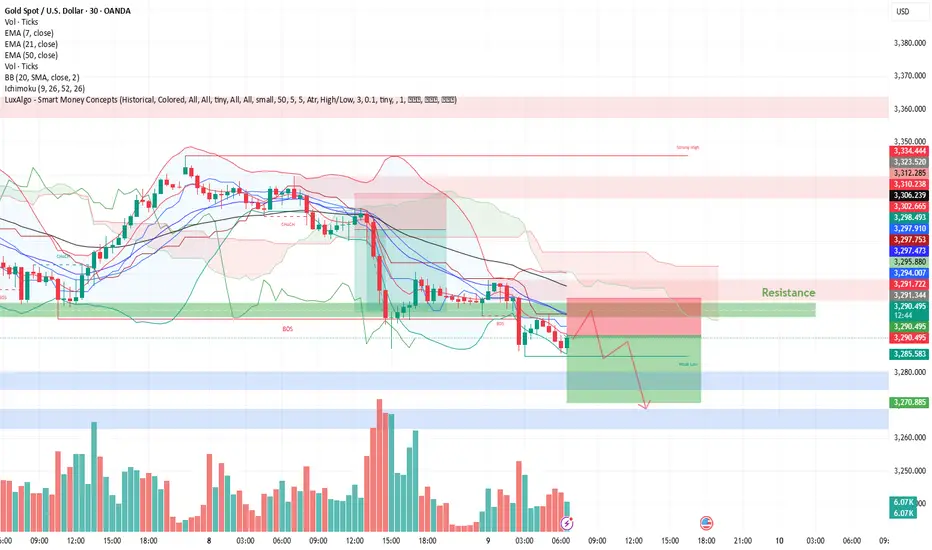
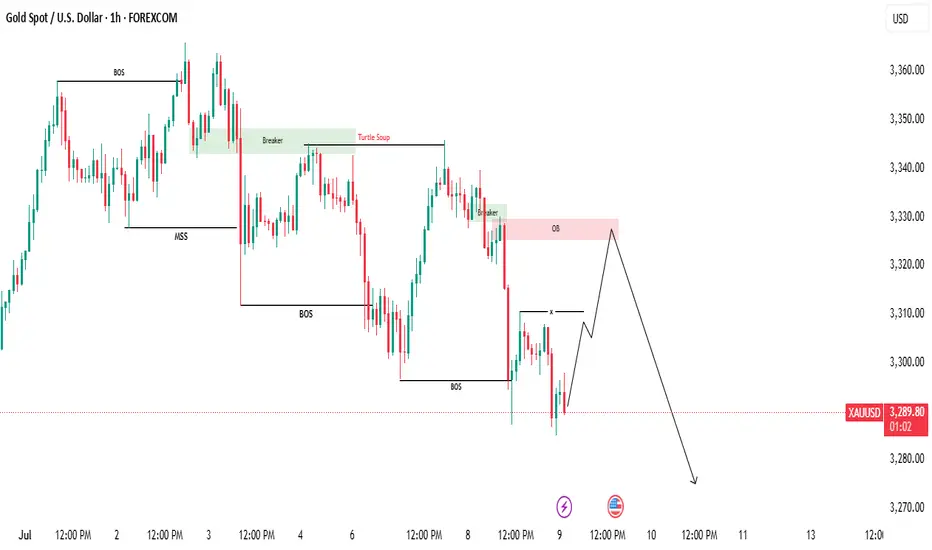
A High-Probability Play Unfolding!🌟 GOLD MARKET OUTLOOK – A High-Probability Play Unfolding! 🟡📉
Gold was riding a solid uptrend recently, showing strength across the board. But over the past few days, things have started to shift. We've seen a clear Market Structure Shift (MSS) followed by a Break of Structure (BOS) to the downside — signaling the start of a short-term bearish trend.
📍 What’s Happening Now?
Gold is currently trading lower after the BOS, but the market is now approaching a critical phase...
We’re expecting a retracement move to the upside — a temporary pullback that could trap early buyers (this is called inducement). This is where things get interesting!
🎯 What to Watch For:
Once the retracement plays out, we’ll be watching closely for:
🔻 Bearish Fair Value Gaps (FVGs)
🔻 Supply Zone Order Blocks
These areas could offer us high-probability sell entries aligned with the overall bearish momentum.
📉 The Target?
We’ll be aiming for the previous swing low, where liquidity is likely resting — a classic price magnet in such setups.
⚠️ Be Patient. Let the Market Come to You.
Wait for the retracement, let price fill the gaps, and only then look for confirmation to enter. Rushing in now means going against smart money flow.
🧠 DYOR – Do Your Own Research!
This is a market roadmap, not a signal.
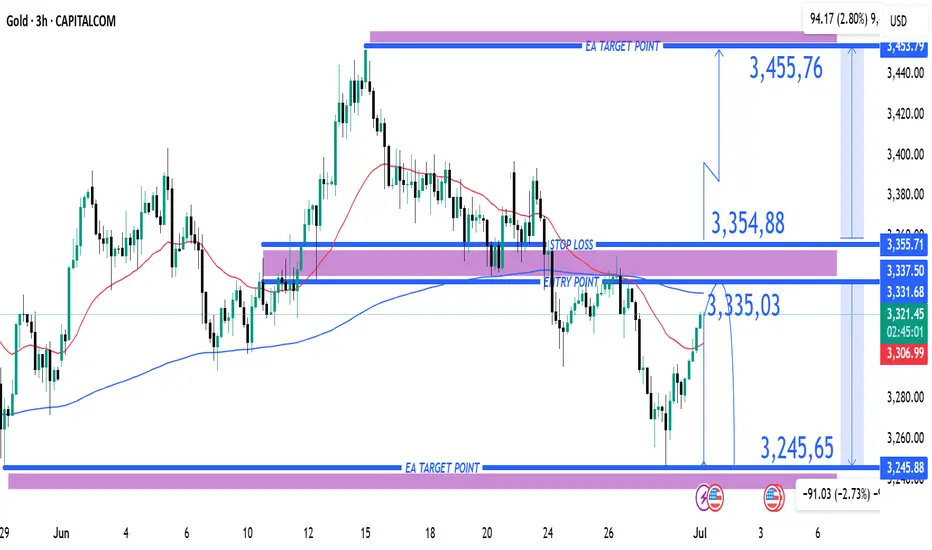
(XAU/USD) 3H Chart – Bearish Reversal Setup from Resistance Zon1. Entry Point (Sell):
Marked at 3,335.03
This is a key resistance level where price is expected to reverse downward.
2. Stop Loss:
Placed above at 3,354.88
This acts as a protection level in case the trade goes against the direction.
3. Take Profit Targets (EA Target Points):
TP1 (Downside): 3,245.65
TP2 (Upside - if Stop Loss is hit): 3,455.76 (in case of reversal or long position)
4. Price Action Observation:
Price is currently around 3,320.56, climbing back toward the entry zone.
The red 50-period moving average (EMA) and blue 200-period MA show convergence, often preceding volatility.
---
📉 Bearish Scenario (Main Setup)
Sell Bias is expected from the 3,335 region.
If price respects the resistance zone and breaks down again, the target is 3,245.65, yielding approximately 90-point move.
This is a risk-reward favorable setup, with:
Risk: ~20 points
Reward: ~90 points
RRR ≈ 1:4.5
---
⚠️ Bullish Invalidity (Stop Loss Hit)
If the price breaks and closes above 3,354.88, it invalidates the bearish setup.
Then, the market may shift towards targeting 3,455.76 — about 100 points to the upside.
---
🔧 Technical Factors Supporting the Setup
Supply zone marked by the purple box around the entry.
Trend previously bearish — recent upward move may just be a retracement.
Confluence with MAs: Price is testing MAs — rejection here would add bearish confirmation.
---
✅ Summary of Trade Setup
Element Value
Entry 3,335.03
Stop Loss 3,354.88
Take Profit 3,245.65
Alt Target 3,455.76 (if SL hit)
Risk-Reward ~1:4.5
Bias Bearish (Sell Setup)
Gold fell under pressure, and the watershed is 3321.
⭐️Gold Information:
During the Asian session on Wednesday, gold prices (XAU/USD) continued to be under pressure, falling below the $3,300 mark, hitting the lowest point in more than a week. The decline in gold prices comes as the market generally believes that the Federal Reserve (Fed) will maintain high interest rates for a longer period of time, especially as the market expects that tough U.S. tariffs may exacerbate inflation in the coming months.
Such expectations have pushed up U.S. Treasury yields and stabilized the U.S. dollar (USD) near a two-week high hit on Tuesday - a key resistance for the non-yielding precious metal, which continues to face downward pressure.
⭐️Personal comments:
Gold price fell below support, Dow Jones H1 pattern, gold price fell below 3300
⭐️Set gold price:
🔥Sell gold area: 3344-3446 SL 3351
TP1: $3335
TP2: $3320
TP3: $3302
🔥Buy gold area: $3256-$3254 SL $3249
TP1: $3268
TP2: $3280
TP3: $3298
⭐️Technical analysis:
Set reasonable sell orders based on technical indicators EMA 34, EMA89 and support and resistance areas.
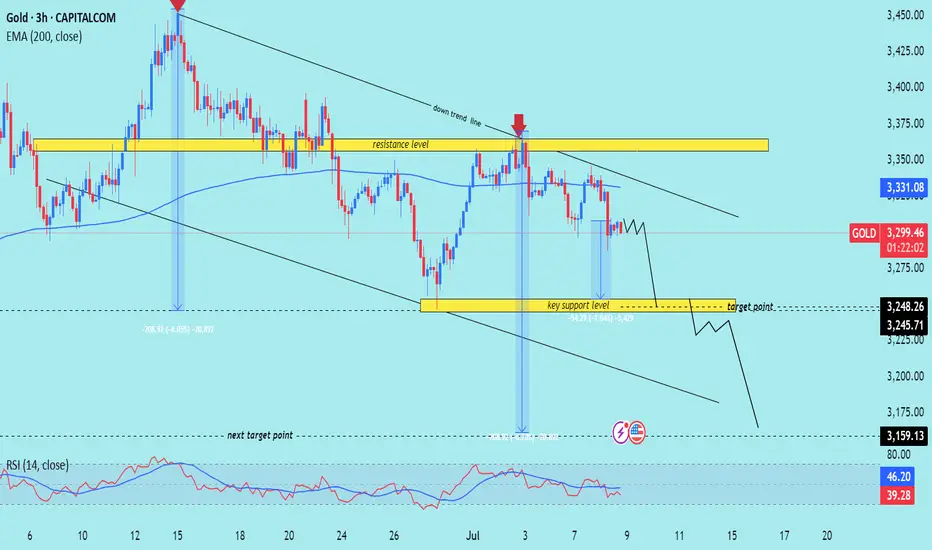
XAU/USD) bearish Trand analysis Read The captionSMC trading point update
Technical analysis of (XAU/USD) on the 3-hour timeframe, projecting further downside after rejection from a resistance zone aligned with a descending trendline.
---
Analysis Summary
Trend Bias: Bearish
Current Price: ~$3,301.96
Structure: Price is respecting a descending channel, with multiple rejections from the upper boundary and key resistance zone.
---
Key Technical Insights
1. Resistance Zone & Downtrend Line:
Price was rejected from a resistance block near the EMA 200 (~$3,331) and descending trendline.
This level has repeatedly triggered strong downside moves (highlighted with red arrows).
2. EMA 200 Reaction:
The EMA 200 at $3,331.10 is acting as dynamic resistance.
Each time price reaches or crosses above this line, selling pressure increases.
3. Bearish Price Projection:
After recent rejection, the chart anticipates a pullback to the support zone between $3,248.26 and $3,245.71.
A deeper drop toward $3,159.13 is projected as a next major target, consistent with previous price moves.
4. RSI Indicator:
RSI at 40.24 suggests bearish momentum is still in play but not yet oversold—indicating room for more downside.
---
Bearish Trade Idea
Element Level / Description
Entry Zone Below resistance: $3,310–$3,320
Target 1 $3,248.26–$3,245.71 (support zone)
Target 2 $3,159.13 (channel base / next support)
Stop-Loss Above $3,335 (above resistance zone)
---
Risk Considerations
Fundamental catalysts: Gold is sensitive to USD strength, interest rate decisions, and macroeconomic data.
Invalidation: A strong breakout and close above the descending trendline and EMA 200 would negate the bearish outlook.
---
Summary
This analysis outlines a bearish setup for XAU/USD, supported by trendline resistance, EMA rejection, and RSI momentum. If current structure holds, a move toward the $3,245 and $3,159 levels is likely.
Please support boost 🚀 this analysis)
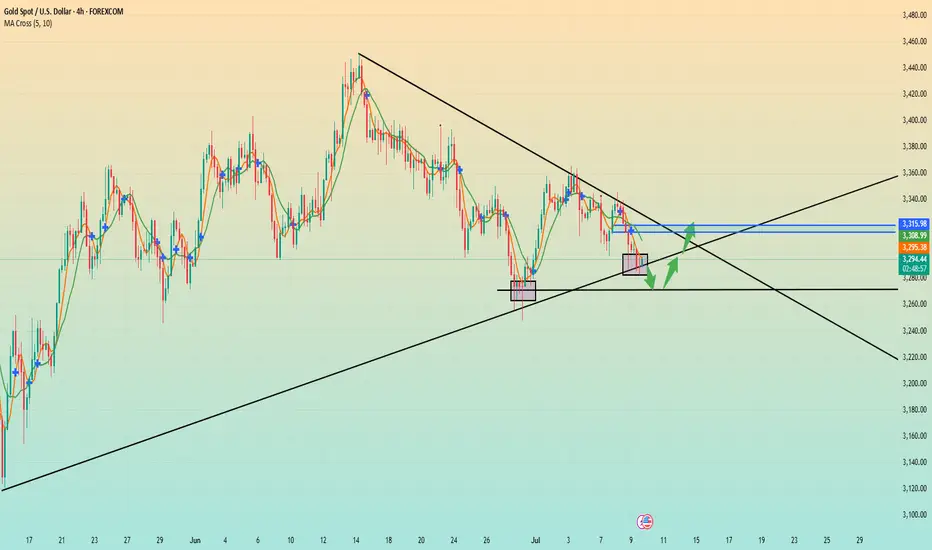
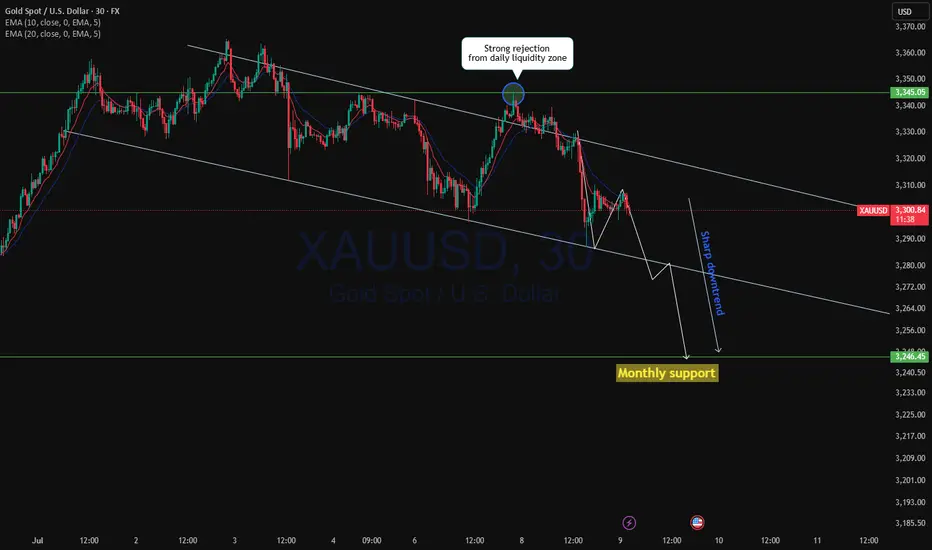
XAUUSD Continue to drop?XAUUSD from daily resistance of 3345.00 after strong liquidity grab price started to fall with strong momentum to the daily support level. Yesterday we have seen a long daily doji formed with a long wick at the bottom followed by wick fill as expected with long bearish engulfer with both cross over of 10ema and 20ema.
Currently price in sharp downtrend and possibility to drop to monthly support below 3250.00
A bearish trade is high probable.
Gold shocks and alternating long and short ideas
💡Message Strategy
As we mentioned before, the upper 3345-50 is the suppression position after the non-agricultural data last week. We can short at the 45-50 line when it rebounds. Yesterday, we also gave the idea of going long at the 3295-3301 line. At midnight, gold rebounded perfectly above the 3330 line and closed at the 3336 line.
Today we continue to pay attention to the short-term suppression of the 3345-50 line. If the rebound does not break, we will intervene in the short order. After all, the technical side needs to be adjusted and repaired during the day. We try to grasp the good entry position for operation. If your current gold operation is not ideal, welcome to communicate!
📊Technical aspects
From the 1-hour analysis, the short-term support of 3290-3295 is concerned below, the short-term resistance above is concerned about the 3345-50 line, and the suppression of 3365-70 is focused on. The overall main tone of high-altitude low-multiple cycle participation remains unchanged. In the middle position, watch more and do less, and follow orders cautiously, and maintain the main tone of participation in the trend. Wait patiently for key points to participate. Pay attention to the specific operation strategy in time.
💰Strategy Package
Long Position:3290-3300,SL:3275,Target: 3320-3340
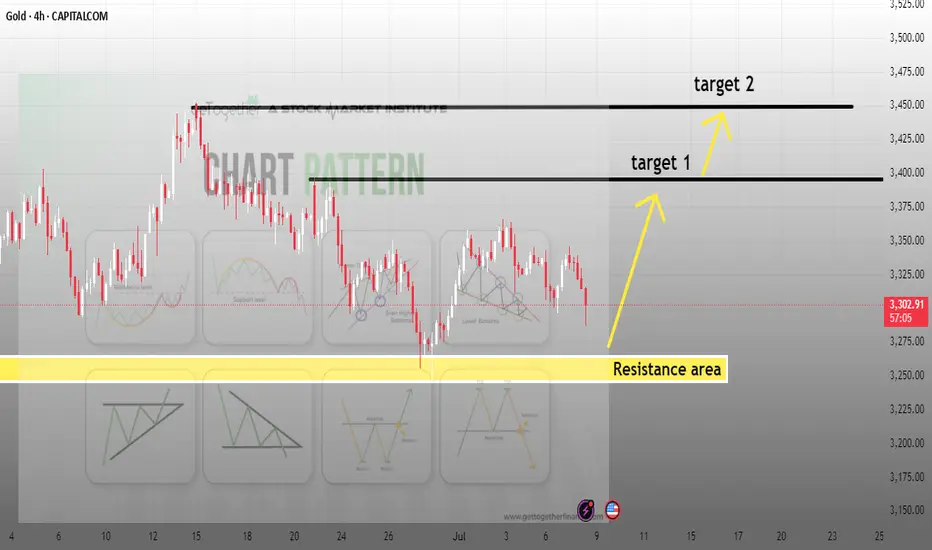
XAUUSD h4 buying target levelsGOLD (XAU/USD) - 4H Analysis
Price is currently reacting from a well-defined support zone (demand area) near $3,250–3,270, which previously acted as strong resistance and now flipped to support.
🔍 I'm watching for bullish confirmation from this zone for a potential upward move toward the next resistance levels.
🎯 Targets:
Target 1: $3,400 (First key resistance)
Target 2: $3,460 (Major resistance & previous high)
📉 If price fails to hold above the support area, this setup will be invalidated. Risk management is key.
This idea is based on structure breakout and price respecting previous resistance turned support zone.
📊 Levels:
Support (Entry Area): $3,250 – $3,270
Target 1: $3,400
Target 2: $3,460
Invalidation Below: $3,240
#GOLD #XAUUSD #PriceAction #TradingSetup #BuySetup #4HChart #ForYou #BreakoutTrade #SmartMoney #ForexAnalysis #LiquidityGrab
CAPITALCOM:GOLD
Short-term gold bulls and bears are anxious,3330 becomes the keyAt present, the market has been fluctuating narrowly in the range of 3330-3320, and both bulls and bears are in a stalemate. However, gold has formed a double-layer head and shoulders bottom pattern, so the short-term bullish trend is definitely unchanged. In the previous post, I also mentioned that if the rebound in the European session is weak and gold continues to be below 3345, then the short-term NY session may usher in a retracement and a second bottom. Therefore, I still hold a long order of 3325-3315, and temporarily modify the TP to the 3335 line. I expect that there may be a retracement here, but there may also be a direct retracement. No matter what the situation is, we need to stabilize before entering the market.
In addition to investment, life also includes poetry, distant places, and Allen. Facing the market is actually facing yourself, correcting your shortcomings, facing your mistakes, and exercising strict self-discipline. I share free trading strategies and analysis ideas every day for reference by brothers. I hope my analysis can help you.
PEPPERSTONE:XAUUSD FOREXCOM:XAUUSD FX:XAUUSD FXOPEN:XAUUSD OANDA:XAUUSD TVC:GOLD
How to solve the problem of order being trapped in a loop📊 Gold Day Trading Strategy (Recommendation index ⭐️⭐️⭐️⭐️⭐️)
📰 News information:
1. The lasting impact of new tariffs
2. The impact of geopolitical conflicts
3. The Fed’s interest rate cut
📈 Technical Analysis:
The recent market conditions have been volatile. Many brothers have reported that they have been trapped recently. They have just been released from short positions, but have fallen into the situation of being trapped by long orders again. I have also encountered such a situation recently. Brothers who follow me must know that I have been trapped, but in the process of being trapped, I still share my trading ideas for the brothers who are trapped to check, so that we can all get out of the trap.
Gold fell as expected and hit the lowest point of 3287 before rebounding. The current 3300-3290 range given at the bottom has certain support. At present, I have answered it. As long as it does not fall below 3285, we can still go long and look for rebound correction. TP can temporarily look at 3305-3310. At present, the short-term upper watershed is near the 3321 line. As time goes by, the medium-term point can be seen at 3345. Only when the price stands above 3345 can the upward momentum continue to touch the 3380 line, or even 3400. In the short term, you can go long if you look at the support below. In the short term, pay attention to the resistance above 3315-3320. If it encounters resistance under pressure, it will fall back. On the contrary, after breaking through the first level of resistance, the upward trend will continue.
🎯 Trading Points:
BUY 3300-3290-3285
TP 3305-3315-3320-3345
SELL 3315-3321
TP 3300-3290
In addition to investment, life also includes poetry, distant places, and Allen. Facing the market is actually facing yourself, correcting your shortcomings, facing your mistakes, and exercising strict self-discipline. I share free trading strategies and analysis ideas every day for reference by brothers. I hope my analysis can help you.
TVC:GOLD OANDA:XAUUSD FXOPEN:XAUUSD FX:XAUUSD FOREXCOM:XAUUSD PEPPERSTONE:XAUUSD

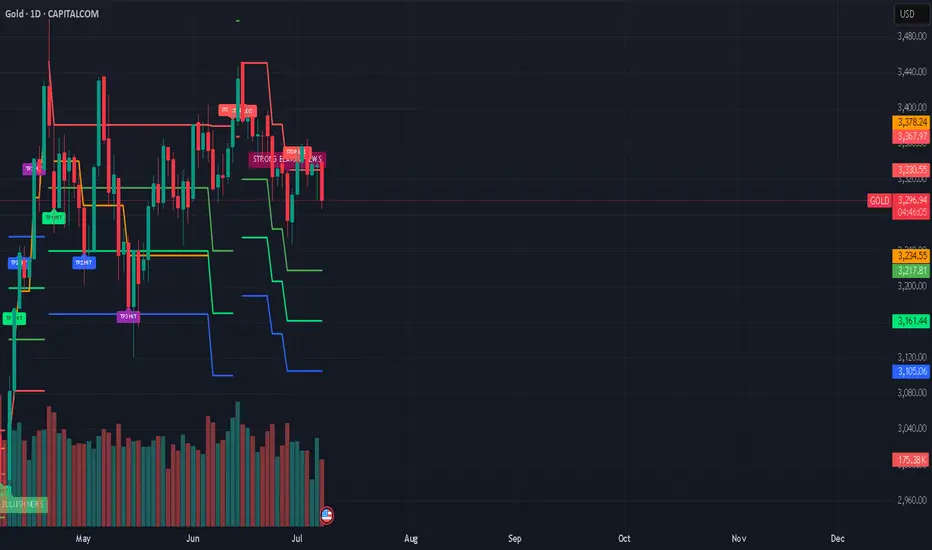
Gold: Potential Correction on the Horizon?Gold has long been regarded as a safe haven asset, drawing the attention of investors during periods of economic uncertainty. In recent years, gold prices have reached historic highs, fueled by inflation concerns, geopolitical tensions, and shifts in monetary policy. However, as with any asset experiencing a prolonged rally, the question arises: Is a correction in gold prices imminent?
Understanding the Recent Gold Rally
Several factors have contributed to gold’s impressive performance:
Inflation Hedge: Persistent inflation has driven investors toward gold as a store of value.
Geopolitical Risks: Ongoing conflicts and global tensions have increased demand for safe haven assets.
Monetary Policy: Central banks’ dovish stances and low interest rates have made non-yielding assets like gold more attractive.
Several scenarios could catalyze a correction in gold prices:
Unexpected Economic Recovery: Stronger-than-expected economic data could reduce demand for safe haven assets.
Aggressive Rate Hikes: Faster-than-anticipated interest rate increases could shift investor preference away from gold.
Resolution of Geopolitical Tensions: Any de-escalation in major geopolitical hotspots may dampen gold’s appeal.
#gold #commodity #commodities #metals #trading #portfolio
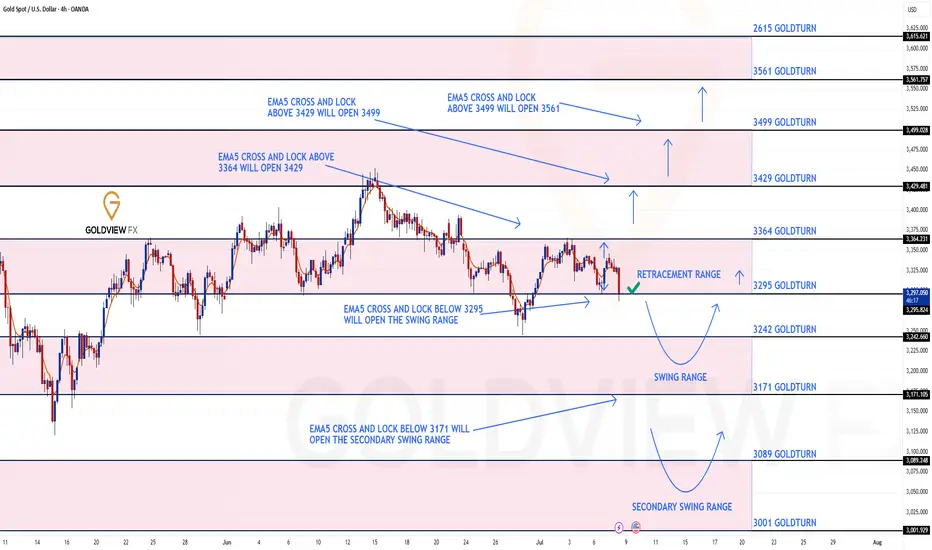
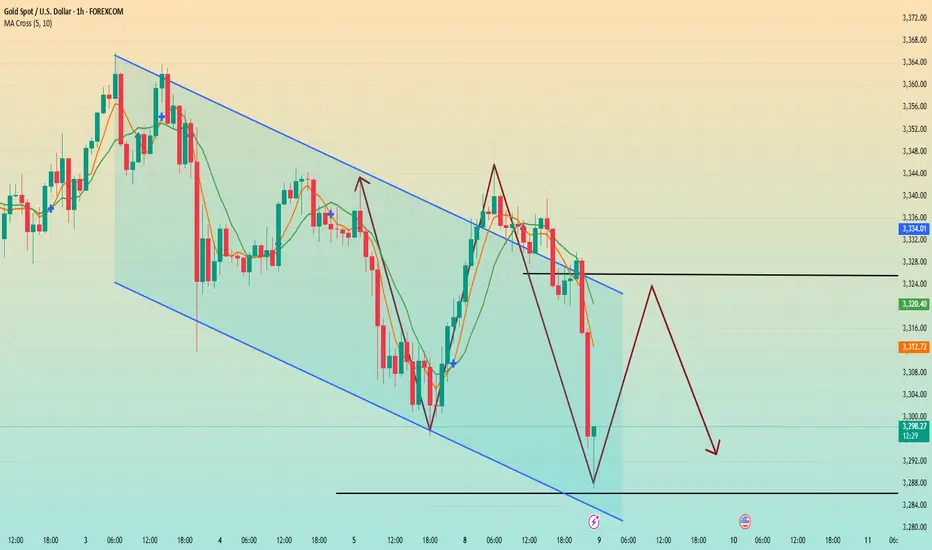
GOLD 4H CHART ROUTE MAP UPDATEHey Everyone,
Please see update on our 4H Chart route map, also playing out perfectly with our levels being respected, as analysed.
We have our bearish target hit at 3295 and currently testing for support and bounce. Ema5 cross and lock below this level will open the swing range and failure to lock will see price reject and head up for the Bullish target. The 1h chart route map from yesterdays update also has the swing range open, which we need to keep in mind when planning to buy dips.
We will keep the above in mind when taking buys from dips. Our updated levels and weighted levels will allow us to track the movement down and then catch bounces up.
We will continue to buy dips using our support levels taking 20 to 40 pips. As stated before each of our level structures give 20 to 40 pip bounces, which is enough for a nice entry and exit. If you back test the levels we shared every week for the past 24 months, you can see how effectively they were used to trade with or against short/mid term swings and trends.
The swing range give bigger bounces then our weighted levels that's the difference between weighted levels and swing ranges.
BULLISH TARGET
3364
EMA5 CROSS AND LOCK ABOVE 3364 WILL OPEN THE FOLLOWING BULLISH TARGETS
3429
EMA5 CROSS AND LOCK ABOVE 3429 WILL OPEN THE FOLLOWING BULLISH TARGET
3499
EMA5 CROSS AND LOCK ABOVE 3429 WILL OPEN THE FOLLOWING BULLISH TARGET
3499
EMA5 CROSS AND LOCK ABOVE 3499 WILL OPEN THE FOLLOWING BULLISH TARGET
3561
BEARISH TARGETS
3295 - DONE
EMA5 CROSS AND LOCK BELOW 3295 WILL OPEN THE SWING RANGE
3242
3171
EMA5 CROSS AND LOCK BELOW 3171 WILL OPEN THE SECONDARY SWING RANGE
3089
3001
As always, we will keep you all updated with regular updates throughout the week and how we manage the active ideas and setups. Thank you all for your likes, comments and follows, we really appreciate it!
Mr Gold
GoldViewFX
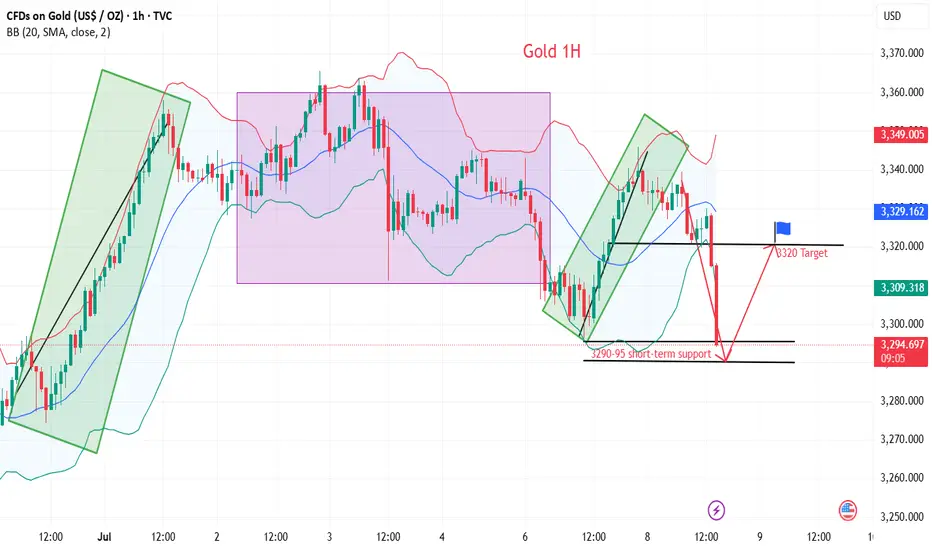
Gold is going down without any signs. Will it continue?Yesterday's seemingly strong rise in gold's safe-haven market may make people mistakenly think that gold is going to rise sharply, but the recent safe-haven market has poor sustainability and poor upward momentum, and cannot maintain the continuation of the upward trend.
Looking at gold in 1 hour, after the price surged, it continued to fall under pressure at 3345. 3345 is also the recent key position for long and short positions. The 1-hour moving average of gold is still in a short position and continues to diverge downward. The short-term short momentum of gold still exists. I think the price will still fall after the rebound. Gold started to fall directly at 3330, and 3330 formed a strong resistance for gold in the short term. The downward low point did not continue after touching 3288. The current price rebounded and fluctuated around 3295. So we can sell high and buy low around 3385-3325.
Gold Setup Expected Move📈 Bullish Scenario (Upside Move)
✅ Conditions:
Price holds above $3,327 support
EMA50 acts as dynamic support
RSI stays above 50
MACD shows bullish crossover
🔼 Targets:
TP1: $3,342 (Resistance 1)
TP2: $3,360 (Resistance 2)
Potential Breakout Zone: Above $3,360 could open path to $3,375+
🔒 Invalidation:
Bullish bias invalid if price breaks below $3,327 and EMA50
📉 Bearish Scenario (Downside Move)
✅ Conditions:
Price breaks below $3,327 support
EMA50 is broken to the downside
RSI drops below 45–40
MACD shows bearish crossover or negative histogram
🔽 Targets:
TP1: $3,308 (Support 2)
TP2: $3,295–$3,285 (next demand zone
🔒 Invalidation:
Bearish bias invalid if price reclaims above $3,335–$3,342 quickly with volume
🧭 Summary Table
Scenario Trigger Target(s) Invalidation
Bullish Holds above $3,327, EMA50 support $3,342 → $3,360+ Break below $3,327
Bearish Breaks below $3,327 + EMA50 fails $3,308 → $3,295 Regain above $3,342

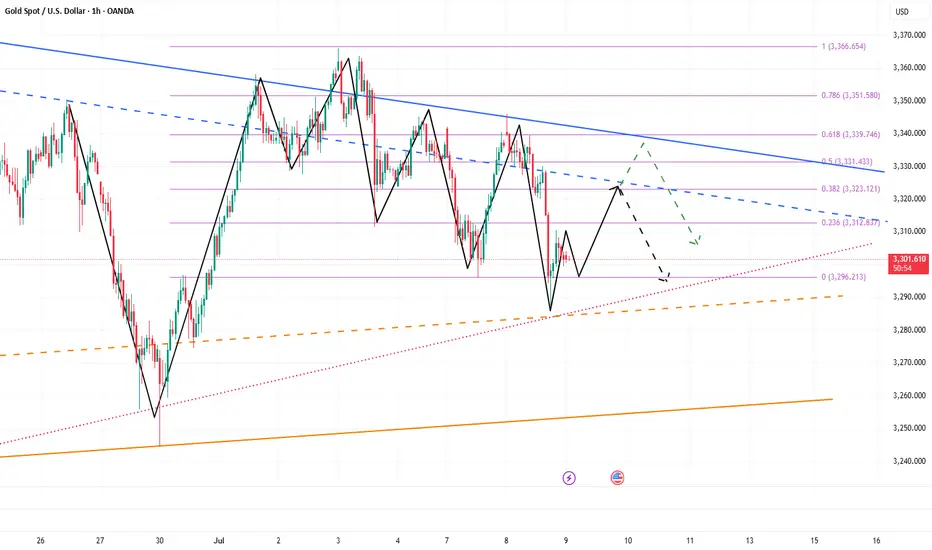
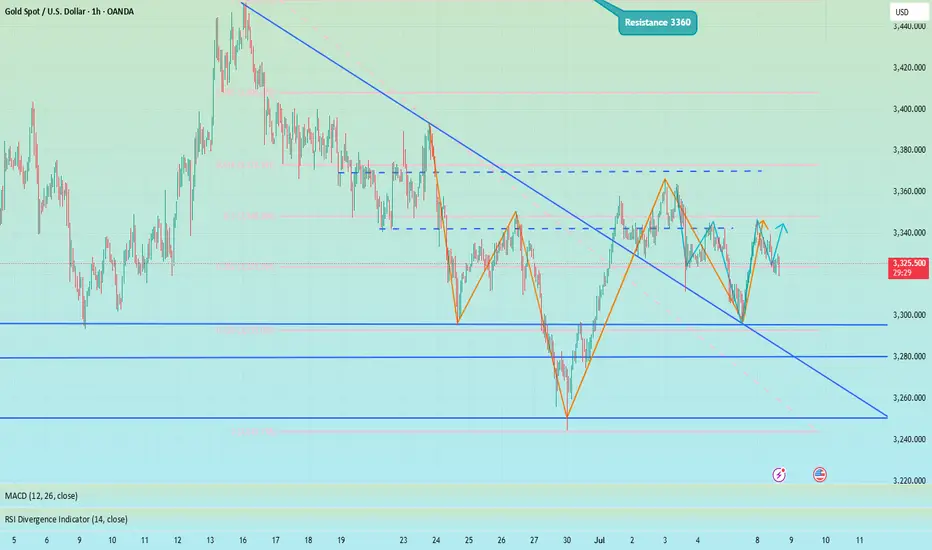
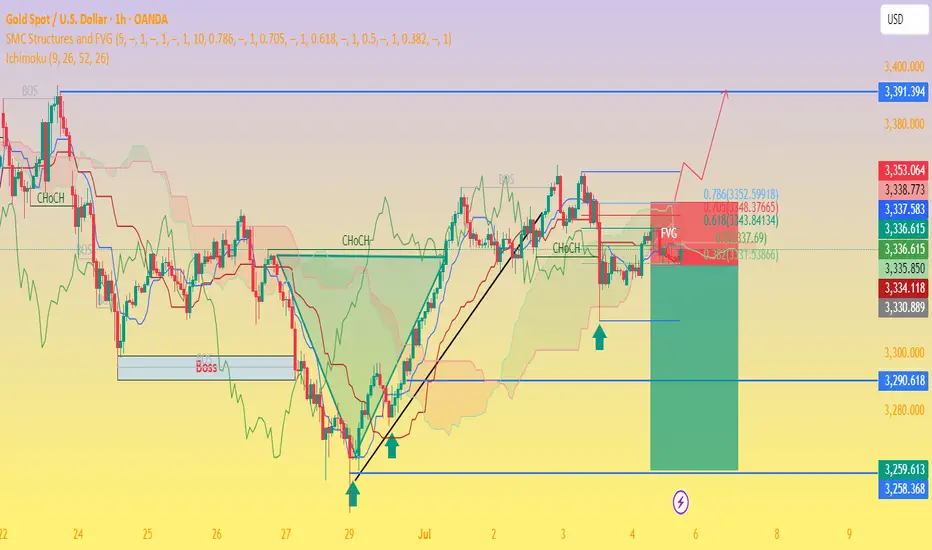
Gold Price Setup: Bullish Continuation or Rejection? 🧠 Chart Analysis (XAU/USD – 1H):
Key Structure Highlights:
CHoCH (Change of Character) zones marked both up and down indicate a battle between bulls and bears.
Recent bullish CHoCH followed by a fair value gap (FVG) retest suggests potential continuation to the upside.
Price recently bounced strongly from demand zone, shown by the green arrows and strong candle reaction.
Ichimoku Cloud:
Price is trying to break back above the Kumo (cloud), a sign of bullish momentum building.
However, resistance is still present with the Kijun and Tenkan lines converging.
FVG (Fair Value Gap):
The current price is attempting to fill and break above the FVG zone.
A successful breakout above this area confirms bullish intention.
Fibonacci Levels:
Price is hovering around the 0.5 - 0.618 retracement zone, often a strong reversal or continuation point.
Upside targets lie near the 0.786 retracement (3352) and ultimate target at 3391, a major resistance level.
Risk Management:
Trade setup shows an excellent Risk:Reward ratio.
Stop-loss placed just below the last structure low.
Potential downside to 3290–3258 if breakout fails.
🟢 Possible Next Move:
Bullish Scenario: If price clears the FVG and breaks above 3353, expect continuation to 3391.
Bearish Rejection: If rejected at FVG/0.618 level, watch for a drop back to 3290 or even 3259.
Gold is bullish and needs more momentum at 3320The buying pressure in the US session pushed the price up and formed a bullish hammer candle on D1. Today's bearish recovery is seen as a buying opportunity to head towards the uptrend again.
3344 is the immediate resistance zone in the European session that Gold faces. Breaking this resistance zone will head towards 3365. According to the wave structure, it would be great to have a retest of 3320 to find some buying momentum and then break 3344.
SUPPORT: 3320-3297
RESISTANCE: 3345-3352-3365
SELL Trigger: Break 3320 ( Trendline & break zone)
Do you have any comments on the trading plan? I would love to hear your views.
