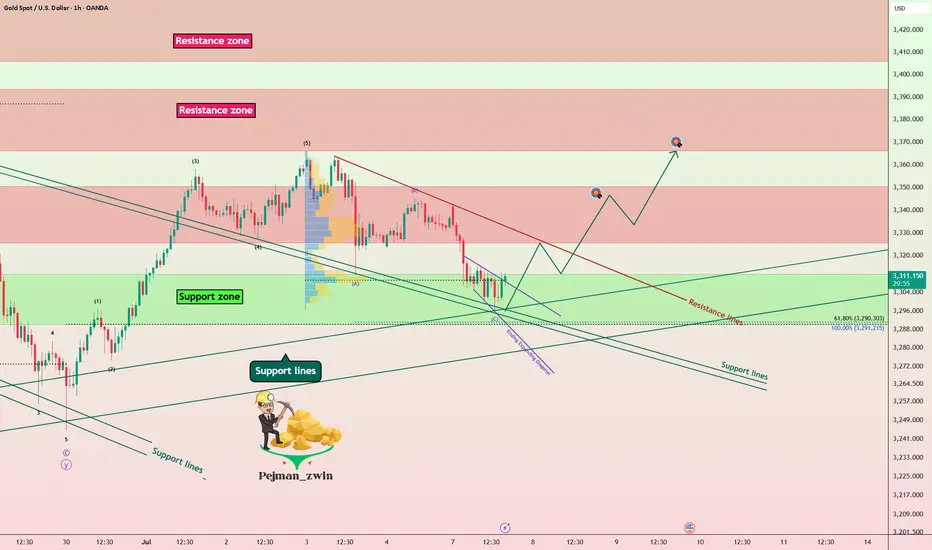
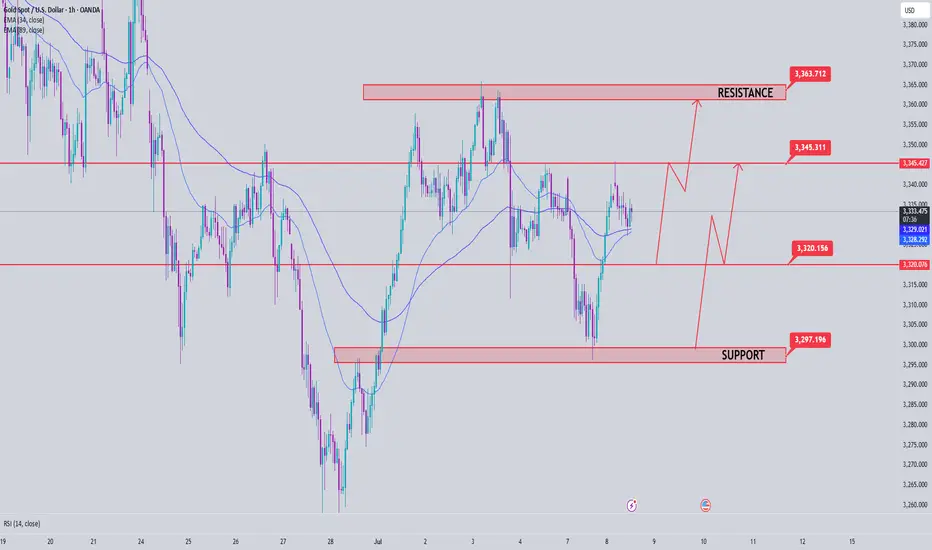
Gold Finds Supports – Is the Rebound About to Begin?Gold ( OANDA:XAUUSD ) declined to the Support zone($3,312-$3,290) and Support lines as I expected in the previous idea .
Gold is currently trading in the Support zone($3,312-$3,290) and near a set of support lines .
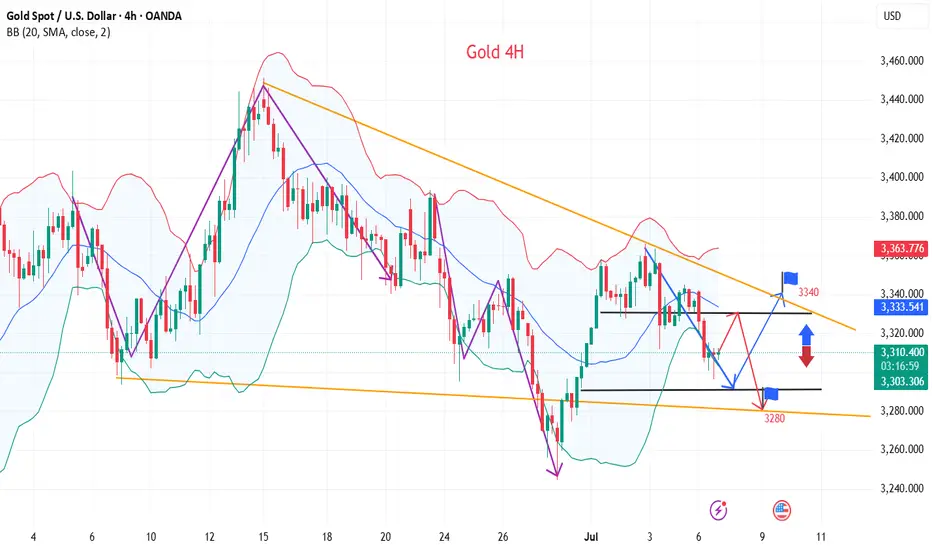
In terms of Elliott Wave theory , it seems that Gold has completed the Zigzag Correction(ABC/5-3-5 ) and we should wait for the next 5 impulse waves . One of the confirmation signs of the end of these corrective waves could be the break of the resistance line .
I expect Gold to trend higher in the coming hours and rise to at least $3,343 AFTER breaking the Resistance line .
Second Target: $3,364
Note: Stop Loss (SL) = $3,287
Gold Analyze (XAUUSD), 1-hour time frame.
Be sure to follow the updated ideas.
Do not forget to put a Stop loss for your positions (For every position you want to open).
Please follow your strategy; this is just my idea, and I will gladly see your ideas in this post.
Please do not forget the ✅ ' like ' ✅ button 🙏😊 & Share it with your friends; thanks, and Trade safe.
Goldprediction
Gold's rise is consistent with my analysis
Today's market analysis and interpretation:
First, the weekly gold level: Last week, it closed with a positive K, and the closing price just returned to the lower track of the upward channel, and the 10-day moving average stood on it again; this does not rule out that the negative line break last week was an illusion; this week, the corresponding channel lower track resistance is just last week's high of 3365. Once it stands on the channel again, it is expected to gradually strengthen in the medium term
Second, the daily gold level: Yesterday, it closed with a long lower shadow cross K, so 3296 has a stabilization signal, and the wave of shocks after closing negative last week may end here; today, after filling the shadow line, it has to continue to try to be bullish, and when it breaks through and stands on the middle track, it can try to test 3400-3430
Third, the hourly gold level: Yesterday, the opening jumped and pulled up sharply, and then fell back immediately, falling from 3342 to 3296 under pressure, and the US market directly rose from 3296 to 3340; Today is exactly the same, with a gap up and a sharp pull, and it immediately fell back after touching the 3346 line. The Asian and European sessions fluctuated and stepped back to 3320; due to the loss of the middle track, there may be further room for decline before it breaks through again. The resistance is the middle track of 3330 and the upper track of the yellow channel at 3337. The support is 618 split support 3315, and further down is 3307 and 786 split support. If the support is stabilized, it will continue to be bullish. The short-term double top is 3345-46. If it breaks through and stands above, it can hit around 3365, or even 3400 and above.
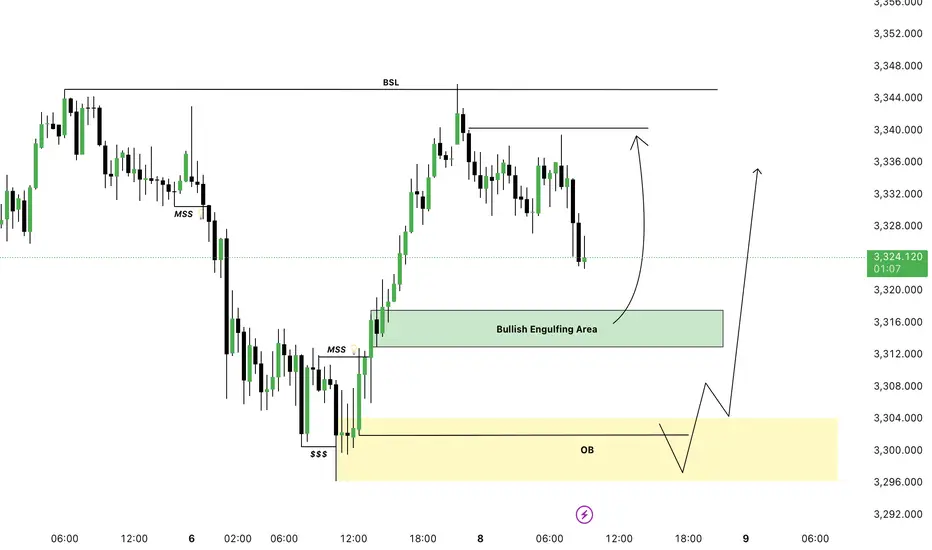
GOLD BUY ZONES Gold Buy Zone We Have
Bullish Engulfing Area ( 3317 - 3311 )
Order Block Area ( 3304 - 3295 )
Target We Are Expect Previous High Lets Gooo
XAUUSD Outlook: How Risk Sentiment Could Shape the Next MoveI’m currently analysing XAUUSD (Gold) 🟡, which has come under bearish pressure 📉, showing signs of downside momentum. In the video 🎥, we also explore the inverse correlation between Gold and risk assets like the NASDAQ 📊.
Keep a close eye on NASDAQ movements—if risk assets break bullish 🚀, we may see further weakness in Gold. On the other hand, if risk sentiment shifts and risk assets break bearish 🛑, Gold could attract safe-haven demand and gain strength 💪.
We also dive into the price action, market structure, and pull up the volume profile 🧩. Gold is currently trading around the Point of Control (POC) ⚖️—a key level where significant volume has accumulated. A clean break above or below this area could act as a technical trigger for the next move 📈📉.
As always, this is not financial advice ⚠️—just my market view.

XAUUSD Analysis todayHello traders, this is a complete multiple timeframe analysis of this pair. We see could find significant trading opportunities as per analysis upon price action confirmation we may take this trade. Smash the like button if you find value in this analysis and drop a comment if you have any questions or let me know which pair to cover in my next analysis.

Gold price analysis July 8In the previous US session, strong buying pressure pushed gold prices up and formed a bullish hammer candlestick pattern on the D1 chart - a potential sign for an uptrend recovery.
🔄 Today's scenario: The correction in the early session is considered a good opportunity to buy, expecting the price to continue the uptrend.
📍 Nearest resistance zone:
The price is currently facing the resistance zone of 3344 in the European session. If gold breaks 3344, the next target will be 3365 - the gap zone that has not been filled.
However, according to the wave structure, it would be more optimal if the price has a retest to the 3320 zone, accumulates more buying momentum and then breaks out strongly through 3344.
📉 Bearish scenario:
If 3320 is broken, especially with a trendline and support zone breakout signal, a sell strategy can be activated with a lower target.
🔸 Support: 3320 – 3297
🔸 Resistance: 3345 – 3352 – 3365
🔸 Sell is triggered if: Price breaks 3320, confirms breaking trendline & support zone.
💬 Do you have any comments on this trading plan? Leave a comment!
Gold fluctuates. Beware of highs.On Monday, the U.S. dollar index rose sharply, reaching an intraday high of 97.65 as Trump announced that he would impose new tariffs on a series of countries including Japan and South Korea on August 1.
Spot gold fell first and then rose. It once fell below the $3,300 mark during the session, but then rebounded strongly in a V-shaped manner by nearly $40. As of now, it has stabilized above 3,330.
From the current daily line:
3,320 is the absolute support position for gold at present. Although it fell below 3,320 yesterday, Monday, it then reversed and stabilized above 3,320. For now, the daily line still cannot close below 3,320. If it closes below 3,320, the decline may open further. On the contrary, the current upper suppression position of gold is around 3,350. That is to say, it is basically maintained at 3,320-50 for rectification.
If the daily line stabilizes at 3350 again, the bulls may rise again.
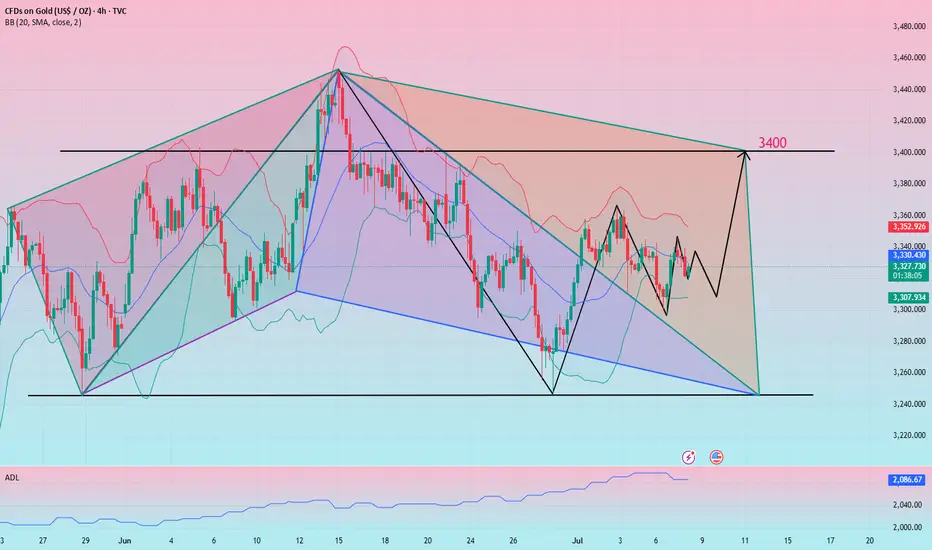
From the 4-hour chart, gold currently shows signs of a head and shoulders bottom. If the 4-hour chart stabilizes above 3340 again, the suppression level of 3350 may be directly broken. Next, it may directly touch the high level of 3380-90. Therefore, in terms of operation, I suggest that you can maintain long positions at 3320-30.
The first target is 3340-50. As long as the 4-hour chart stabilizes above 3340, you can continue to look at 3380-90.
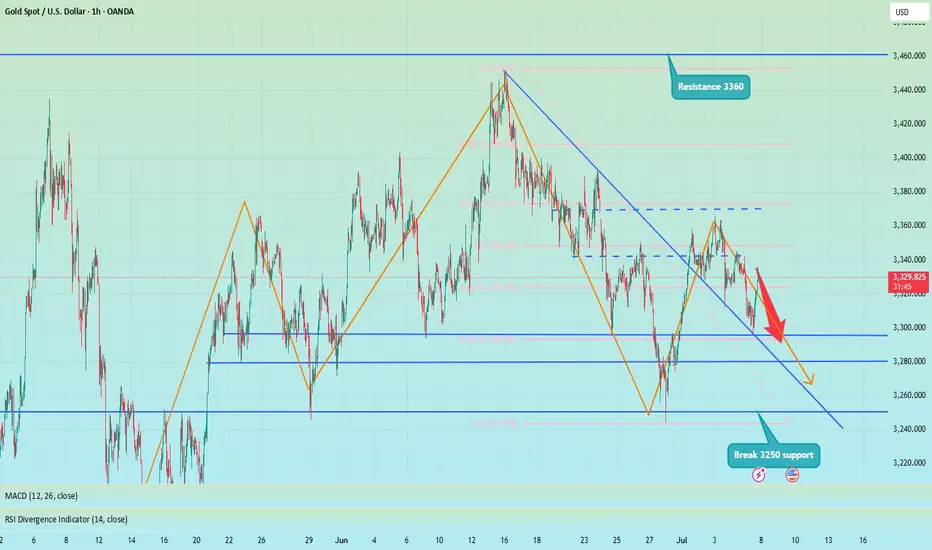
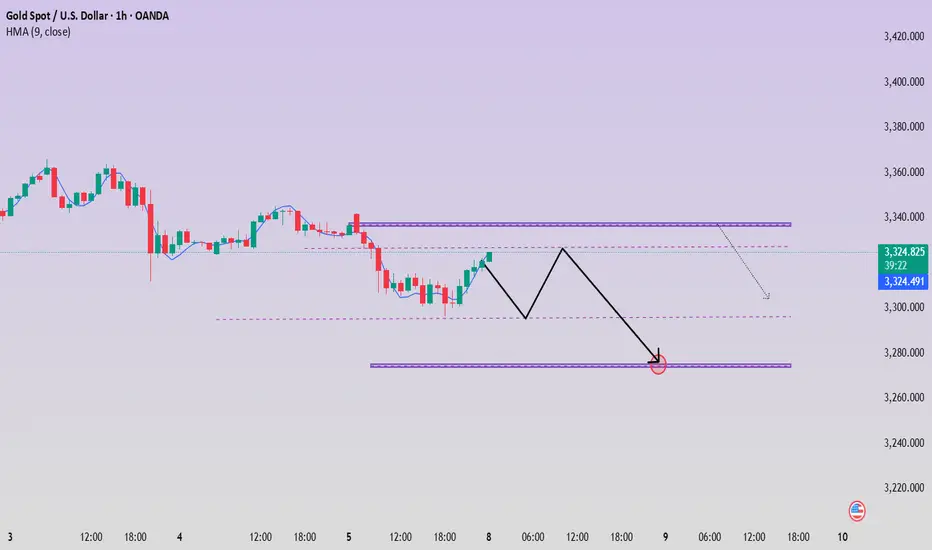
Trend Continuation After NonfarmToday's D1 candle started to continue the trend of NF with a decrease to 3306 in the Asian session this morning.
The bearish structure of Gold Price will continue in today's trading session towards important support zones.
The downtrend of Gold was only broken with a candle closing back above 3324. And the downtrend may reach support 3275 today.
Support 3297-3275
Resistance 3324-3343-3364
SELL Trigger: Break support 3296
XAUUSD - Liquidity Sweep & Smart Money Play | Dual Setup BreakdoFOREXCOM:XAUUSD
Liquidity Sweeps
Smart Money Concepts (SMC)
Trendline Liquidity
Demand/Order Blocks
Risk-Reward Structure
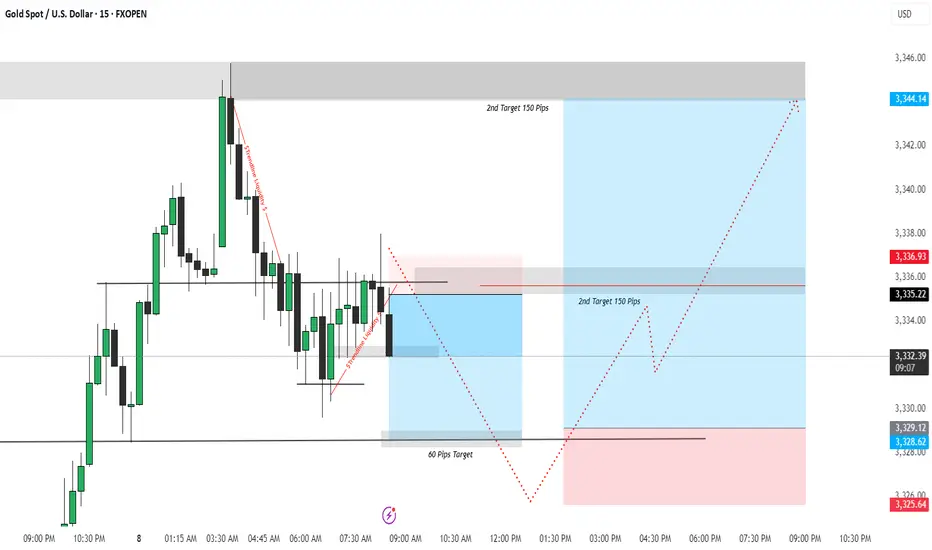
🔻 First Trade Idea – Short Position (Sell Setup)
🧠 Psychology & Liquidity Insight:
The market formed equal lows before a sudden rally which attracted retail traders.
Price created a bearish structure with lower highs, signaling weakness.
A strong liquidity sweep occurred by breaking trendline liquidity twice (as shown by red lines), targeting early buyers' stop losses.
A supply zone (red box) was respected near 3337, providing an ideal entry point for shorting.
📉 Trade Logic:
Entry: Near 3336.93 (Supply Zone)
SL: Above 3344.14 (Liquidity Sweep zone)
TP: 3328.62 / 3325.64 (Targeting demand imbalance & internal liquidity)
R:R: Approx. 1:2+
🔺 Second Trade Idea – Long Position (Buy Setup)
🧠 Psychology & Liquidity Insight:
After the initial selloff, price taps into the demand zone (blue box) created by the last impulsive move.
Internal liquidity is built again near 3328–3330, where retail traders expect a continued fall — ideal for smart money to reverse.
Price is expected to accumulate and reverse with a strong rally toward the upper liquidity resting above 3344.
📈 Trade Logic:
Entry: Near 3328.62 (Demand Zone Tap)
SL: Below 3325.64
TP: 3344.14 (Major Liquidity Target)
R:R: Over 1:3 – a high-quality reversal play.
🎯 Why This Trade Setup is Powerful:
✅ Both trades are liquidity-driven, not just indicator-based.
✅ Incorporates smart money logic and price structure.
✅ Clear risk-to-reward, validated by price behavior and institutional order flow.
Shorts trapped? No, the head and shoulders top is still downOver the weekend, I gave a trading strategy for going long at 3315-3305. Today, I updated and optimized the long order trading, maintained the high-short-low-long trading strategy, and began to rebound near the 3300 line, and successfully touched the long TP 3333. At present, I am executing short trades again according to the trading strategy and holding short orders.
Although gold has only retreated to around 3330, I am not worried about losses and failures in short trades. As I wrote in today's post, the daily K-line chart has a head and shoulders top pattern. As long as the bulls fail to recover 3360, it is still a short trend. Therefore, in the short term, I still think that the rebound is a good opportunity for us to go short.
At present, the short-term bullish momentum of gold has been consumed and the downward trend continues. Therefore, I still insist on holding short orders in the short term.
In addition to investment, life also includes poetry, distant places, and Allen. Facing the market is actually facing yourself, correcting your shortcomings, facing your mistakes, and being strict with yourself. I share free trading strategies and analysis ideas every day for reference by brothers. I hope my analysis can help you.
FXOPEN:XAUUSD PEPPERSTONE:XAUUSD FOREXCOM:XAUUSD FX:XAUUSD FXOPEN:XAUUSD OANDA:XAUUSD TVC:GOLD
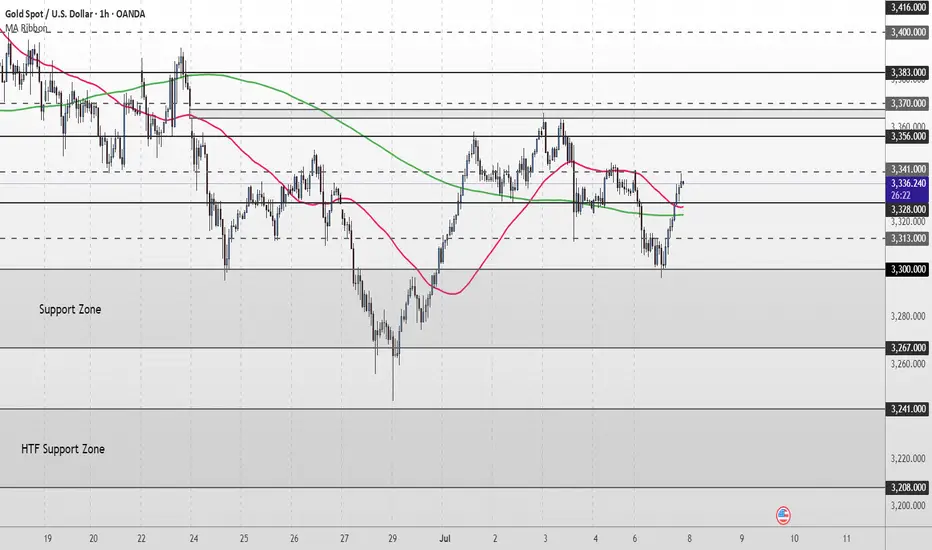
Gold Short Term OutlookGold dipped earlier in the session as the $3,328 support level failed, pushing price into the upper boundary of the broader Support Zone. From there, we’ve seen a strong bounce, with price now trending around the $3,341 minor resistance.
Price has reclaimed both the 50MA and 200MA, suggesting bullish momentum may be returning. A clean break and hold above $3,356 would likely open the path toward higher resistance levels, including $3,370 and $3,383.
However, failure to break and hold above $3,356 could lead to another pullback toward the Support Zone. If that zone fails to hold, we may see a deeper move into the higher timeframe (HTF) support area below $3,300.
📌 Key Levels to watch:
Resistance:
$3,356 ‣ $3,383 ‣ $3,400 ‣ $3,416
Support:
$3,328 ‣ $3,300 ‣ $3,267 ‣ $3,241 ‣ $3,208 (HTF Support)
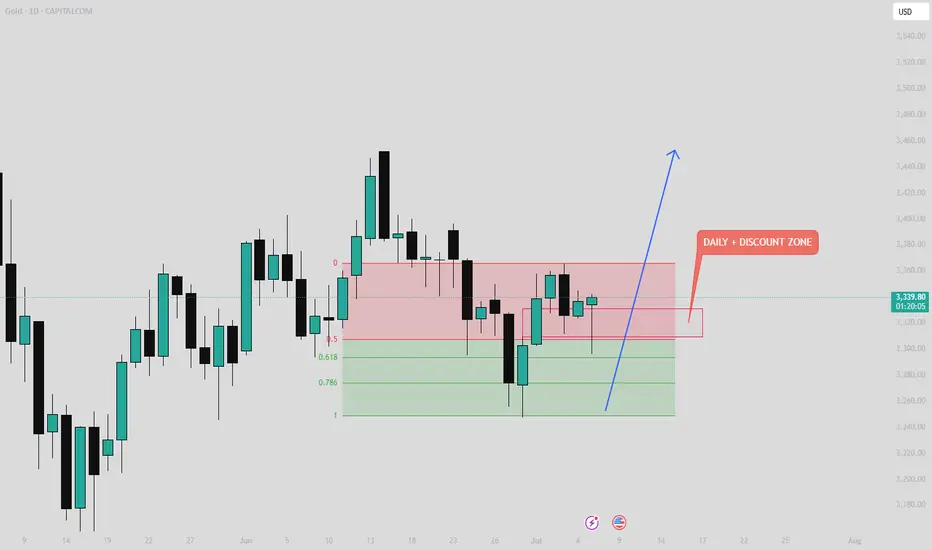
GOLD Analysis – Weekly Outlook GOLD Analysis – Weekly Outlook 🟡📈
Price has just tapped into our Daily PD Array, precisely the Fair Value Gap (FVG), which was clearly marked. It also entered the discount zone, aligning with our bullish bias.
Additionally, we’ve seen a liquidity sweep, followed by a strong bullish reaction — a classic sign of smart money accumulation.
📍 Key Targets:
First Target 🎯: 3396
Second Target 🎯: 3451
As long as price holds above this zone, we expect the bullish move to continue. Let’s see how it unfolds over the coming sessions.
🔔 Follow for more weekly insights.
📊 See you next time!
#Gold #XAUUSD #TradingView #SmartMoneyConcepts #FVG #LiquiditySweep #PriceAction #MarketAnalysis
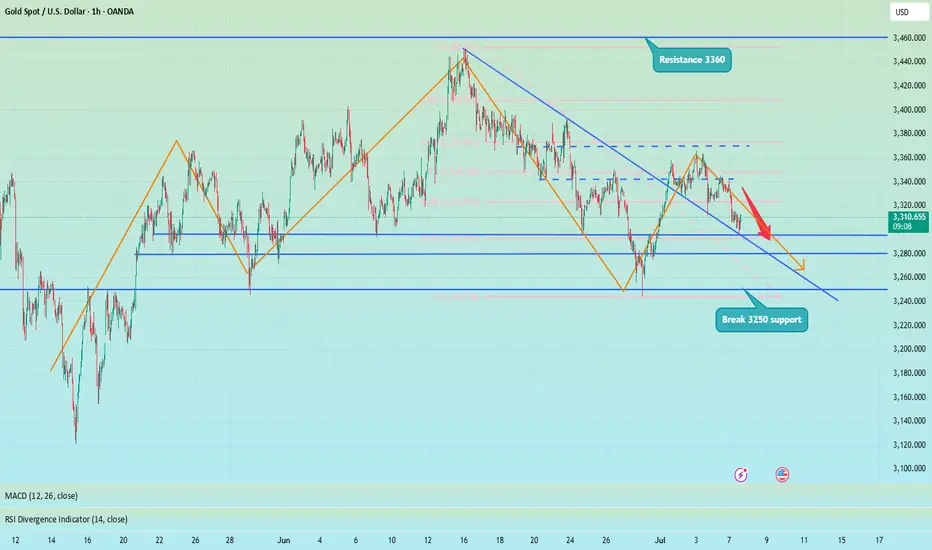
90-day tariffs expire, how to position gold next week📰 News information:
1. 90-day tariffs are about to expire
📈 Technical Analysis:
With the Trump administration's massive tax cut and spending bill officially implemented, the U.S. Treasury may start a "supply flood" of short-term Treasury bonds to make up for the trillions of dollars in fiscal deficits in the future. Concerns about the oversupply of short-term Treasury bonds have been directly reflected in prices. The yield of 1-month short-term Treasury bonds has risen significantly since Monday this week. Slowing wage growth, falling total work hours, stagnant wage income growth and concerns about consumer spending are all signs that support gold.
From a technical perspective, Friday's closing long shadow small candle body, the price closed at a high of 3345 and a low of 3224. The overall idea for next week is to follow the trend and rely on the first short-term support of 3323 below to participate in long positions. Secondly, 3315-3305 is given below. If the support point is lost, then 3300 below is also in danger, and there is no need to overly insist on continuing to do more at low levels in the short-term rhythm. The key pressure above is 3340-3350, and the limit is the pressure of 3360 above.
🎯 Trading Points:
BUY 3325-3323
TP 3333-3340-3350
BUY 3315-3305
TP 3325-3333-3340
In addition to investment, life also includes poetry, distant places, and Allen. Facing the market is actually facing yourself, correcting your shortcomings, confronting your mistakes, and strictly disciplining yourself. I hope my analysis can help you🌐.
FXOPEN:XAUUSD PEPPERSTONE:XAUUSD FOREXCOM:XAUUSD FX:XAUUSD OANDA:XAUUSD TVC:GOLD
GOLD TODAYHello friends🙌
🔊Due to the weakness of buyers and the strength of sellers, the price continues to fall...
We have identified two supports for you that will not be seen if the price continues to fall, and if the selling pressure increases, we will update you.
🔥Join us for more signals🔥
*Trade safely with us*
Gold: update hello friends✋️
According to the recent growth of gold, you can see that it is constantly resisting and forming a falling pattern.
For this reason, it can be a warning that the fall can continue and the price will fall to the specified limits.
🔥Follow us for more signals🔥
*Trade safely with us*
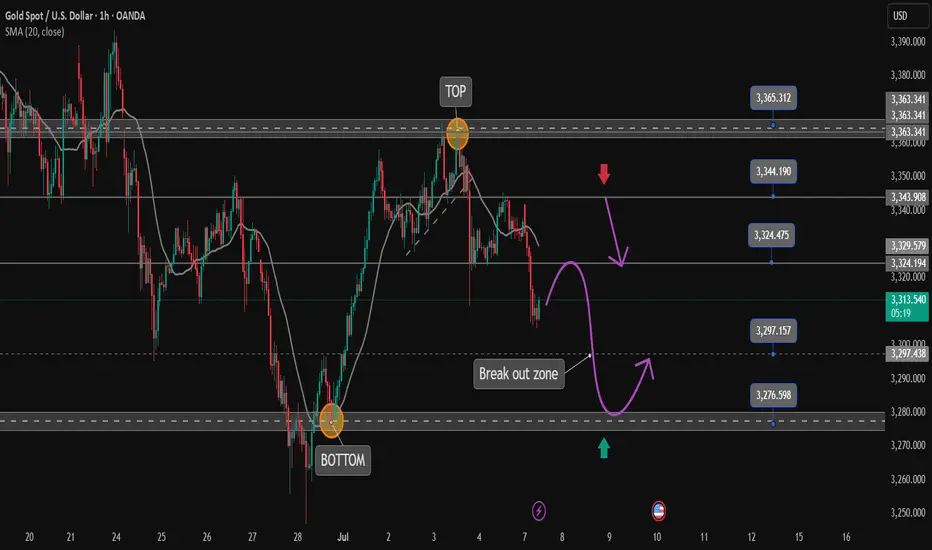
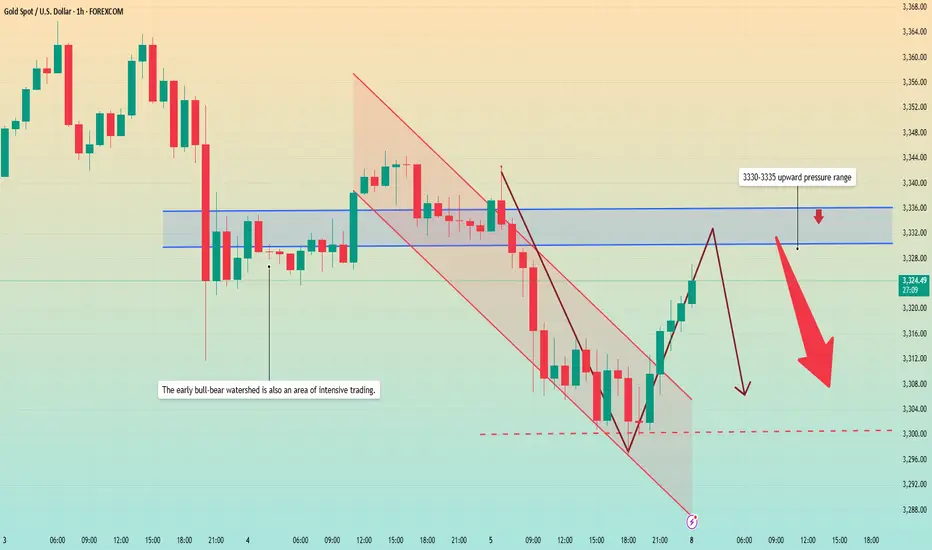
Gold rebounded from the bottom. Is the decline over?Gold prices faced selling pressure in today's Asian market. The price fell from 3343 to around 3320 in the early Asian session. The European price continued to fall, reaching a low of around 3296, and then rebounded upward. The current price is fluctuating around 3320.
Most investors will focus on the minutes of the Federal Open Market Committee (FOMC) meeting to be released on Wednesday to get guidance on the trend.
From the hourly chart, the upper pressure position is constantly being corrected. The current average pressure value is around 3330-3335. At the same time, this position is also the watershed between long and short positions in the previous dense area. The price may rebound to this position again. The lower support level is in the range of 3300-3290.
Quaid believes that the current market is still showing a downward trend, and the price may fall back below 3300 again.
Operation strategy:
Short around 3330, stop loss 3340, profit range 3310-3300, sustainable ownership after breakthrough.
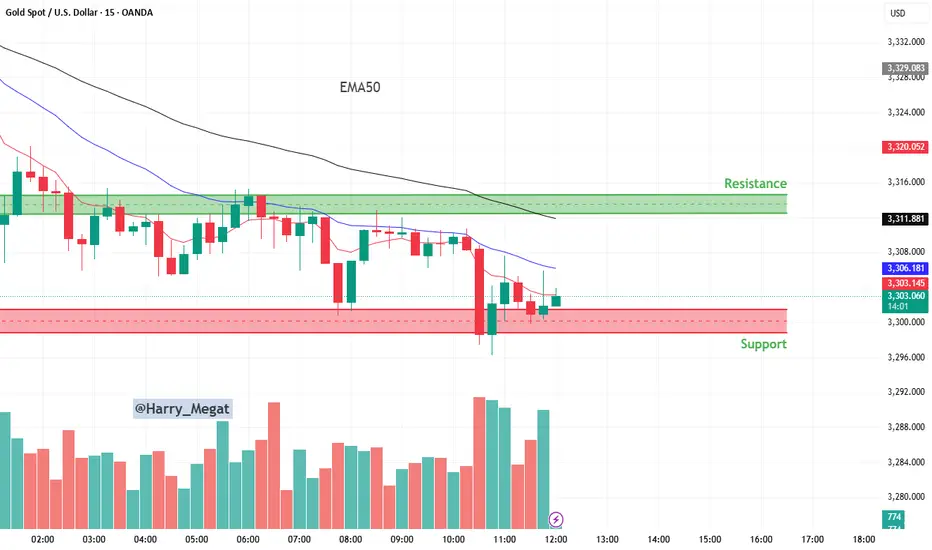
15-minute candlestick chart for Gold Spot (XAU/USD)15-minute candlestick chart for Gold Spot (XAU/USD)
📉 **1. Trend Overview:**
* The overall direction is **bearish (downtrend)** — this is confirmed by:
* **Price below the 50 EMA** (black line)
* **Lower highs and lower lows**
* Continuous rejection from resistance
---
### 🟩 **2. Resistance Zone (\~3,312 to 3,320):**
* This is the area where price has **previously failed to break above** multiple times.
* Sellers dominate this level — price tends to drop when approaching here.
* A **bullish breakout above 3,320** may signal trend reversal.
---
### 🟥 **3. Support Zone (\~3,296 to 3,303):**
* This area has seen **strong buying** (look at the lower wicks and reversal candles).
* Price has bounced multiple times from this zone — it's acting as a **floor**.
* If price breaks **below this support**, further downside is likely.
---
### 📊 **4. Indicators:**
* **EMA 50 (black line)**: Shows the medium-term trend — it's sloping down, confirming bearish bias.
* **Shorter EMAs (red and blue)** are also above price, indicating pressure from sellers.
---
### 💡 **5. Price Action & Volume Insight:**
* A recent **rejection wick** at support suggests buyers are still active here.
* However, volume is increasing during the latest drop — **bearish momentum** is building.
* Watch how price behaves around 3,302–3,303 — consolidation here could lead to a breakout or breakdown soon.
---
### 🧠 **Trade Setups:**
#### **A. Bearish Scenario (Breakdown Trade):**
* 🔻 *Sell below 3,296 (support break)*
* 🎯 Target: 3,288 or lower
* 🛑 Stop Loss: Above 3,304
#### **B. Bullish Scenario (Bounce Trade):**
* 🔼 *Buy near 3,296–3,303 (support bounce)*
* 🎯 Target: 3,312–3,320 (resistance)
* 🛑 Stop Loss: Below 3,295
---
### ✅ **Summary:**
* Market is **bearish**, but currently **testing strong support**.
* Watch closely for a breakout below support or a pullback to resistance.
* Best strategy: **Sell the breakdown or sell the pullback to resistance.**
Bearish pressure below 3,300 at the start of the week
📌 Driving Events
Gold prices (XAU/USD) faced renewed selling pressure in early Asian trading on Monday, falling to the $3,320 level. Gold's pullback came as stronger-than-expected U.S. nonfarm payrolls data for June reshaped market expectations for the Federal Reserve's (Fed) policy path. Investors are now turning their attention to the Federal Open Market Committee minutes, which will be released on Wednesday, for further guidance.
The U.S. added 147,000 jobs in June, better than expected and slightly higher than the revised 144,000 in May. Meanwhile, the unemployment rate remained stable at 4.1%. These data reinforce the view that the labor market remains resilient, reducing the likelihood of an imminent rate cut by the Federal Reserve. As a result, the U.S. dollar strengthened, weighing on non-yielding assets such as gold.
📊Comment Analysis
The decline at the beginning of the week, gold prices give up accumulation below 3300
💰Strategy Package
⭐️Set gold price:
🔥Sell gold area: 3337-3339 SL 3344
TP1: $3328
TP2: $3312
TP3: $3300
🔥Buy gold area: $3297-$3295 SL $3290
TP1: $3308
TP2: $3320
TP3: $3330
⭐️ Note: Labaron hopes that traders can properly manage their funds
- Choose the number of lots that matches your funds
- Profit is 4-7% of the fund account
- Stop loss is 1-3% of the fund account
Gold fluctuates, beware of rebound caused by new tariffs📊 Gold Day Trading Strategy (Recommendation index ⭐️⭐️⭐️⭐️⭐️)
📰 News information:
1. 90-day tariffs are about to expire
2. New unilateral tariffs
3. Geopolitical situation
📈 Technical Analysis:
As I said this morning, shorting gold is divided into two times, the first time is near 3324, and the second time is at 3340 or 3345. If there is a short-term retracement after breaking through 24, you can follow up with a long order to look at 3335-3340. If gold is in a very weak state, you can consider shorting near 3315 and look at 3300. Because during the European session, 3300 has strong support, and the European session repeatedly tests this support. If it falls below 3300, we will go to 3295-3285, or even 3250. But at the same time, we need to pay attention to the rebound of gold that may be caused by tariff policies and geopolitical situations.
🎯 Trading Points:
SELL 3315-3325-3335
TP 3305-3295-3285
BUY 3290-3285
TP 3300-3310-3320
In addition to investment, life also includes poetry, distant places, and Allen. Facing the market is actually facing yourself, correcting your shortcomings, facing your mistakes, and being strict with yourself. I share free trading strategies and analysis ideas every day for reference by brothers. I hope my analysis can help you.
TVC:GOLD OANDA:XAUUSD FX:XAUUSD FOREXCOM:XAUUSD PEPPERSTONE:XAUUSD FXOPEN:XAUUSD
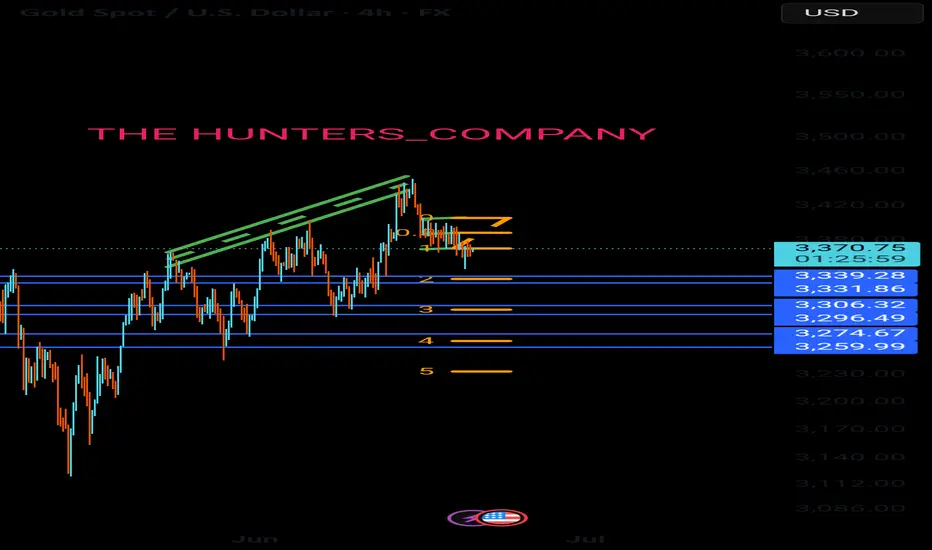
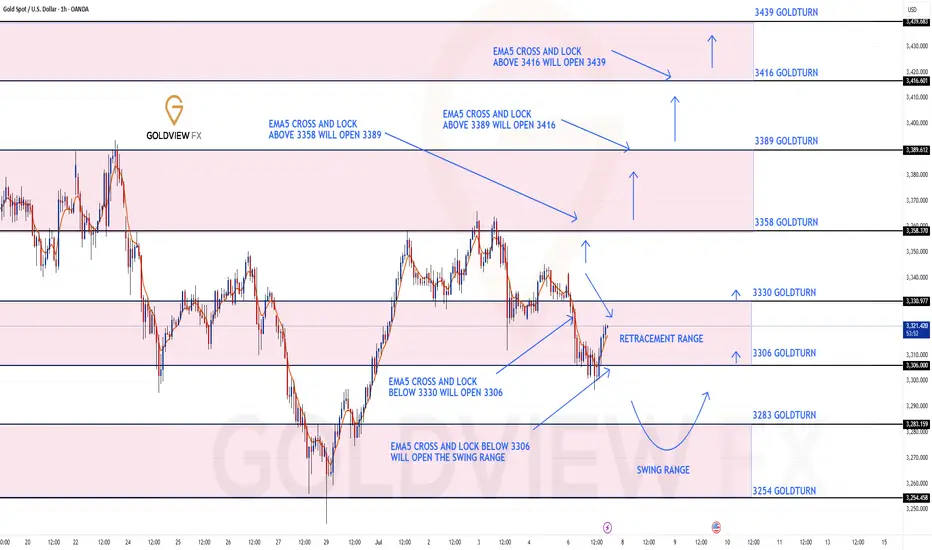
GOLD ROUTE MAP UPDATEHey Everyone,
Great start to the week with our levels being respected inline with our plans to buy dips.
We started the week with our bearish target 3330 being hit followed with ema5 cross and lock opening 3306 inline with the retracement range. This was hit perfectly completing the retracement range, followed with the weighted level bounce now heading towards 3330.
We still have the market opening bullish gap left at 3358 and will need a challenge and ema5 lock above 3330 to re-confirm this again.
We will keep the above in mind when taking buys from dips. Our updated levels and weighted levels will allow us to track the movement down and then catch bounces up.
We will continue to buy dips using our support levels taking 20 to 40 pips. As stated before each of our level structures give 20 to 40 pip bounces, which is enough for a nice entry and exit. If you back test the levels we shared every week for the past 24 months, you can see how effectively they were used to trade with or against short/mid term swings and trends.
The swing range give bigger bounces then our weighted levels that's the difference between weighted levels and swing ranges.
BULLISH TARGET
3358
EMA5 CROSS AND LOCK ABOVE 3358 WILL OPEN THE FOLLOWING BULLISH TARGETS
3389
EMA5 CROSS AND LOCK ABOVE 3389 WILL OPEN THE FOLLOWING BULLISH TARGET
3416
EMA5 CROSS AND LOCK ABOVE 3416 WILL OPEN THE FOLLOWING BULLISH TARGET
3439
BEARISH TARGETS
3330 - DONE
EMA5 CROSS AND LOCK BELOW 3330 WILL OPEN THE FOLLOWING BEARISH TARGET
3306 - DONE
EMA5 CROSS AND LOCK BELOW 3306 WILL OPEN THE SWING RANGE
3283
3254
As always, we will keep you all updated with regular updates throughout the week and how we manage the active ideas and setups. Thank you all for your likes, comments and follows, we really appreciate it!
Mr Gold
GoldViewFX
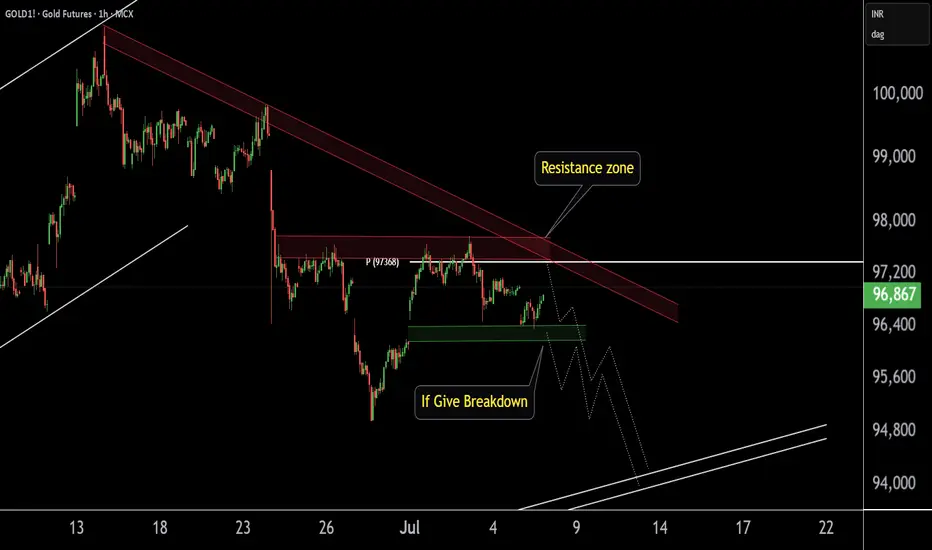
GOLD1! Best Key Level !!This is the 1 hour Chart of Gold!.
Gold is forming a bearish structure and is consistently respecting the resistance zone, leading to a downward move. The key resistance area is between 97,800 and 97,400..
Gold is finding support in the 96,250 – 96,330 zone on the short time frame.
A breakdown below this level may trigger aggressive selling pressure.
Thank you !!
Gold short-term shock operation ideas
💡Message Strategy
Current Price and Context
Gold is trading around $3,310 and continues to retreat as traders remain cautious amid heightened macroeconomic uncertainty. While some safe-haven demand remains, a stronger dollar and weakening confidence among safe-haven buyers put gold under selling pressure. Concerns about global trade policy and tightening monetary policy continue to weigh on gold's short-term outlook.
Key Drivers
Geopolitical Risks: Trade tensions and global uncertainty have again sparked cautious sentiment, which has provided limited support for gold, but the absence of major conflicts has left it lacking direction.
U.S. Economic Data: Strong labor market data and upcoming inflation data supported the dollar, curbing gold's upward momentum.
FOMC Outcomes: The Fed remains cautious and does not signal an immediate rate cut; high yields reduce the appeal of non-interest-bearing assets such as gold.
Trade Policy: While tariffs have been a concern, flows between risk and safe-haven assets have been mixed as there has been no new escalation.
Monetary policy: Rising global bond yields and the Federal Reserve's wait-and-see attitude limit gold's gains in the short term.
📊Technical aspects
From the 4-hour analysis, the support line of 3290-3300 is concerned below, the short-term resistance above is concerned about 3315, and the suppression line of 3345-50 is focused on. The overall main tone of high-altitude low-multiple cycle participation remains unchanged. In the middle position, watch more and do less, and follow orders cautiously, and maintain the main tone of participation in the trend. Wait patiently for key points to participate. Pay attention to the specific operation strategy in time.
💰Strategy Package
Long Position:3290-3300,SL:3275,Target: 3330-3340
Short Position:3320-3330,SL:3305,Target: 3280-3290
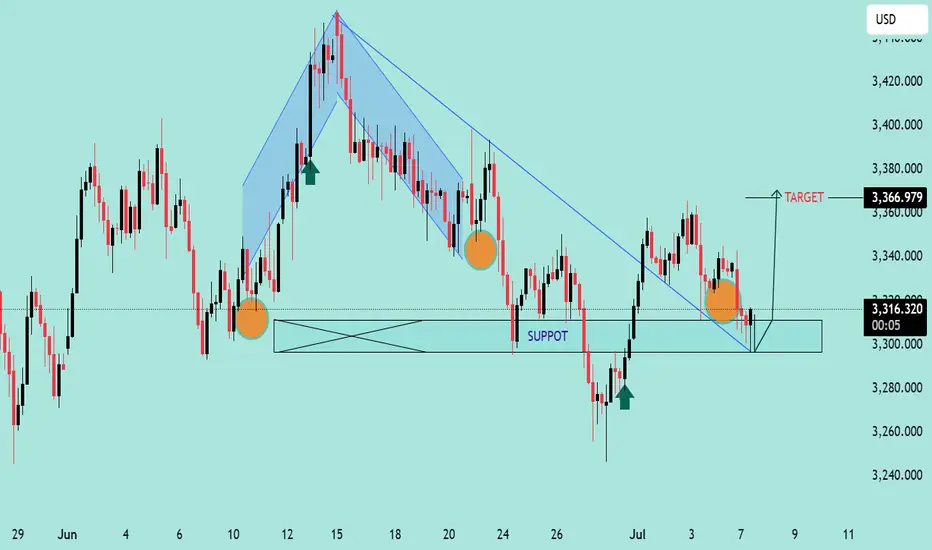
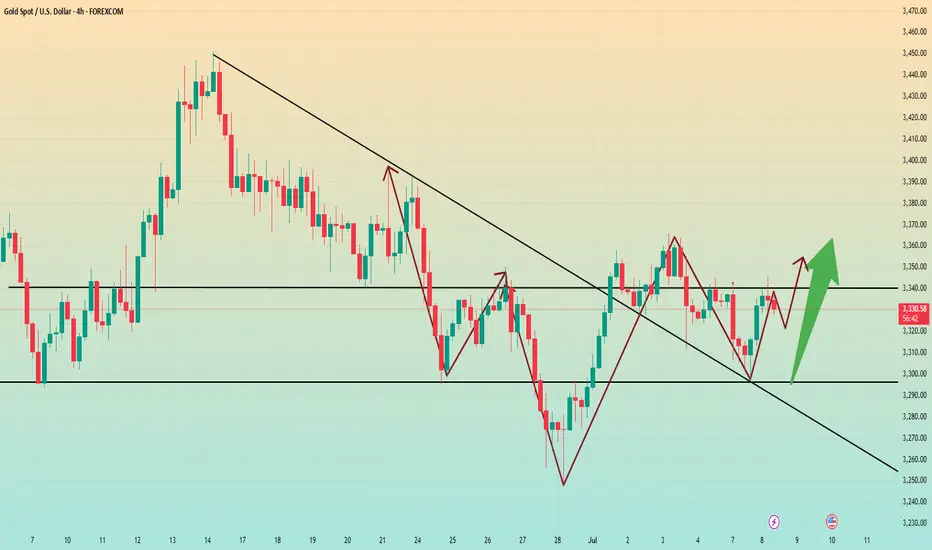
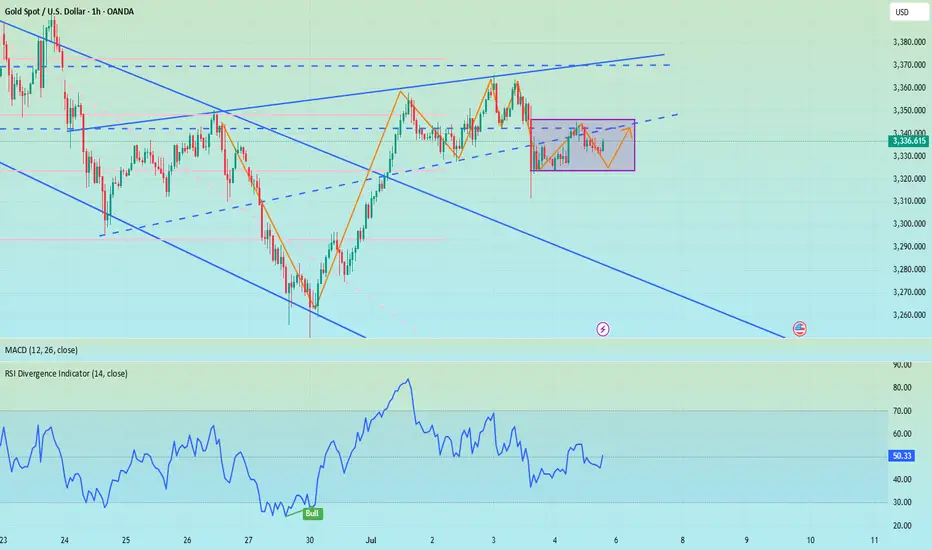
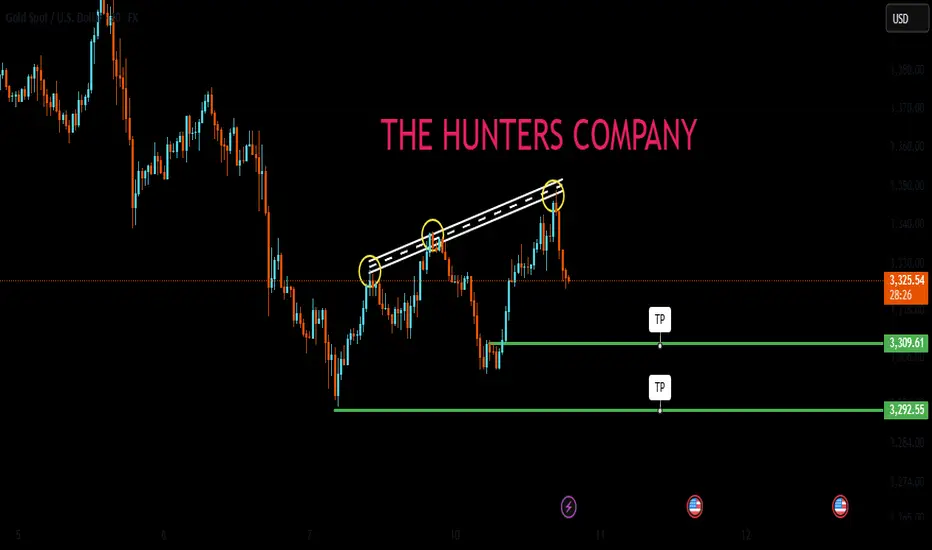
Gold/USD Bullish Reversal from Support Zone Gold/USD Bullish Reversal from Support Zone 🟢📈
Technical Analysis:
Support Zone: Price is consistently respecting the horizontal support range near 3,305 – 3,310, confirming it as a strong demand zone (marked by multiple orange circles and previous bounce reactions).
Bullish Structure: After breaking the descending trendline, the price has retested the trendline and horizontal support zone, forming a higher low — a classic bullish reversal signal.
Target Projection: The measured move projection targets a potential upside near 3,366.979, aligned with previous highs.
Bullish Candlestick Patterns: Green arrows highlight bullish price action at significant reversal points, confirming buyer strength at support.
Harmonic Pattern: The shaded harmonic pattern suggests completion near the previous lows, which aligns with the reversal zone.
Conclusion:
As long as the price holds above the support area and respects the trendline retest, bulls may push toward the projected target. A break below the zone would invalidate this bullish setup.