Waiting for data release to rebound and short📰 Impact of news:
1. PCE and Consumer Index
📈 Market analysis:
The current price of 3280 has a higher profit and loss ratio advantage. Technical indicators show that the hourly chart is severely oversold. Combined with the top and bottom conversion of 3300 above, there is a 20-point rebound space in the short term. If the PCE data is in line with the trend, gold prices are expected to quickly regain the 3,300 mark. Note that negative data beyond expectations may cause a brief decline.
🏅 Trading strategies:
BUY 3295-3280-3275
TP 3298-3300-3310
SELL 3300-3310
TP 3290-3280-3260-3250
If you agree with this view, or have a better idea, please leave a message in the comment area. I look forward to hearing different voices.
TVC:GOLD FXOPEN:XAUUSD FOREXCOM:XAUUSD FX:XAUUSD OANDA:XAUUSD
Goldprediction
Gold is weak. Can it continue?Gold is still fluctuating and falling slightly today. Gold is weak, so gold is likely to be short-term. If the price rebounds, it will be a short opportunity.
We need to pay attention to the release of US PCE data later.
From the 1-hour chart
the moving average continues to cross the short arrangement and diverge downward. After gold fell below the early support near 3340, it began to move downward weakly. The current upward pressure is around 3295-3310.
From the daily chart, the price is below the MA20 cycle and the 50 cycle, but remains above the 100 cycle. The technical indicators turned higher, but the momentum indicator is at a neutral level, and the RSI index is around 42.7, which does not point to an upward trend.
Since the upcoming data may have some impact on the price, the price may have a short-term high opportunity. Steady trading is still waiting for the price to rise and then short. Of course, if your trading strategy is more aggressive, you can use a long strategy before the price rises.
Operation suggestions:
Radical: Buy near 3280, stop loss at 3265, profit range 3305-3310.
Conservative: Wait for the price to rise and then bear pressure, sell near 3310, stop loss at 3320, profit range 3290-3285.
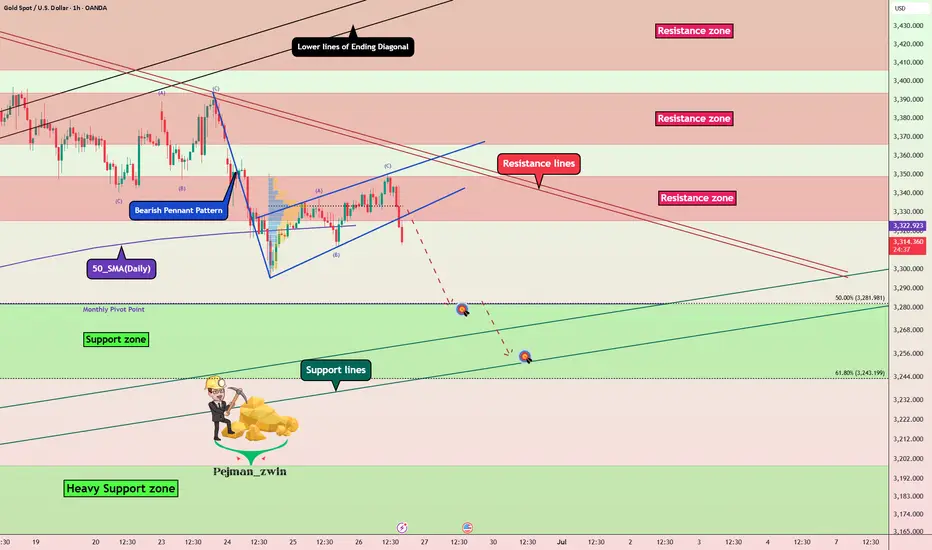
Gold Breakdown Confirmed — Bearish Pennant Targets UnfoldingGold ( OANDA:XAUUSD ) started to decline as I expected in my previous idea after the lower lines of the Ending Diagonal broke .
Gold is moving near the Resistance zone ($3,349-$3,325) . And Gold seems to be crossing the 50_SMA(Daily) .
From a Classical Technical Analysis perspective , the Bearish Pennant Pattern seems to indicate a continuation of the downtrend in Gold .
From an Elliott wave theory perspective , it seems that Gold has completed the Zigzag Correction(ABC) , and we can expect the next 5 downwaves .
I expect Gold to continue to decline at least to the Support zone($3,281-$3,243) and Monthly Pivot Point .
Note: Stop Loss (SL) = $3,360
Gold Analyze (XAUUSD), 1-hour time frame.
Be sure to follow the updated ideas.
Do not forget to put a Stop loss for your positions (For every position you want to open).
Please follow your strategy; this is just my idea, and I will gladly see your ideas in this post.
Please do not forget the ✅ ' like ' ✅ button 🙏😊 & Share it with your friends; thanks, and Trade safe.
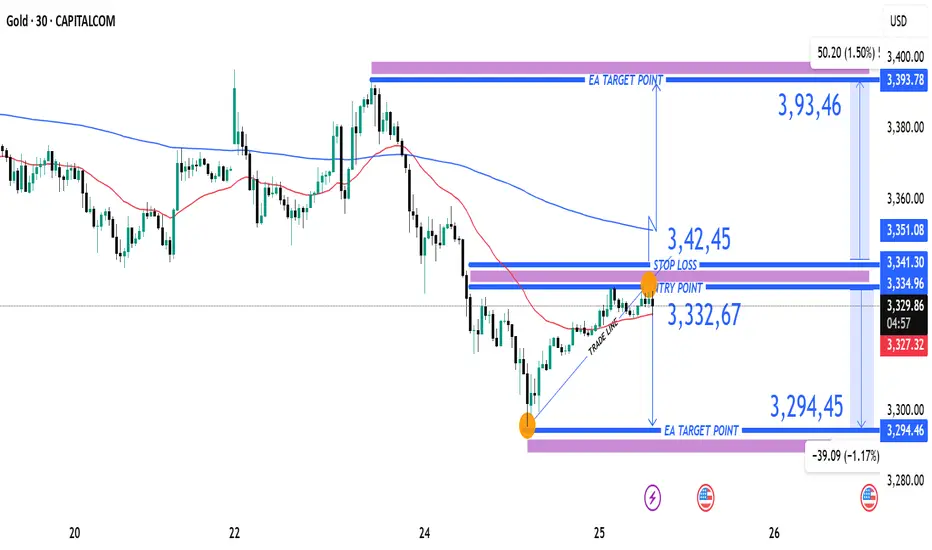
XAUUAD Reversal Setup Short Trade Opportunity Below Resistance Current Price: 3,327.56 USD
Entry Point: 3,332.67 USD
Stop Loss: 3,342.45 USD
Take Profit Levels:
Target 1 (Downside): 3,294.45 USD (-1.17%)
Target 2 (Upside): 3,393.78 USD (+1.50%)
🔧 Technical Indicators & Tools
Trade Line: Upward sloping trendline connecting higher lows, supporting recent bullish structure.
Moving Averages:
Red: Short-term (likely 50-period EMA)
Blue: Long-term (likely 200-period EMA)
Price is still trading below the long-term MA, suggesting broader bearish pressure.
Resistance Zone: 3,334.96–3,341.30 — a key supply area marked in purple.
Support Zone: 3,294.45 — identified as a previous demand level.
⚖️ Risk-Reward Analysis
Short Setup:
Entry: 3,332.67
Stop Loss: 3,342.45 (Risk ~10 USD)
Target: 3,294.45 (Reward ~38 USD)
R:R Ratio ≈ 1:3.8, which is favorable for a short trade.
📌 Summary
Bias: Bearish intraday
Setup Type: Short-sell at resistance zone
Confirmation: Price rejection or bearish candle near 3,334–3,342 zone
Invalidation: Break and close above 3,351.06 (upper resistance)
XAU/USD GOLD 4H + 1H PREMIUM TECHNICAL OUTLOOK – JUNE 27, 20254-HOUR TIMEFRAME – HIGHER TIMEFRAME BIAS
Gold continues to trade near its all-time highs, consolidating just below a recent swing high of $3,315. Despite minor pullbacks, the macro trend remains bullish, with bullish structure still intact. Recent price action shows shallow retracements and strong rejections of key fib levels, a typical sign of underlying smart money accumulation.
Price Action & Market Structure
Gold recently printed a Break of Structure (BOS) at $3,290, followed by a retest of the broken level.
We observed a Change of Character (CHoCH) near $3,300, quickly invalidated by bullish strength – further confirming accumulation behavior.
Market remains in bullish alignment unless $3,250 is broken decisively.
Key Support & Resistance Zones
Resistance $3,315–$3,320
Demand $3,275–$3,282
Support $3,250
Targets $3,340 / $3,355
Smart Money Concepts (SMC)
Liquidity Grab beneath $3,275 likely triggered retail stop hunts
4H Bullish Order Block between $3,275–$3,282 remains unmitigated
Imbalance Zone: $3,283–$3,289 – price may wick into this before launch
Sell-side liquidity taken below $3,275 → bullish reaction
Buy-side liquidity sits above $3,315 → likely short-term magnet
ZOOMING INTO 1-HOUR CHART – INTRADAY SETUPS
The 1-hour chart aligns with the bullish higher-timeframe bias, offering two potential premium-level setups:
Setup #1: Bullish Rejection from 4H OB
Entry Zone: $3,275–$3,282
This setup targets a liquidity sweep beneath $3,275 followed by bullish mitigation of a clean order block and imbalance zone. Confluence across fibs, OB, and structure support increases probability.
Setup #2: Breakout Retest Play
Trigger: Clean breakout and retest of $3,315
Entry: On successful retest (bullish confirmation candle)
Ideal if momentum pushes through local resistance, clearing buy-side liquidity. Reclaim of structure suggests smart money continuation.
Bearish Contingency (Low Probability for Now)
If price breaks below $3,250 and confirms below structure:
Look to short on retests into $3,275
Target next demand around $3,235
Until that happens, bullish bias remains dominant.
Gold remains one of the most structured and responsive instruments to smart money technicals right now. A well-planned entry around demand, imbalance, or breakout levels provides excellent RRR potential if structure holds.

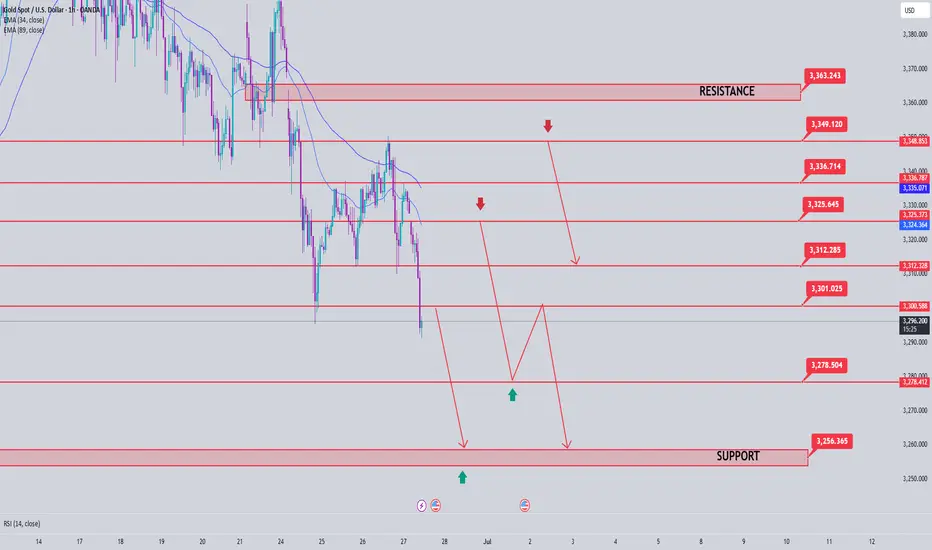
Gold Price Analysis June 27Daily Trend Analysis:
The price has reacted strongly at the 3348 level, forming a clear and sustainable bearish structure. The 3296 zone is now a critical level — a confirmed breakout below this area could lead to a deeper decline, especially with limited potential for recovery on Friday.
Today, the bearish trend is likely to face less resistance compared to the bullish side. As such, a move toward the support zones at 3278 and 3255 is highly probable.
Any bullish retracement during the European session should be viewed as a good opportunity to look for SELL setups, targeting 3278 and 3255.
As previously analyzed, SELL zones are clustered around key resistance levels. Traders should closely watch price reactions in these areas for potential entry signals.
🔹 Breakout key level: 3296
🔹 Support zones: 3278 – 3255
🔹 Resistance zones: 3300 – 3312 – 3325 – 3336 – 3348 – 3363
Gold fluctuated and fell, and the rebound was directly short
📣Gold News
Due to the easing of the situation in the Middle East, gold has fallen in the past few days, and the market has been eagerly looking forward to the interest rate cut, because the tariffs in the Trump era may push up inflation, but it has not come yet. "
On Thursday, the U.S. Department of Labor and Commerce issued key economic data, including initial jobless claims and the final value of real GDP in the first quarter. The number of initial jobless claims was 236,000, a decrease of 9,000 from 245,000 in the previous week, better than the market expectation of 245,000. At the same time, as of June 14, the number of continued unemployment claims in the week increased by 37,000 to 1.974 million, a new high since November 2021. Gold stopped below the moving average today. Gold did not continue the small positive line rise, and the decline continued during the U.S. trading period.
Today, focus on the continuation of short positions, comprehensive Labaron believes that gold is bearish today. For today's operation, consider rebound shorting as the main, and low long as the auxiliary.
📣 Pay attention to the resistance of 3330-3345 US dollars above
📣 Pay attention to the support of 3300-3280 US dollars below
💰 Go long near 3295-3285, target 3310-3320
💰 Go short near 3330-3340, target 3000-3290
If you have just entered the market, you are confused about the market of gold, oil and silver, and you always do the opposite operation direction and the entry price is unstable. I hope Labaron's article will help you.
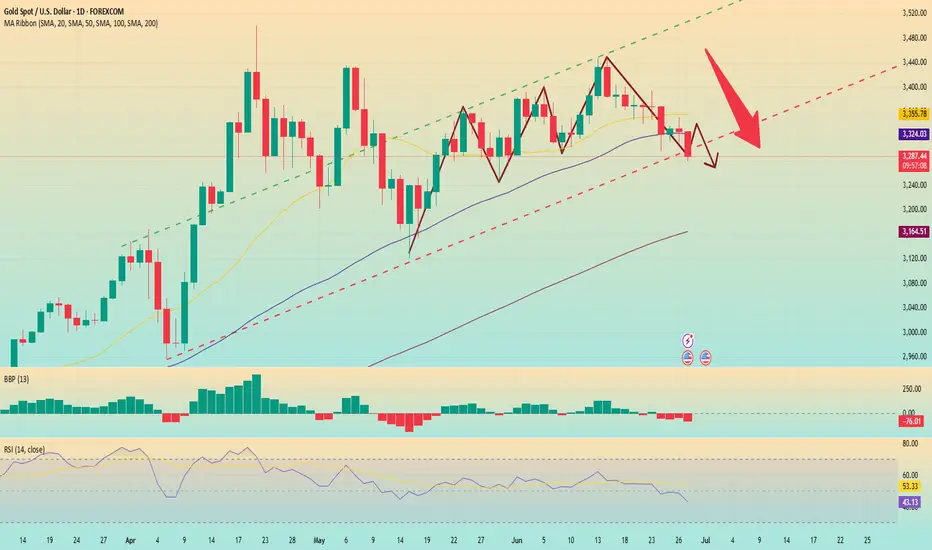
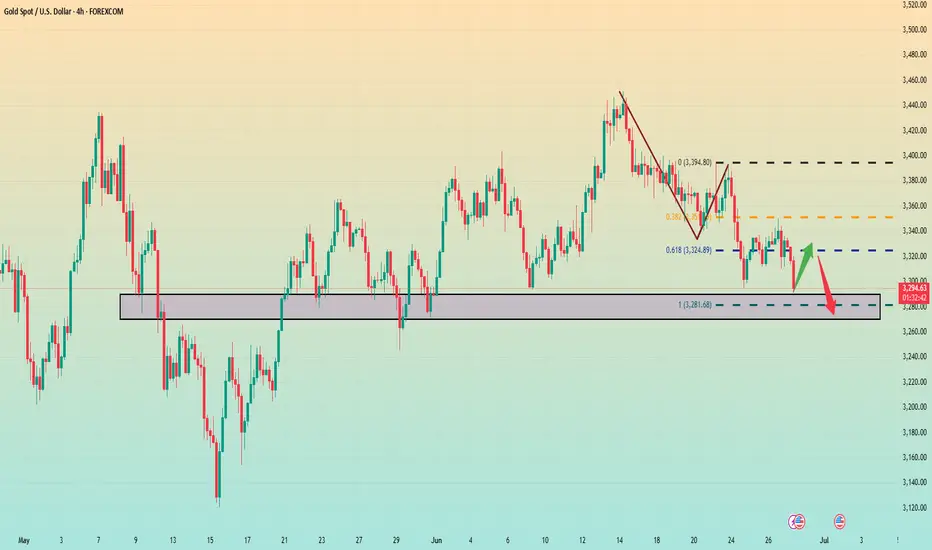
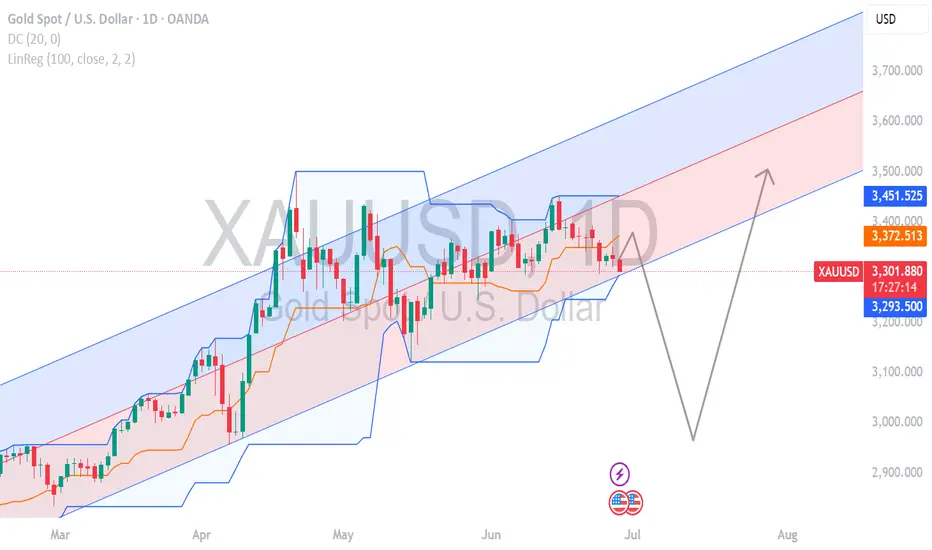
Gold breaks down. It may reach a low point.From the current market daily chart
The absolute support of gold is around 3280. Gold is basically in the process of maintaining this daily trend support line. Therefore, I personally think that around 3280 is a long-short dividing line for gold. If gold falls below 3280 on the daily line, it is very likely that the decline will just begin. On the contrary, be careful. If 3280 does not fall below, there is still a possibility of rebounding.
In the 4-hour chart, from the high point of 3450 to now, the 0.382 position is just around yesterday's high point of 3350. The 0.618 position is at 3325, and the final 100% position is around 3280. 3280 also coincides with the daily chart.
Therefore, gold must at least test around 3280 today, and it is not ruled out that there will be lower positions.
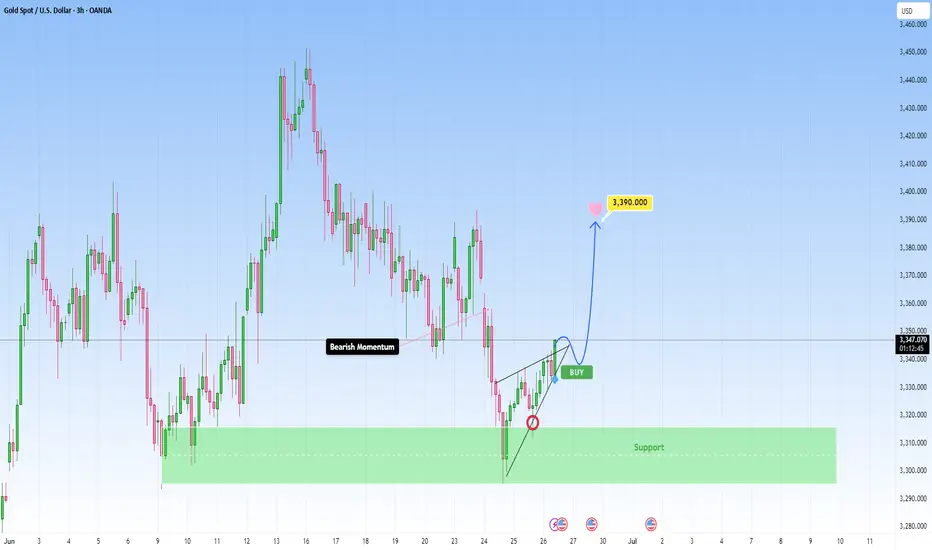
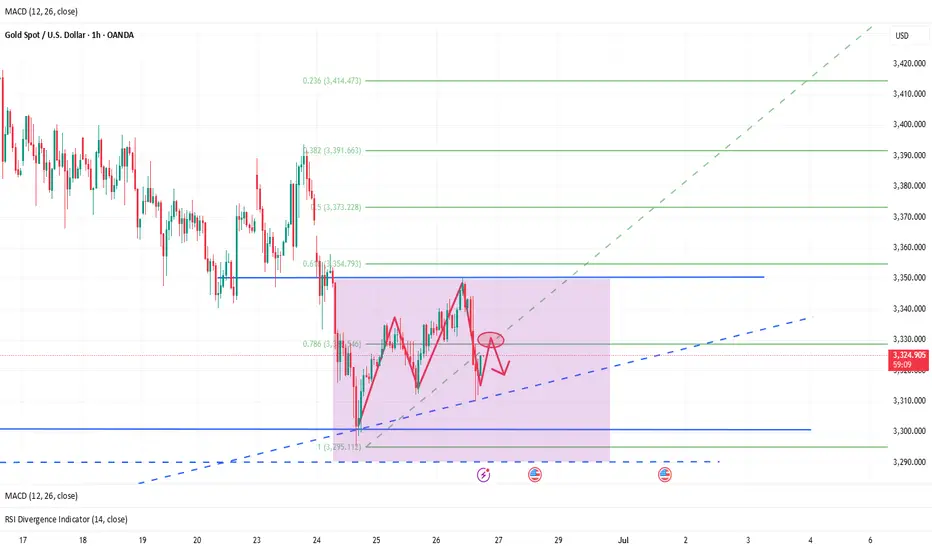
GOLD drops sharply to 3300 and found important support areaThe recent bearish momentum on GOLD has met a good support zone and at present we started to see early signs of bullish interest returning, right after we got a beautiful rejection from the zone.
Currently I’m expecting for the price to bounce to the target near 3,390 . If this bullish push continues with strong volume and momentum, I’ll be locking in that bias and planning my entry accordingly. I could get involved right here for a more aggressive entry. It’s a bit riskier, but if the structure confirms, I’m more than happy to take the shot, as sometimes the best trades come when you trust your setup.
This is not financial advice.
Analysis and layout of the latest gold trends during the day📰 Impact of news:
1. PCE and Consumer Index
📈 Market analysis:
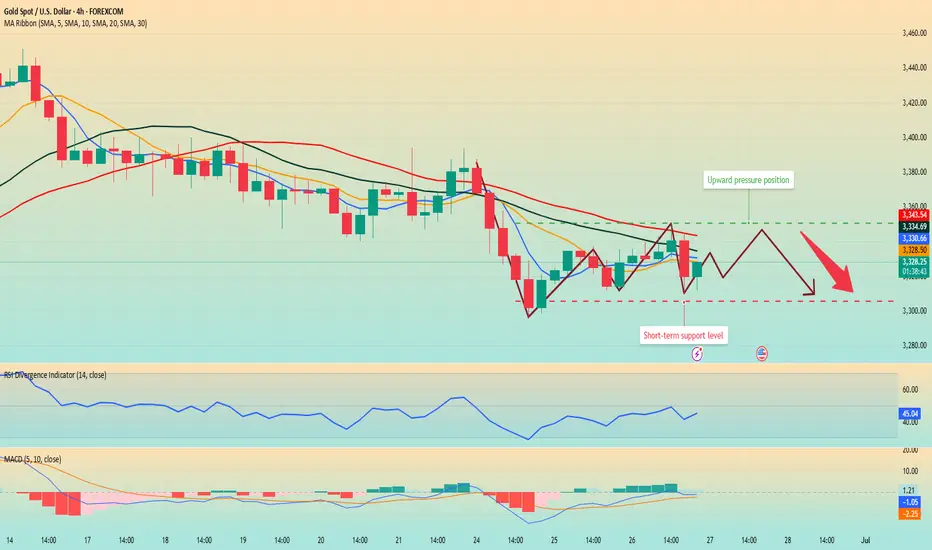
Judging from the 4H chart, the Bollinger Bands are closing and the MACD is showing a trend of forming a death cross, indicating that the short-selling momentum is still relatively strong in the short term. However, as the overall upward structure has not been destroyed, there is still a possibility of a rebound and repair in the future. During the day, we need to pay special attention to the support strength of the MA5 and MA10 moving averages. It is recommended to adopt the idea of shorting at high levels and going long at low levels. The key support below is the 3305-3295 area, and the upper resistance is the 3340-3350 range. However, judging from the chart, in the short term, there may be a rebound near 3313. At present, it has indeed rebounded to around 3319 as expected. If it falls weakly to this week's low of 3295, you can buy if it does not break. On the whole, if it rebounds to 3335-3345, you can consider shorting, and if the support below 3305-3295 is not broken, go long. Today is Friday, and as it is near the end of the month, market liquidity is strong. Please be cautious in your operations today and be sure to set stop losses strictly.
🏅 Trading strategies:
SELL 3335-3345-3350
TP 3320-3315-3300
BUY 3305-3295
TP 3310-3320-3330
If you agree with this view, or have a better idea, please leave a message in the comment area. I look forward to hearing different voices.
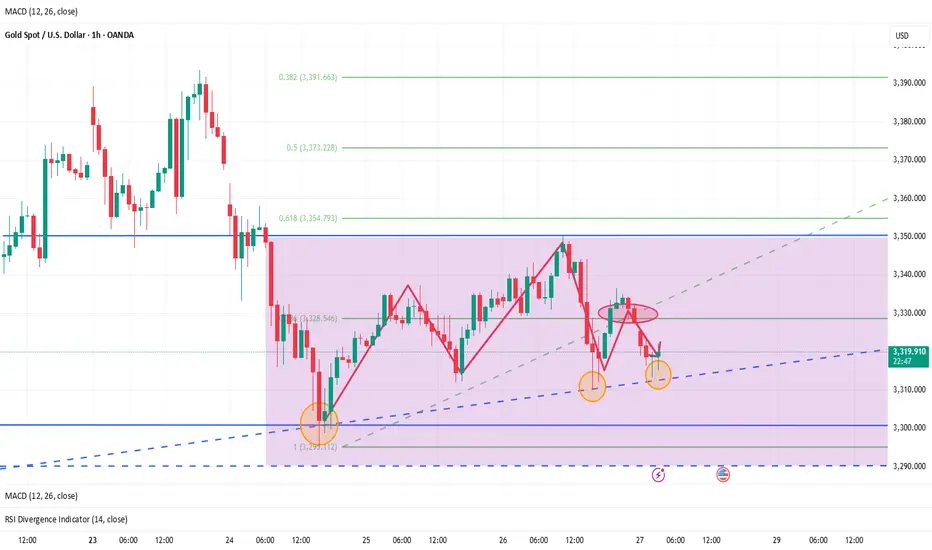
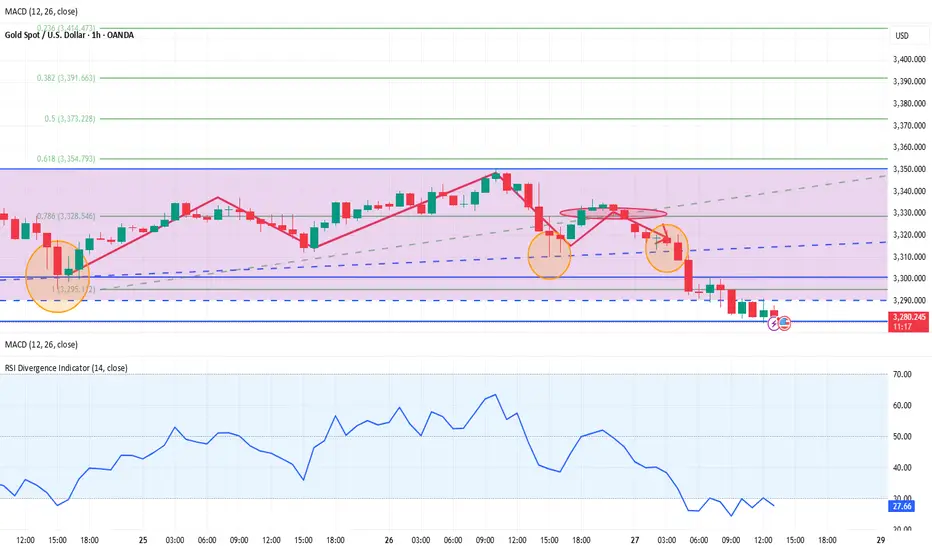
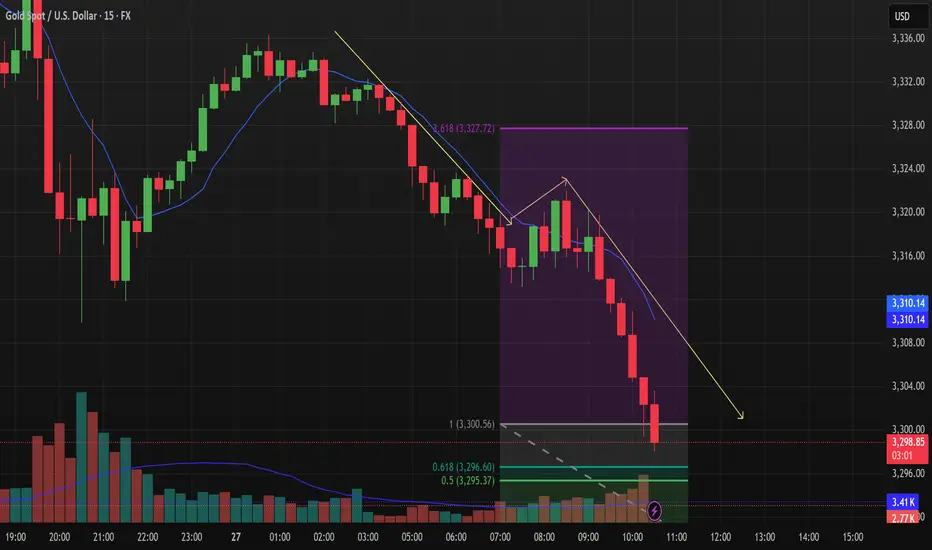
XAUUSD: Bearish Trend, Key Support at $3,295Market Overview
In today’s trading session (26/06/2025), XAUUSD shows continued downward momentum. Gold prices are currently hovering around $3,302.05, with a slight drop of 0.01%. The intraday price range has been tight, between $3,330.00 and $3,350.00, indicating a battle between the buyers and sellers around the short-term equilibrium zone.
Recent price action suggests that after a brief recovery, gold is once again encountering resistance at the $3,350.00 level. In the coming hours, a decisive breakout either above this resistance or below current support will dictate the market’s next move.
Key Technical Levels to Watch:
Support Levels: The first significant support is at the $3,295.37 level (50% Fibonacci retracement), with the next support at $3,296.60 (61.8% Fibonacci retracement), followed by a crucial level at $3,300.56.
Resistance Levels: The primary resistance area lies around $3,350.00, with the second resistance at $3,327.72, which coincides with the 3.618 extension of the previous price swing.
Price Action Analysis
As seen in the chart, XAUUSD is currently trading below both the 50-period (blue) and 200-period (yellow) moving averages, indicating a strong bearish trend. The price action is forming a series of lower lows and lower highs, reinforcing the downtrend.
Bearish Trend Continuation: A break below the support at $3,295.37 could signal further downside towards $3,290.00 or even $3,275.00. The yellow trendline indicates the overall bearish direction, and any failure to hold above $3,300.00 could trigger additional selling pressure.
Fibonacci Retracement Levels: Price is testing the 50% and 61.8% Fibonacci levels. A rejection at these levels could cause a pullback towards lower support zones, confirming the bearish outlook for the short term.
Volume Analysis
The volume chart shows relatively low volatility, with decreasing volume during the price pullbacks. This suggests that there is not enough buying interest to push the price higher, and the market may be more inclined towards bearish continuation in the near term.
Market Sentiment
Currently, the market is undecided. The recent price action suggests that traders are waiting for a confirmation of direction. The next few hours are critical in determining if the downtrend will continue or if we will see a short-term bounce at one of the key support levels.
Trading Strategy
Short Position: A break below $3,295.37 would be an excellent opportunity to short XAUUSD with a target at $3,290.00, and further down to $3,275.00.
Long Position: Only consider long positions if XAUUSD manages to break above $3,350.00 decisively, with the next target near $3,375.00.
Conclusion
XAUUSD remains under pressure, and unless there’s a strong reversal at support levels, the bearish momentum could continue in the short term. Traders should monitor the key levels mentioned above closely to adjust positions accordingly.
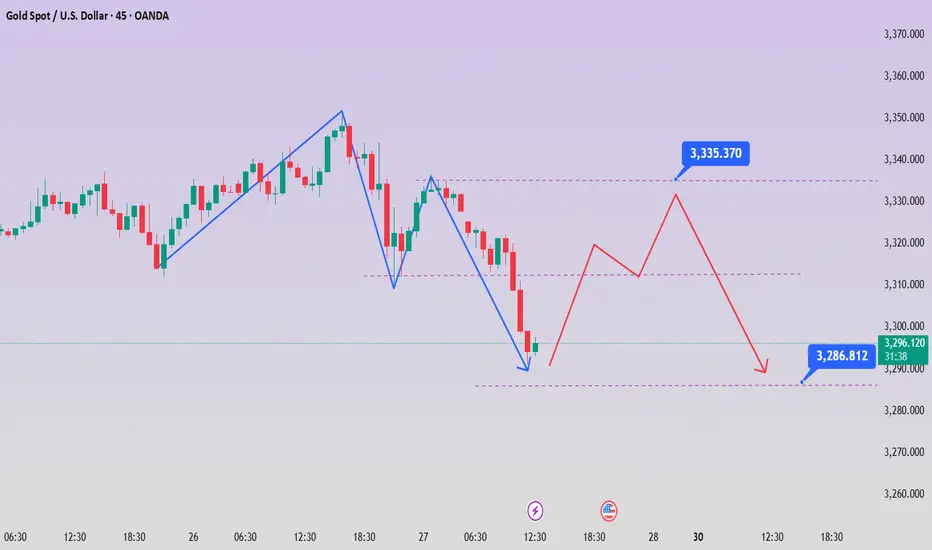
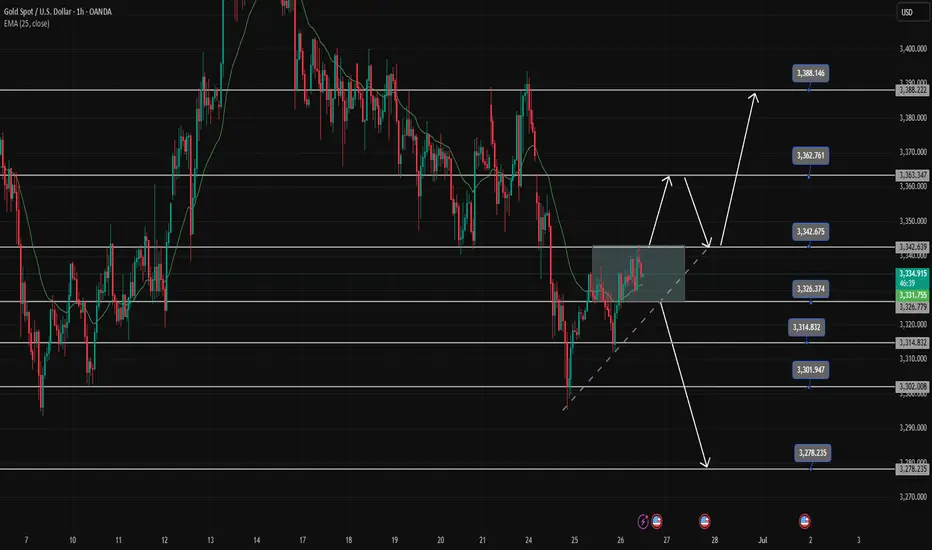
Gold Trading Strategy June 26✏️ D1 candle shows a recovery but not significantly. Gold is currently reacting at the key resistance zone of 3342.
The immediate support zone that the price is heading toward is 3326. This forms a breakout range between 3326 and 3342.
A bullish channel may form if there is a strong price reaction at 3326. Conversely, if 3326 is broken, it could confirm a continuation of the downtrend targeting 3302 during the European and US sessions today. The bearish target could even extend to 3278.
📈 Key Levels
Breakout Range: 3326 - 3342
Support: 3326 - 3314 - 3302 - 3278
Resistance: 3342 - 3363 - 3388
📊 Recommended Trade Setups
BUY: 3302–3300 | SL: 3297
SELL: 3363–3365 | SL: 3369
XAUUSD GOLD buy holdXAUUSD GOLD BUY NOW – LONG TRADE SETUP ACTIVE 🟡📈
Gold has pulled back to a key support area and is now showing signs of strength at the current price of $3301.
This zone is acting as a strong base for buyers, signaling a potential bullish continuation in the coming sessions.
We are entering a LONG position with a favorable risk-to-reward ratio, supported by market structure and technical confirmation.
🔹 Current Price: $3301
🎯 Target Levels: First target at $3350, extended target at $3400+
🛑 Stop Loss: Recommended below $3275 to protect capital
As long as price holds above the support zone, bulls remain in control.
Patience, discipline, and proper risk management are key — let the trend do the work.
Gold is poised for upside — time to ride the wave!
6.27 Risk aversion dissipates and gold prices adjust! The range As the Middle East war came to an end, the risk aversion sentiment in the global financial market subsided, the risk aversion funds dissipated, and the three major bullish markets of gold, crude oil, and silver all fell downward; at the same time, the US dollar index broke a new low !
Fundamentals:
1: The Middle East war has been temporarily paused, and both sides have entered the adjustment phase; however, irreconcilable contradictions may become the starting point of the next war at any time; although it has ended for now, we must not slack off. Once the two sides are on the verge of a war again, risk aversion will sweep the world again; this is not impossible;
This Middle East war came suddenly and ended suddenly; it was like a child's play washing the global financial market; therefore, the possibility of a resumption of war cannot be ruled out in the future;
At present, in the overall market:
1: In the short cycle, the gold price fluctuates downward, so in the short term, the short-term decline is seen, and the fluctuation is downward;
2: In terms of trend, the range is temporarily contracted, the BOLL of the daily K is contracted, the speed slows down, and the overall range is back to the range of fluctuations; there is no obvious long and short trend, and it returns to the range of fluctuations;
Today's technical trend chart:
1: In 4 hours, the stochastic indicator crosses downward, which is a main empty signal; in terms of form, it is temporarily under pressure from the central axis track of the 4-hour BOLL, and the empty trend continues downward, and the form tends to continue to oscillate downward; therefore, it is recommended to choose the high-altitude approach for 4 hours;
2: In the daily K, the stochastic indicator continues to cross downward, which is a empty signal; in terms of form, it is temporarily a broken Yin and Yang pattern, with no obvious trend; BOLL forms a contraction, the range of 3417-3277, the range is mainly in an oscillating trend, and the strong and weak dividing point is near 3347;
Comprehensive: The daily K is mainly in an oscillating trend, so it is recommended to deal with it according to the oscillating trend, choose to buy low and sell high; the reference pressure position is near 3347, the support position is near 3295 and 3278; the second pressure position is 3390-3400 pressure position; continue to choose the oscillating approach, and play a oscillating treatment of buying low and selling high;

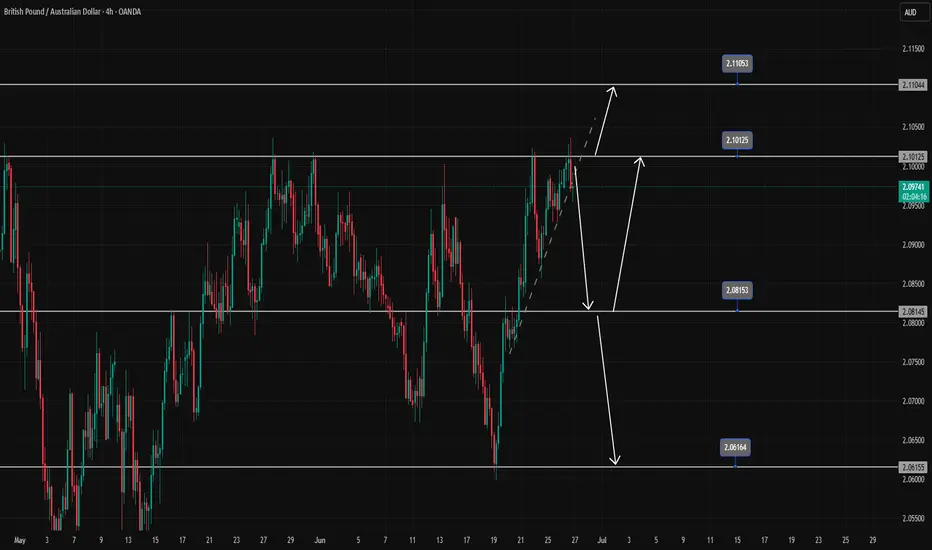
GBPAUD Refuses to Make New Weekly HighsFailed to trade above the resistance zone of 2.101
Currently, the weak reaction at the trendline suggests that it will be difficult for the pair to push higher.
If the trendline breaks, the downtrend may extend toward 2.08100 — a level where buyers are likely to step back into the market.
We are waiting for further price action around the 2.081 support zone to look for new trade signals.
If this level is broken, 2.061 will become the next target for all SELL positions.
On the contrary, if the price bounces from 2.081, strong buying momentum could emerge and potentially break through the 2.101 resistance, targeting 2.110.
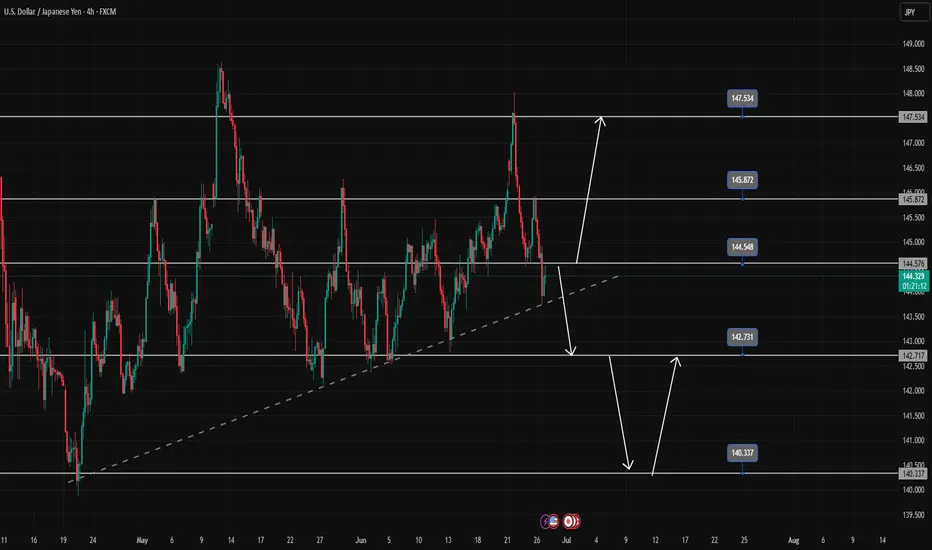
Is USDJPY in a Downtrend?USDJPY is supported by the trendline and the price is facing the resistance zone of 144.500. If the candle cannot close above this resistance zone, the sellers can push the price to break the trendline and head towards the support zone of 142.700. This support zone plays an important role in shaping the trend if broken the downtrend can be extended and no support zone can be strong enough to push the price of the pair until 140.300.
There is still a high possibility of a reaction so the BUY strategy at the support zone of 142.700 is still ready
On the other hand, if the candle closes above the resistance zone of 144.500, the uptrend is still maintained and heading towards this week's peak around 147.500. Pay attention to the price reaction at 146.000.
Bulls and bears are anxious? Rebound continues to empty📰 Impact of news:
1. Initial unemployment claims data
📈 Market analysis:
Gold is in a sideways consolidation near 3320 in the short term. The market has no clear direction for the time being, and the long and short positions are in a tug-of-war. The hourly line rebounded to 3328 and then fell back again, suggesting that there is still room for short-term retracement. The current operation needs to focus on key points: if it rebounds to the 3320-3330 resistance area, you can consider entering short positions again. If the market continues to decline, focus on the 3300-3290 support range. If it stabilizes, long orders can be arranged. The overall idea is to maintain a volatile market. Before effectively breaking through 3350 or falling below 3290, high-altitude and low-multiple is still the main strategy.
🏅 Trading strategies:
SELL 3320-3330
TP 3310-3300-3290
BUY 3310-3300
TP 3320-3330-3340
If you agree with this view, or have a better idea, please leave a message in the comment area. I look forward to hearing different voices.
OANDA:XAUUSD FX:XAUUSD FOREXCOM:XAUUSD FXOPEN:XAUUSD TVC:GOLD
XAUUSD – Key Inflection Zone Before Core PCE Price Index m/mGold opened today with a bearish gap, once again struggling to stay above the 3327–3305 support zone, the same range where it hovered yesterday. While the price did form a higher low and higher high structure on the lower timeframes, this move still lacks the strength to signal a proper reversal—rather, it looks more like a minor consolidation ahead of tonight’s US GDP and Unemployment Claims release.
At this point, gold is trapped between two key forces:
A resilient resistance zone formed by the downtrendline, unfilled gap from earlier this week, and confluence of MA50 & MA200
A rising minor support trendline, creating a tightening range and indicating that the next breakout may provide a clearer direction.
⚠️ Technical Outlook
As long as gold remains below 3366–3367, the prevailing downtrend structure remains valid. Any rally into that zone should be viewed cautiously, especially if accompanied by weak volume or rejection candles. However, if gold manages to break and close H4 above 3367, it could trigger a short-term correction toward 3396 or even higher, aiming to fill the previous gap.
But so far, the momentum remains bearish, and lower highs continue to dominate the mid-term structure.
🔽 Trade Idea (Cautious Swing Trade)
Due to the wide stop-loss required, we recommend using reduced position size to maintain proper risk management.
🔵 Sell Area: 3358 – 3367
❌ Stop Loss: 3396 (above the trendline and prior key high)
🎯 Take Profit 1: 3331
🎯 Take Profit 2: 3306
🎯 Take Profit 3: 3289
🧠 Risk Level: Moderate to High (Lot size should be adjusted)
R3: 3379
R2: 3366
R1: 3350
Pivot: 3327
S1: 3305
S2: 3286
S3: 3256

XAUUSD/GOLDThe bullish trend has opened. After the retracement is confirmed, continue to buy and wait for the market to rise and fill the gap.
GOLD ROUTE MAP UPDATEHey Everyone,
A PIPTASTIC day on the markets with our analysis playing out in true level to level fashion.
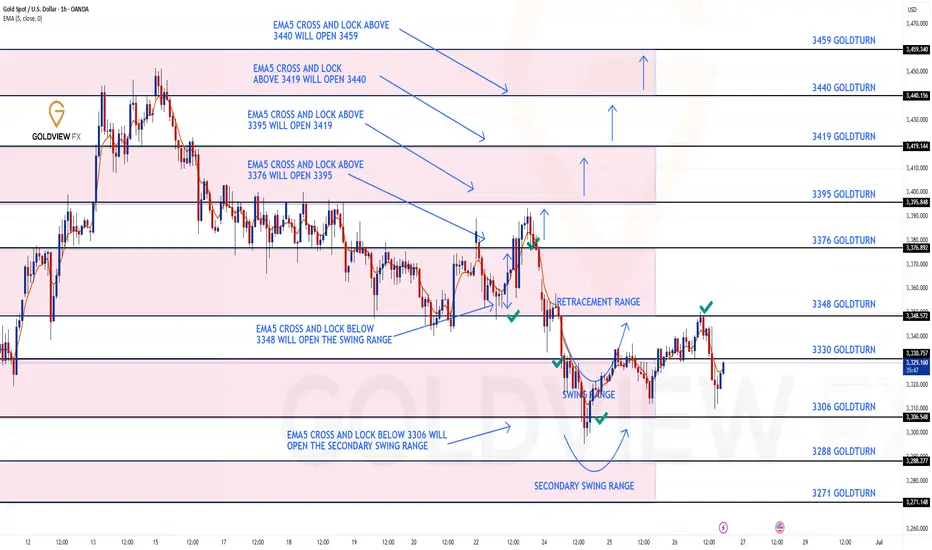
Yesterday we stated that that we had the cross and lock below 3348 opening the swing range, which was hit perfectly and gave the bounce and that we will now wait to see if the full swing is completed to 3348.
- This was played out to perfection with the full swing completed into 3348. No further lock above confirmed the rejection back into the swing range.
We will continue to buy dips using our support levels taking 20 to 40 pips. As stated before each of our level structures give 20 to 40 pip bounces, which is enough for a nice entry and exit. If you back test the levels we shared every week for the past 24 months, you can see how effectively they were used to trade with or against short/mid term swings and trends.
The swing range give bigger bounces then our weighted levels that's the difference between weighted levels and swing ranges.
BULLISH TARGET
3376 - DONE
EMA5 CROSS AND LOCK ABOVE 3376 WILL OPEN THE FOLLOWING BULLISH TARGETS
3395
EMA5 CROSS AND LOCK ABOVE 3395 WILL OPEN THE FOLLOWING BULLISH TARGET
3419
EMA5 CROSS AND LOCK ABOVE 3419 WILL OPEN THE FOLLOWING BULLISH TARGET
3440
BEARISH TARGETS
3348 - DONE
EMA5 CROSS AND LOCK BELOW 3348 WILL OPEN THE SWING RANGE
3330 - DONE
3306 - DONE
EMA5 CROSS AND LOCK BELOW 3306 WILL OPEN THE SECONDARY SWING RANGE
3288
3271
As always, we will keep you all updated with regular updates throughout the week and how we manage the active ideas and setups. Thank you all for your likes, comments and follows, we really appreciate it!
Mr Gold
GoldViewFX
Gold is sideways. Is a new trend brewing?Information summary:
On June 23, Trump announced that Iran and Israel reached a comprehensive ceasefire, but the asymmetric terms of the agreement caused the conflict to continue. Israel launched another air strike on Iran, and Israel threatened to kill Iranian senior officials. The uncertainty of geopolitical risks continues to support gold prices.
Market analysis:
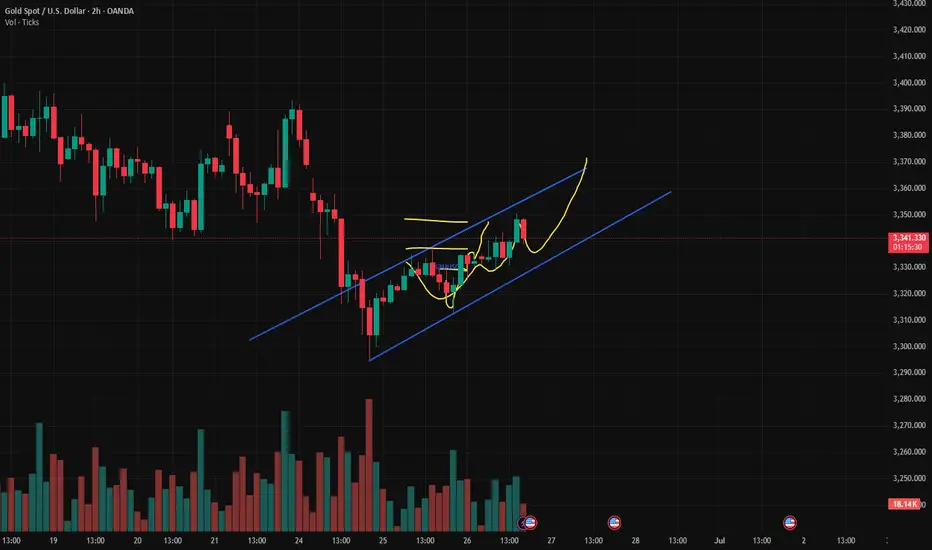
From the 4-hour chart, the MA5-day and 10-day moving averages show signs of upward divergence, and the K-line stands firm on the moving average support and fluctuates upward. In the short term, pay attention to the breakthrough and decline of the 3350 pressure level. The current market's downward momentum has weakened, and the overall market remains volatile. We need to be wary of the risk of short-term adjustments after continuous surges. Be alert to the short-term adjustment risks after continuous highs.
Operation strategy:
Short near the price rebound of 3345, stop loss 3355, profit range: 3330-3320.
Gold fluctuates at high levels, intraday trading points📰 Impact of news:
1. Initial unemployment claims data
📈 Market analysis:
Gold has begun to show signs of bottoming out in the short term in the past two days. Since the daily line bottomed out and pulled up, the daily line closed positive yesterday, and the bulls began to counterattack, and the 1H low was rising. If it doesn't fall further in the short term, it will most likely bottom out and rebound. The upper pressure is at the Bollinger middle track of 3355, which is also the high point of Tuesday's decline. If gold breaks and stabilizes at this price, it will have a larger upward space, and the upper side will look at 3385. In the 4H chart, MACD temporarily forms a golden cross, which is a bullish signal; but the BOLL track pressure is still there, and gold bears still have momentum in the short term. Therefore, on the whole, in the short term, gold should pay attention to the 3350-3360 resistance above. If it encounters resistance under pressure here, it can consider shorting. Pay attention to the 3330-3320 support area below.
🏅 Trading strategies:
SELL 3350-3360
TP 3340-3330-3320
BUY 3330-3320
TP 3340-3350
If you agree with this view, or have a better idea, please leave a message in the comment area. I look forward to hearing different voices.
TVC:GOLD FXOPEN:XAUUSD FOREXCOM:XAUUSD FX:XAUUSD OANDA:XAUUSD
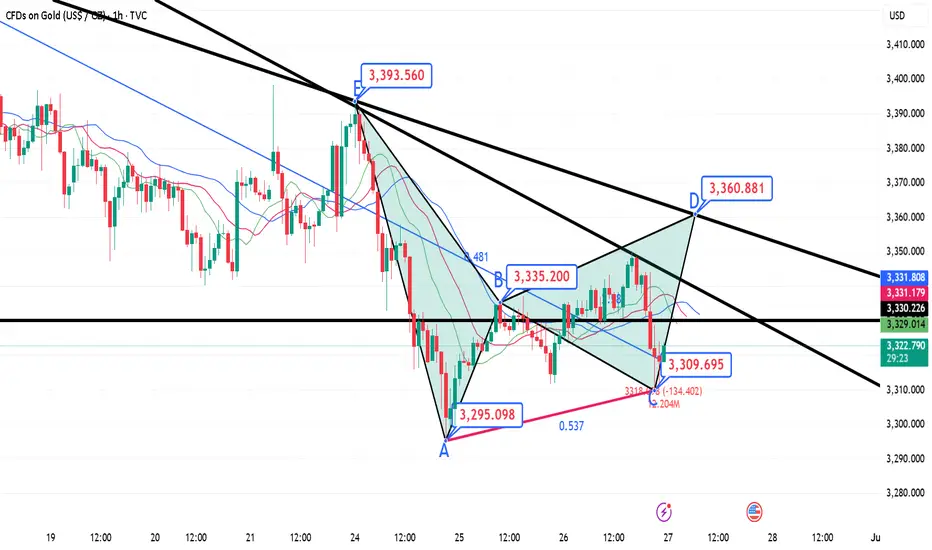
6.26 Gold intraday analysis and forecast—During the European session on Thursday (June 26), spot gold prices fluctuated significantly during the day, first falling and then rebounding, and are currently around 3337.60, fluctuating in a wide range.
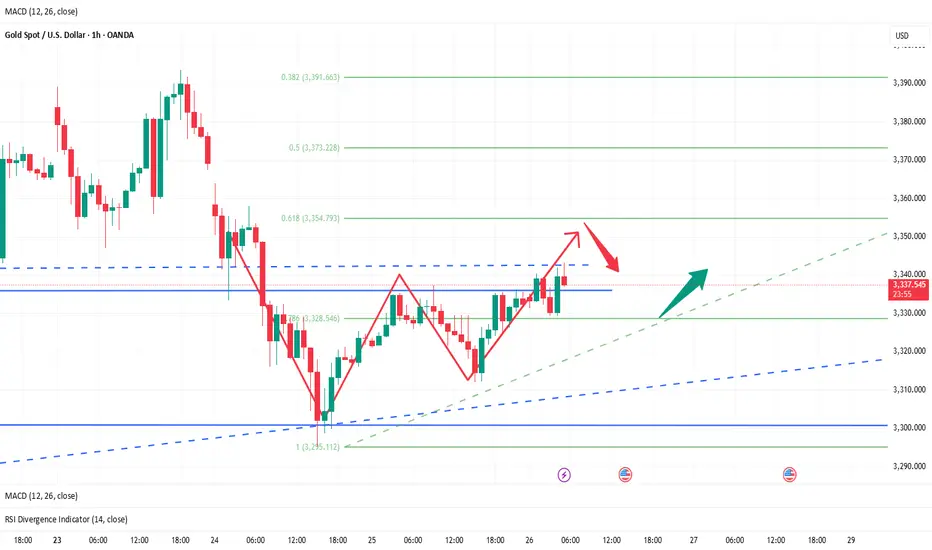
The rebound from Tuesday's low of $3295 has risen above the previous support of $3340 (June 20 low), confirming a deeper bullish correction. The currency pair may be in the C-D leg of a small Gartley pattern, moving towards the downward trend line resistance since the mid-June high (previously $3450, currently $3365).
A break above this level will mark a trend reversal and shift the focus to the $3400 line, which suppressed bulls on June 17, 18 and 22.
On the downside, if the above trend line is blocked, it may first seek support at the intraday low of $3330 before looking at the previously mentioned $3295 (June 9 and 24 lows).