Gold Prices Pull Back Amid Profit-Taking and Unchanged Fed ratesMacro approach:
- Gold prices have recently pulled back as investors took profits at elevated levels to offset losses elsewhere amid rising geopolitical tensions in the Middle East and steady Fed holding rates.
- Speculation is mounting that the US may involve into the Middle East conflicts, raising fears of a broader regional tensions.
- Meanwhile, a dovish Fed outlook signaling two potential rate cuts this year and concerns over growing US debt continues to provide underlying support for gold prices.
Technical approach:
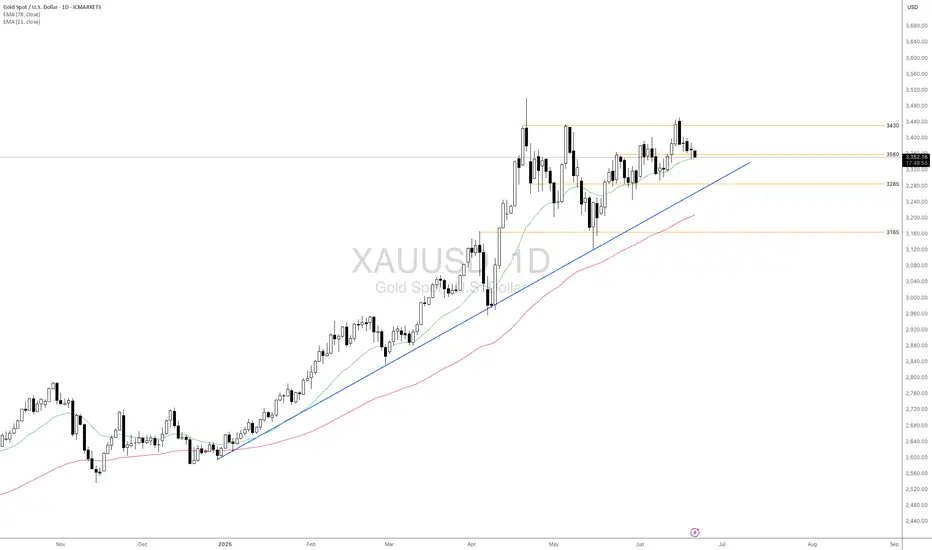
- XAUUSD is retesting EMA21, and the support level is around 3560. The price is above both EMAs, indicating that the upward momentum is intact.
- If XAUUSD closes below EMA21, it may continue to plunge and retest the following support at 3285, which is the confluence with the ascending trendline.
- On the contrary, remaining above 3560 may prompt a potential retest of the key resistance at around 3430.
Analysis by: Dat Tong, Senior Financial Markets Strategist at Exness
Goldprediction
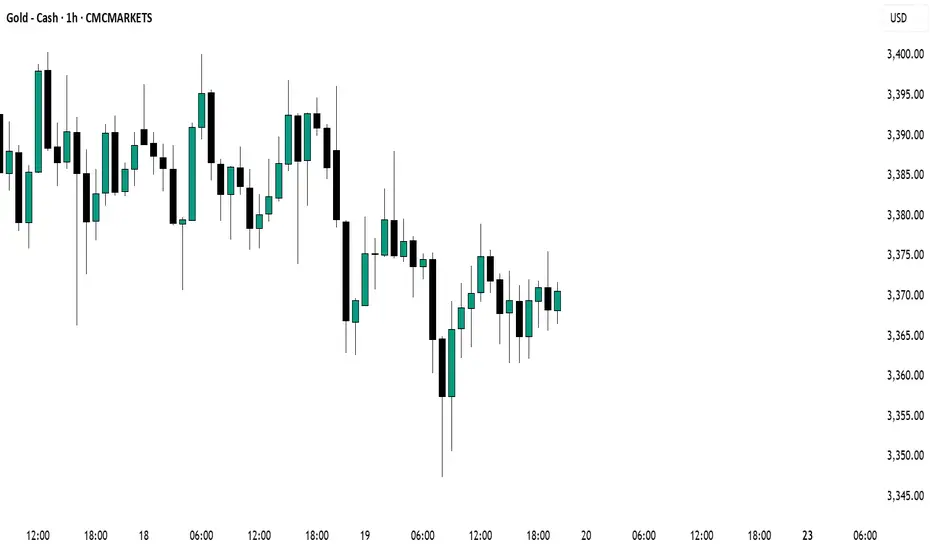
Gold Nears A Bullish BreakoutDepending on one’s timeframe, gold has either stalled or is gradually grinding higher. This is because gold has been moving sideways since mid-April but has been trending upward within a technical trading channel since mid-May. It has been a frustrating period for gold traders, with numerous false starts moving higher and lower. However, long-term holders certainly can’t complain.
The rising trading channel and the ascending 10-day exponential moving average are bullish signals, suggesting that gold could continue to climb if these trends remain intact. Additionally, the Relative Strength Index (RSI) is also trending upwards, further supporting a bullish outlook.
The significant test for gold remains at $3,400, an area where gold has repeatedly failed to break through. Yet, one could argue that the more gold tests this resistance level, the greater the likelihood of an eventual breakout.
However, should gold fail to break out and instead slip below the rising channel and the 10-day exponential moving average, it would create a bearish scenario, potentially pushing prices beneath support at around $3,325. Breaking this support could set the stage for declines towards $3,230, and possibly even down to $3,170, although current indicators suggest this scenario is less likely.
With geopolitical tensions escalating and economic uncertainty heightened by global trade concerns, gold is likely to remain an attractive safe-haven asset in the near term. Nevertheless, should these tensions ease or uncertainties diminish, gold may face a pullback; yet, for now, further upside appears to be the most probable outcome.
Written by Michael J. Kramer, founder of Mott Capital Management.
Disclaimer: CMC Markets is an execution-only service provider. The material (whether or not it states any opinions) is for general information purposes only and does not take into account your personal circumstances or objectives. Nothing in this material is (or should be considered to be) financial, investment or other advice on which reliance should be placed.
No opinion given in the material constitutes a recommendation by CMC Markets or the author that any particular investment, security, transaction, or investment strategy is suitable for any specific person. The material has not been prepared in accordance with legal requirements designed to promote the independence of investment research. Although we are not specifically prevented from dealing before providing this material, we do not seek to take advantage of the material prior to its dissemination.
Gold-----sell near 3393, target 3380-3366Gold market analysis:
Yesterday, gold was basically a repeated shock, the K line was repaired at one position, and buying and selling were back and forth around the M side of the suppression platform 3405. Yesterday, our analysis was completely in line with our expectations. Yesterday, we also repeatedly arranged 5 sell orders, arranging 3382 break sell, 3387 sell, 3393 sell, 3382 sell, 3377 sell. Today's idea is to continue selling. The daily line cannot determine the bottom of this wave of decline. There are data in European and American time today. I think we can rely on the 3405 platform to be bearish before the data. If 3405 breaks, we adjust our thinking to be bullish. Otherwise, we can sell repeatedly. Gold is oscillating in the short term. Try not to chase it and wait for it to rebound and suppress the position to sell. In addition, the daily moving average suppression position of the moving average is 3396-3363, which is also the main reason for its repeated game at this position. The weekly buying momentum is not dead yet. Be cautious of its rocket in the second half of the week.
In today's Asian session, we will first focus on the suppression of 3395. The risk of taking more is relatively large. The low point below is not stable. The Asian session fell to 3370 and rebounded quickly. From the perspective of the pattern, 3372-3366 is the support. The suppression position of the 1H hourly moving average is near 3395. Yesterday's US session rebounded at around 3396, and the hourly K suppression position was 3400. All the above are suppressed. In addition, the opening position today is also near 3393.
Pressure 3393, 3400, 3405, support 3382, 3370, and the watershed of strength and weakness in the market is 3382.
Fundamental analysis:
In the previous fundamentals, we have been paying attention to geopolitical factors. The situation in the Middle East has indeed changed the way gold and crude oil are traded. Today we focus on the monetary policy of the Federal Reserve, and there is also a speech by Chairman Powell during the US session.
Operation suggestions:
Gold-----sell near 3393, target 3380-3366

Gold XAUUSD Move 18 June 2025Don't buy/sell this messy gold setup unless there's a clear, confirmed, and clean break— either above 3395 or below 3375.
Too many wicks = too much uncertainty and manipulation.
Investors clearly have no conviction right now.
👉 Wait for a solid candle close above 3395 for longs, or below 3375 for shorts.
Anything in between is just noise — stay out and stay safe.

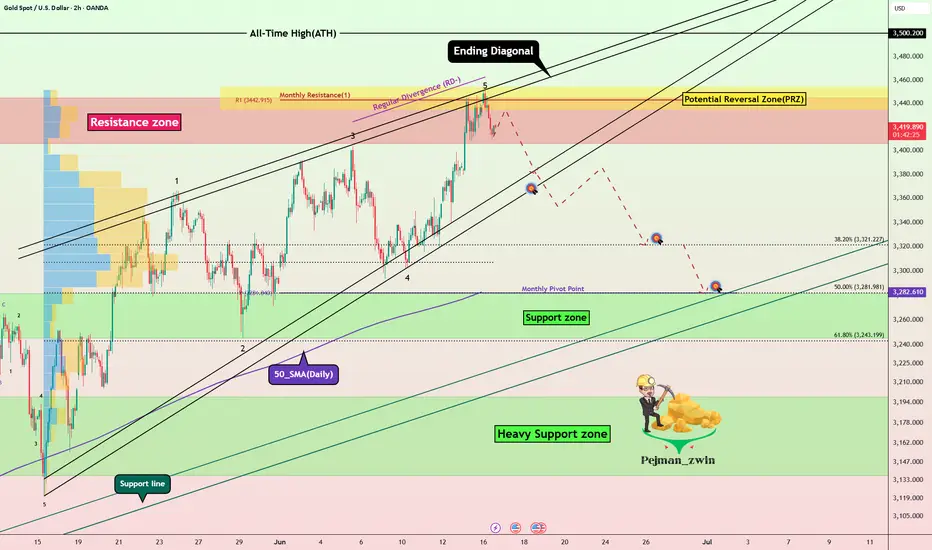
Gold Hits PRZ with RD-! Time for Bears to Take Over?Gold ( OANDA:XAUUSD ) attacked the Resistance zone ($3,445-$3,406) once again, forming an Ending Diagonal at the top of the structure.
Although price reached the Potential Reversal Zone (PRZ) , the presence of Regular Divergence (RD-) between the last two peaks could indicate the weakening of bullish momentum .
In terms of Elliott Wave theory , we can clearly count a completed 5-wave structure , with an Ending Diagonal pattern . This supports the idea of a major correction starting soon .
I expect Gold to attack the lower lines of Ending Diagonal , and if it breaks, it could drop to at least $3,333 . The Second Target could be the Support zone ($3,451-$3,120) .
Do you think Gold will make a new All-Time High(ATH) again in this rally?!
Note: Stop Loss (SL) = $3,463
Gold Analyze (XAUUSD), 2-hour time frame.
Be sure to follow the updated ideas.
Do not forget to put a Stop loss for your positions (For every position you want to open).
Please follow your strategy; this is just my idea, and I will gladly see your ideas in this post.
Please do not forget the ✅ ' like ' ✅ button 🙏😊 & Share it with your friends; thanks, and Trade safe.
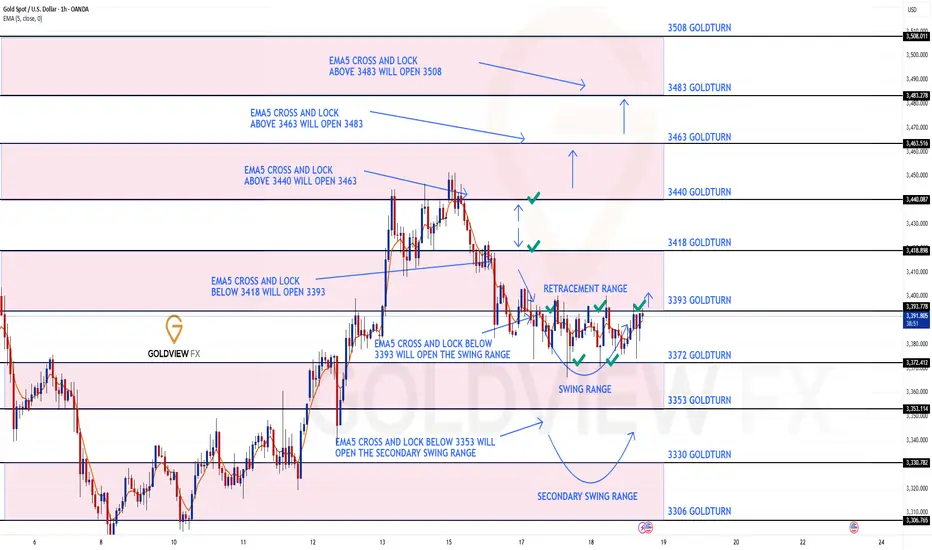
GOLD ROUTE MAP UPDATEHey Everyone,
Once again our levels deliver the magic!!
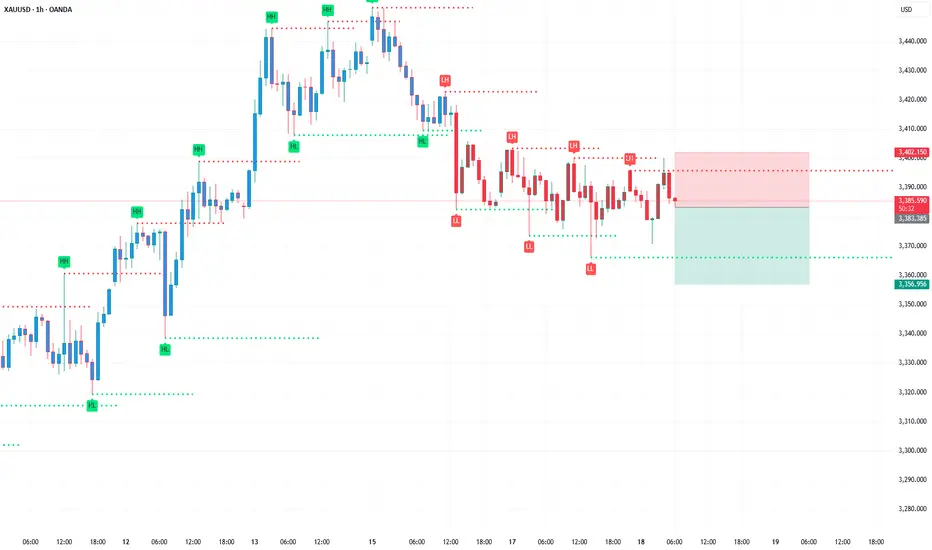
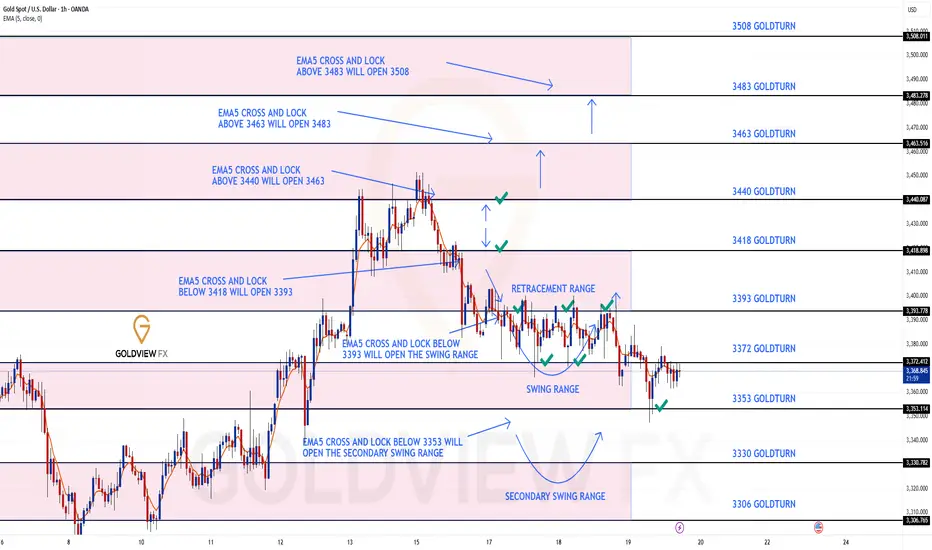
Yesterdays update, we stated that we got the move into 3393 just like we analysed for the first level of swing and that we will now look for ema5 to cross and lock 3372 or 3393 to confirm direction.
🔄 Update:
No ema5 lock above 3393 confirmed the rejection into 3372 followed with ema5 cross and lock opening the full swing range test into 3353. We got the test and the perfect bounce back into 3372. A move into 3393 will complete the full swing range.
We will keep the above in mind when taking buys from dips. Our updated levels and weighted levels will allow us to track the movement down and then catch bounces up.
We will continue to buy dips using our support levels, taking 20 to 40 pips. As stated before, each of our level structures gives 20 to 40 pip bounces, which is enough for a nice entry and exit. If you back-test the levels we shared every week for the past 24 months, you can see how effectively they were used to trade with or against short/mid-term swings and trends.
🌀 The swing ranges give bigger bounces than our weighted levels - that's the difference between the two.
BULLISH TARGET
3440 - DONE
EMA5 CROSS AND LOCK ABOVE 3340 WILL OPEN THE FOLLOWING BULLISH TARGETS
3463
EMA5 CROSS AND LOCK ABOVE 3463 WILL OPEN THE FOLLOWING BULLISH TARGET
3483
EMA5 CROSS AND LOCK ABOVE 3483 WILL OPEN THE FOLLOWING BULLISH TARGET
3508
BEARISH TARGETS
3418 -DONE
EMA5 CROSS AND LOCK BELOW 3418 WILL OPEN THE FOLLOWING BEARISH TARGET
3393 - DONE
EMA5 CROSS AND LOCK BELOW 3393 WILL OPEN THE SWING RANGE
3372 - DONE
3353 - DONE
EMA5 CROSS AND LOCK BELOW 3353 WILL OPEN THE SECONDARY SWING RANGE
3330
3306
As always, we will keep you all updated with regular updates throughout the week and how we manage the active ideas and setups. Thank you all for your likes, comments and follows, we really appreciate it!
Mr Gold
GoldViewFX
The market is closed today. How to arrange gold in the evening?📰 Impact of news:
1. The interest rate remains unchanged and leads to new lows in the short term
2. Geopolitical tensions provide support for risk aversion
📈 Market analysis:
The market is expected to not fluctuate much today. Generally speaking, it is difficult to stand on one foot to form a short-term bottom. There should be a second wave of bottom exploration, a secondary low point, and then the bottom is explored and pulled up to break through the previous high point. Only then can the turning point be officially established and the decline end. Moreover, the 1H moving average is spreading downward. Therefore, in the short term, we still pay attention to the 3375-3385 line of resistance and the 3360-3355 line of support below.
🏅 Trading strategies:
SELL 3375-3385
TP 3365-3360-3355
BUY 3360-3355
TP 3370-3380-3405-3420
If you agree with this view, or have a better idea, please leave a message in the comment area. I look forward to hearing different voices.
TVC:GOLD FXOPEN:XAUUSD FOREXCOM:XAUUSD FX:XAUUSD OANDA:XAUUSD
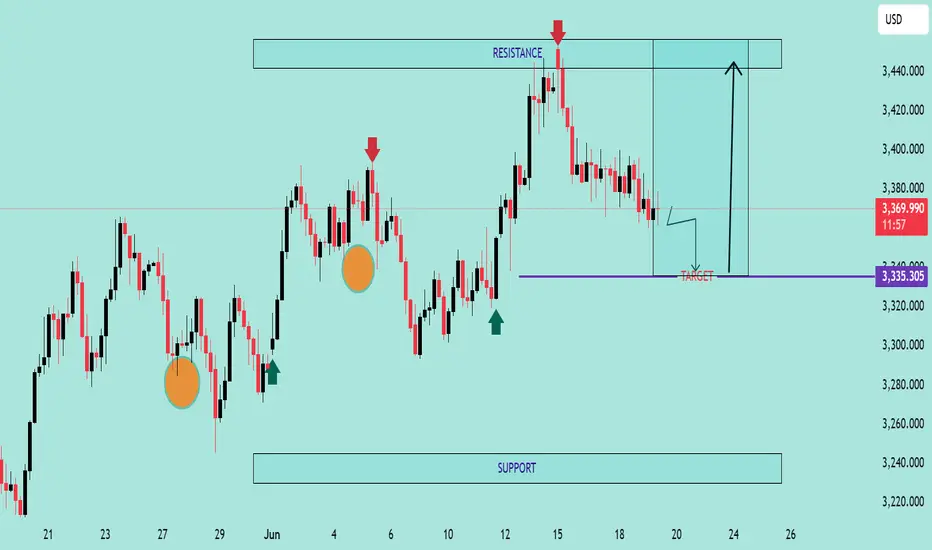
GOLD/USD Support Retest & Breakdown SetupGOLD/USD Support Retest & Breakdown Setup 📉🔍
🔹 Overview:
The chart indicates a potential bearish continuation pattern on GOLD/USD as the price is approaching a key support level at 3,335.305. Previous price action shows multiple rejections from the resistance zone (~3,435), followed by lower highs – a sign of weakening bullish momentum.
📊 Technical Analysis:
🔺 Resistance Zone (~3,435)
Multiple rejections (🔴 red arrows) indicate strong supply pressure.
Price has failed to break above this area thrice, forming a clear ceiling.
🔻 Support Zone (~3,335)
Marked as the target for a short setup.
Price is testing this level again after forming a minor consolidation below lower highs.
A clean break below this purple zone may trigger a continuation to the downside, targeting the broader support range below (~3,240).
🟠 Bearish Structure:
Series of lower highs (highlighted with circles).
Breakdown pattern is developing with declining bullish momentum.
📈 Potential Play:
A confirmed breakdown below 3,335 could lead to a drop toward the next major support.
If support holds, short-term bounce is possible but limited by the dominant resistance.
📌 Conclusion:
GOLD/USD is currently in a bearish setup, with the market eyeing a potential breakdown below a critical support zone. If this level fails to hold, we could see accelerated bearish momentum toward the lower support range.
💡 Caution: Wait for a confirmed close below support before entering any short trades.
The reason why gold was suddenly sold off
💡Message Strategy
Market dehydration news:
1. On Wednesday, the Federal Open Market Committee (FOMC) maintained a stable stance on interest rates, maintaining them in the target range of 4.25% to 4.5%. The Fed expects to implement two rate cuts this year, but policymakers expect inflation to rise. They also lowered their outlook for gross domestic product (GDP).
2. After the Fed's decision was released, the spot gold price fell sharply from the level near $3,396 per ounce; during Powell's speech, the gold price accelerated its decline, once falling to around $3,362 per ounce.
3. Powell said that the current policy stance is ready for flexible response, "At present, we are in a good position to wait for more information about the possible direction of the economy before considering adjusting policies."
4. Powell pointed out that the Fed needs to further understand the current situation before considering adjusting monetary policy. He said that given the continued changes in trade, fiscal and regulatory policies, the Fed needs more time to assess their impact on the economy.
📊Technical aspects
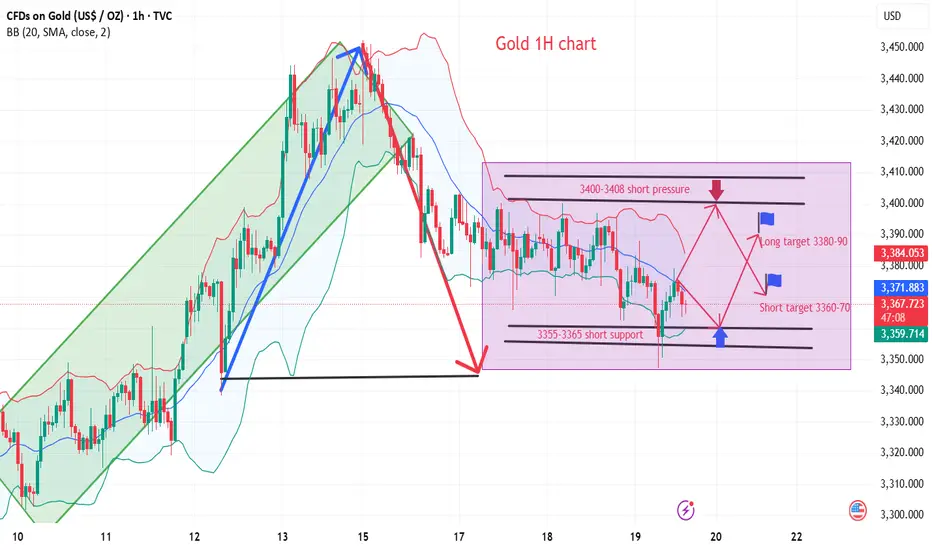
On the 1H chart of gold, gold fell back from a two-month high, hitting a new low in a week, and the short-term trend is biased towards adjustment.
For the upper pressure of gold, pay attention to the intraday high point of gold price rebound at 3380-90 US dollars, which is also near the 5-day moving average of the daily line. Secondly, pay attention to the integer position of 3400 US dollars, which is also the high point of gold price rebound on Wednesday. For further strength, pay attention to the upper track of the daily Bollinger band at 3425 US dollars;
For the lower support of gold, pay attention to the intraday low of 3355-60 US dollars, which is the middle track position of the daily Bollinger band and near the weekly MA5 moving average. The 5-day moving average golden cross turns down, the MACD indicator is close to forming a slight dead cross, the KDJ indicator dead cross slows down, and the RSI indicator dead cross turns up. The short-term technical aspect shows that there is a risk of correction in gold prices.
💰Strategy Package
Short Position:3390-3400,SL:3410,Target: 3370-3360
Long Position:3355-3365,SL:3345,Target: 3380-3390
XAU/USD) Back Bullish trand Read The captionSMC Trading point update
Technical analysis of Gold (XAU/USD) on the 3-hour timeframe based on a price action setup within a rising channel and a key support zone. Here's a breakdown of the analysis:
---
Technical Overview:
Trend Structure:
The price is moving within a rising channel (marked by the black trendlines). Recent touches on both the top and bottom of the channel suggest that it is being respected.
Key Support Zone (Yellow Box):
Price recently tested a strong support zone around $3,338 – $3,350, which aligns with:
Historical price reaction area.
The 200 EMA (blue line).
An uptrend line support.
A bullish reaction (green arrow) confirming demand.
Bear Trap Breakout:
There’s a false breakout below the support followed by a sharp reversal (green arrow), which could indicate a bear trap, often followed by a bullish rally.
Price Projection:
The projected move suggests a bullish rally toward $3,478.89, offering a potential 3.97% gain (~133 points).
The path includes a possible consolidation before a breakout (illustrated by the wavy arrow).
RSI Indicator:
RSI is recovering from the oversold zone (~45), indicating increasing bullish momentum.
Mr SMC Trading point
---
Trade Idea Summary:
Bias: Bullish
Entry Zone: Around $3,350–$3,370 (post-retest of support)
Target: $3,478.89
Confirmation: Bullish price action at support, 200 EMA bounce, RSI reversal
---
Please support boost 🚀 this analysis)

XAU/USD) Back support level Read The captionSMC trading point update
Technical analysis of XAU/USD (Gold Spot vs U.S. Dollar) – 2H Timeframe:
---
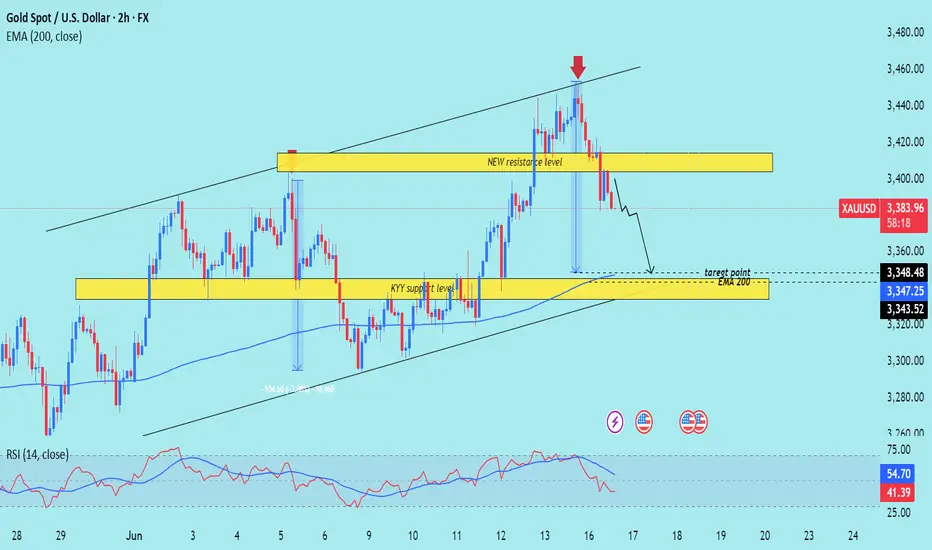
XAU/USD Bearish Rejection from Resistance – Short-Term Sell Setup
Key Observations:
1. Rejection from Upper Channel & Resistance Zone:
Price was rejected sharply after touching the upper boundary of the ascending channel and the newly established resistance zone (~3400–3420).
A strong bearish candle confirms selling pressure at the top.
2. Support Retest in Progress:
The price is currently descending toward the EMA 200 and the KYY support zone (approximately 3343–3348).
The previous bounce originated from this level, making it a significant retest zone.
3. EMA 200 as Confluence:
The 200 EMA (currently at 3346.92) aligns with the support zone, increasing the likelihood of a bounce or at least temporary pause in bearish momentum.
4. RSI Bearish Signal:
RSI has dropped below 50, confirming a momentum shift toward the downside.
Still above oversold territory, suggesting more downside room.
---
Trade Idea:
Bias: Bearish (Short-Term)
Entry Zone: Around 3390–3400 (confirmed rejection area)
Target Zone: 3348 – 3343 (KYY support + EMA 200)
Stop Loss: Above 3425 (just above resistance zone)
Mr SMC Trading point
---
Summary:
Gold has faced a clear rejection at a key resistance zone within an ascending channel, and is now targeting the EMA 200 and previous structural support. Short opportunities could be considered toward the 3343–3348 zone, with RSI and price action supporting the move.
Please support boost 🚀 this analysis)
Accurately grasp the interest rate trend, today's gold layout📰 Impact of news:
1. The interest rate remains unchanged and leads to new lows in the short term
2. Geopolitical tensions provide support for risk aversion
📈 Market analysis:
I told you yesterday that 3363 is not the recent low. Today's lowest point has reached around 3347. The current day's K-line closed with a medium-sized negative line with balanced upper and lower shadows. The shape shows that gold will fluctuate in the short term and be bearish. Therefore, it is not suitable to blindly guess the bottom in the short term. As geopolitical tensions still exist, it is expected that the lowest level may reach 3330. During the day, focus on the upper resistance range of 3380-3390. If the rebound is blocked, try to intervene with short orders. The lower support is at the key level of 3330-3320. Pay attention to the defense of the support area.
🏅 Trading strategies:
BUY 3335-3325
TP 3360-3380-3390-3400
SELL 3375-3385
TP 3365-3355-3345-3300
OANDA:XAUUSD FX:XAUUSD FOREXCOM:XAUUSD FXOPEN:XAUUSD TVC:GOLD
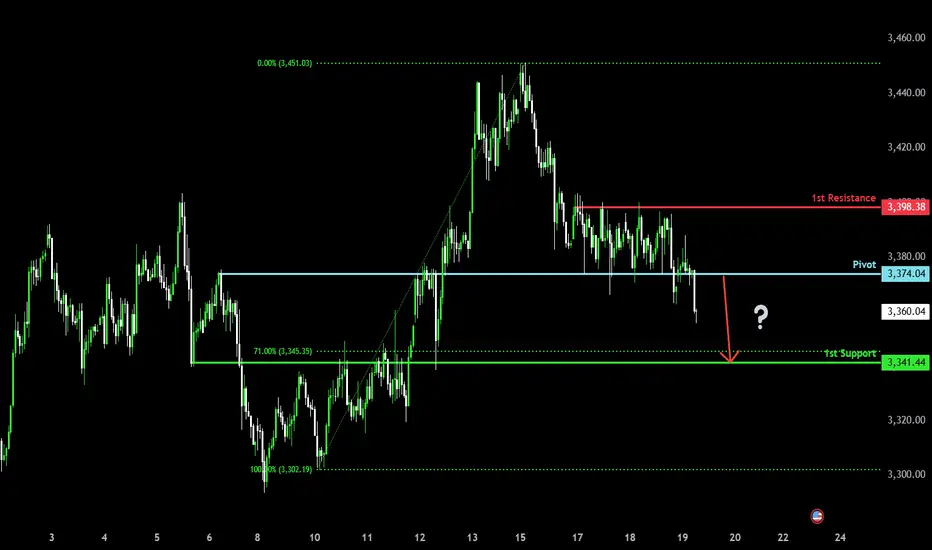
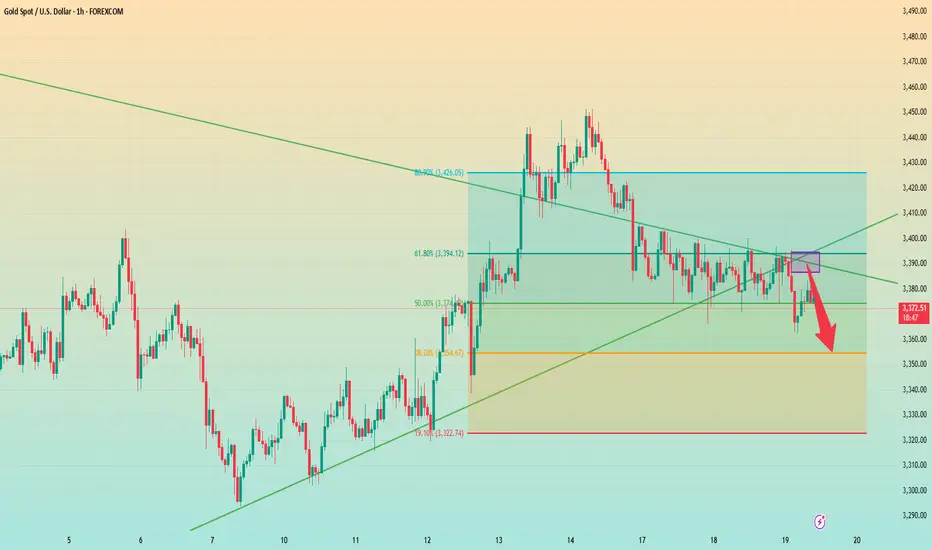
Potential bearish drop off major support?The Gold (XAU/USD0 has broken out of the pivot which acts as an overlap support and could drop to the 1st support which has been identified as an overlap support.
Pivot: 3,374.04
1st Support: 3,341.44
1st Resistance: 3,398.38
Risk Warning:
Trading Forex and CFDs carries a high level of risk to your capital and you should only trade with money you can afford to lose. Trading Forex and CFDs may not be suitable for all investors, so please ensure that you fully understand the risks involved and seek independent advice if necessary.
Disclaimer:
The above opinions given constitute general market commentary, and do not constitute the opinion or advice of IC Markets or any form of personal or investment advice.
Any opinions, news, research, analyses, prices, other information, or links to third-party sites contained on this website are provided on an "as-is" basis, are intended only to be informative, is not an advice nor a recommendation, nor research, or a record of our trading prices, or an offer of, or solicitation for a transaction in any financial instrument and thus should not be treated as such. The information provided does not involve any specific investment objectives, financial situation and needs of any specific person who may receive it. Please be aware, that past performance is not a reliable indicator of future performance and/or results. Past Performance or Forward-looking scenarios based upon the reasonable beliefs of the third-party provider are not a guarantee of future performance. Actual results may differ materially from those anticipated in forward-looking or past performance statements. IC Markets makes no representation or warranty and assumes no liability as to the accuracy or completeness of the information provided, nor any loss arising from any investment based on a recommendation, forecast or any information supplied by any third-party.
Is 2025 the right time to make plans?Market news:
On Thursday (June 19) in the early Asian session, spot gold fluctuated in a narrow range and is currently trading around $3,380/ounce. As an important safe-haven asset in the global financial market, the price fluctuations of international gold are often affected by macroeconomic policies, geopolitical situations and market sentiment. Recently, the gold market has shown a complex and eye-catching trend under the dual influence of the Federal Reserve's interest rate decision and geopolitical tensions in the Middle East.The Federal Reserve decided to keep the benchmark overnight interest rate unchanged at 4.25%-4.50% at its meeting on June 18. This decision was in line with market expectations, but its subsequent statement brought new uncertainty to the London gold price market. This cautious stance weakened the market's expectations for the Federal Reserve's rapid easing, causing gold prices to fall 0.57% on Wednesday to close at $3,369/ounce.The current gold market is in a complex environment with multiple factors intertwined. The Federal Reserve's cautious monetary policy stance and inflation expectations caused by tariffs have brought short-term pressure on gold prices, but geopolitical tensions and signs of economic slowdown have provided potential upward momentum for gold prices. Pay attention to the dynamic changes in the global economy and geopolitics to seize investment opportunities in the gold market.
Technical Review:
Gold fell to the MA10-day moving average of 3662 in the early morning and counterattacked 3380 in the Asian session. The Asian session will continue to look at the rebound strength. The gold price will continue to fluctuate and adjust. The large range is 3408/3343, and the small range is 3390/3360. The daily chart fell back to the 10-day moving average at 3362, and the MA5/7-day moving average was suppressed at 3385/90. The RSI indicator continued to flatten the middle axis. The short-term four-hour chart price is running in the middle and lower tracks of the Bollinger Band!
This week, gold rose sharply to 3450 at the opening, and gradually fell slowly to 3365, with a strength of 100 US dollars. Although the main strength in the first two trading days was a decline, the buying trend remained unchanged. In an uncertain environment, there is still a chance of a big rise in the future. So this week's idea continues to maintain short-term selling and long-term buying.
Today's analysis:
After the Fed's interest rate decision, the Fed kept the interest rate unchanged as expected, which was in line with market expectations. Gold continued to fluctuate and fall in the short term, and there was no obvious upward momentum for buying. Even if it was a risk aversion, it might be careful of the trend of rising and falling. Since gold was under pressure at 3400, it continued to sell at high prices when it rebounded under pressure at 3400 during the day.The gold 1-hour moving average continued to sell downward dead cross patterns, and the gold buying rebound was weak. It was under pressure at 3400 for many times in the past two days and began to fall. The short-term 3400 line of gold has become a strong resistance. If gold buying cannot break through 3400 strongly, then gold buying will be difficult to improve. It is likely that it will still be the main venue for gold selling. Gold rebounded at 3400 during the day and continued to sell at high prices.
Operation ideas:
Short-term gold 3365-3368 buy, stop loss 3356, target 3390-3440;
Short-term gold 3395-3398 sell, stop loss 3407, target 3370-3350;
Key points:
First support level: 3368, second support level: 3354, third support level: 3333
First resistance level: 3396, second resistance level: 3408, third resistance level: 3420
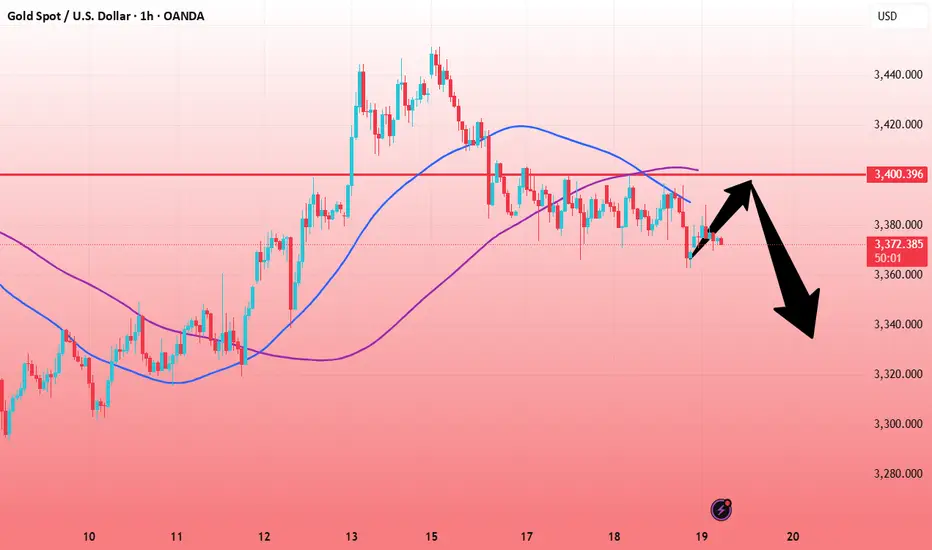
GOLD H1 Intraday Chart Update For 19 June 2025Hello Traders,
For today market still stuck in between 3350 to 3400 Psychological levels we still need to wait for clear breakout of 3400 level
Today scalping range is 3360-90 but remember must placing SL
if market goes below 3350 clearly then it will move towards 3321 Major Support level
Reminder: There is Bank Holiday in US
Disclaimer: Forex is Risky
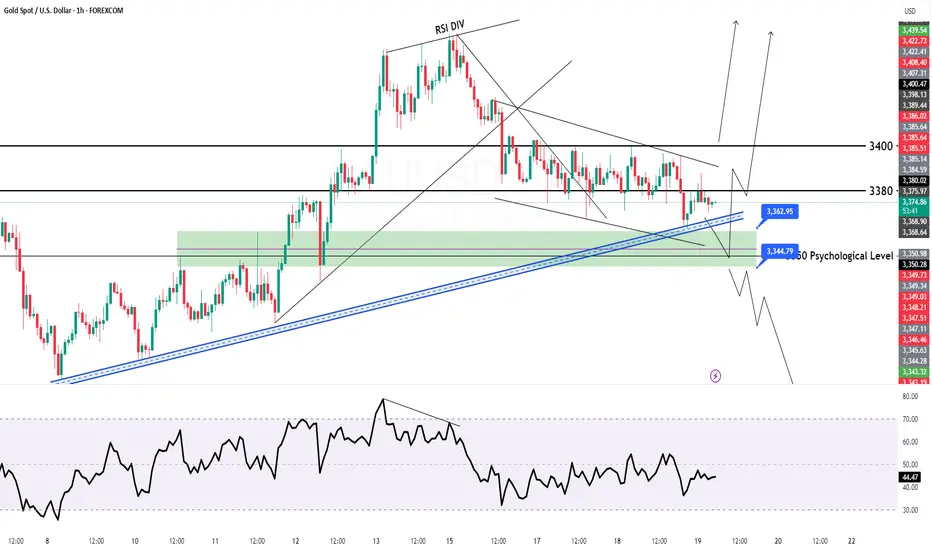
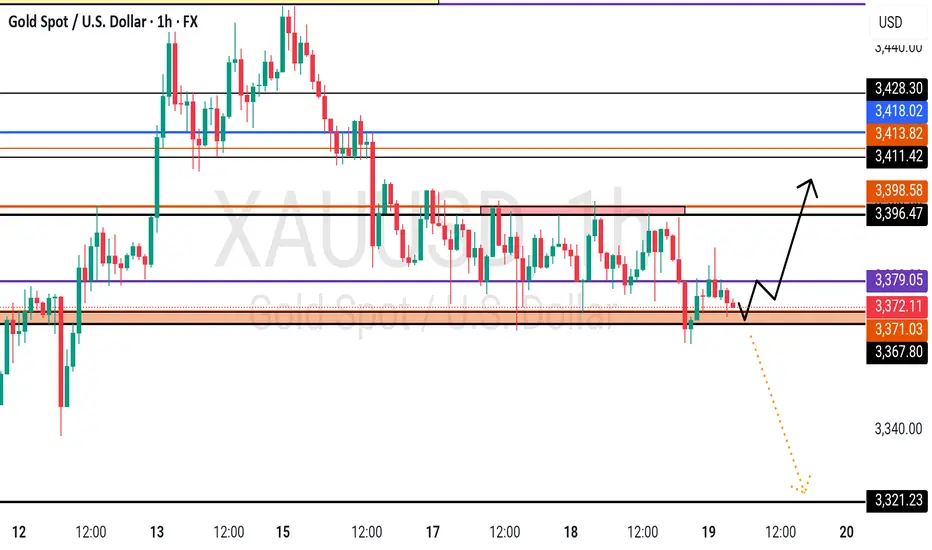
XAU/USD 4H Market Analysis- 19 June 2025XAU/USD 4H Market Analysis
Market Structure: Gold has been in a mild uptrend on the 4‑hour chart, making higher lows and highs since early June. The recent swing high was around ~$3,428 (mid-June), and price has pulled back toward the rising support line near ~$3,373.
A break above the recent high (around $3,404–$3,428) would continue the bull trend; conversely, a drop below the ~3,373 trendline/50% Fib level would signal a bearish turn.
In other words, bulls remain in control as long as ~$3,373 holds – breaking that would threaten lower support around ~$3,338.
Overall Bias: Moderately bullish on 4H. Gold is respecting its rising trendline and 50-period EMA, and analysts note that holding above ~$3,373 keeps the uptrend intact.
Momentum (MACD) is neutral to slightly bearish short-term, so we expect consolidations and range bounces more than a reversal.
In summary, assume an upward bias while price stays above key support near $3,370–$3,380; a firm break below would flip bearish.
Key SMC/Zones:
Price is currently in a range/consolidation roughly between $3,370 and $3,400.
Important zones include:
Demand (Support) Zone:
~ $3,368–$3,378 — this 50% Fib retracement area has been defended as a bullish order block.
Below that, stronger supports sit near ~ $3,354 and $3,333 .
Supply (Resistance) Zone:
~$3,395–$3,415 — a cluster of swing highs and Fib levels. Analysts highlight $3,395, $3,412, $3,435 and even $3,450 as major resistance barriers.
In particular, the $3,400 level is a known psychological and technical ceiling.
Trendlines/BOS: The rising 4H trendline (currently near $3,370–$3,380) is key support.
A break of structure (BOS) below that line would be a bearish Change-of-Character. Similarly, the prior swing low around $3,373 is a flip zone – bulls want to keep that hold.
Liquidity: Stop-loss/liquidation clusters may lie just above recent highs ($3,428–$3,450) and just below recent lows ($3,338–$3,354). For example, stops above $3,428 could fuel a rally if hit, and stops below $3,338 could accelerate a drop.
In short, high-probability zones on the 4H chart are around ~$3,370 (demand/support) and ~$3,400 (supply/resistance).
We’ll look for trades that align with that structure (see setups below).
1H Trade Setups (Aligned with 4H Bias)
Long around $3,370–3,375 (Buy Dip to Demand Zone) –
Entry: ~3,370–3,375 (green zone). Stop: ~$3,365 (≈$5 below zone). Take-Profit: $3,380 first, then $3,390–$3,400.
Reason: This zone is a 4H demand area (50% Fib + order block) and coincides with the rising 4H trendline.
Price has repeatedly bounced here, so a bullish reversal is likely.
Trigger: Look for a bullish 1H signal (e.g. engulfing or pin bar) at ~3,370–3,375, or a break of the short-term 1H down-structure.
Entry on such a signal would target a retest of the mid-range (~3,380) and beyond toward resistance.
Short around $3,395–3,400 (Sell Rally to Supply) –
Entry: ~3,395–3,400 (red zone). Stop: ~$3,405 (≈$5 above zone). Take-Profit: $3,375 first, then $3,365.
Reason: This area is a clear 4H supply zone (near multiple Fibonacci levels/resistance).
It’s just below the $3,400 psychological barrier. A failure or bearish reversal here would likely send price back toward the demand zone below.
Trigger: Watch for a bearish 1H candle or a break of the short-term 1H up-structure in the 3,395–3,400 range. A clear rejection (e.g. bearish engulfing or strong wick) would be the signal to enter short.
(Note: If price breaks cleanly above $3,405–3,410 instead, a bullish continuation trade would then be favored, targeting $3,415+.)
Takeaway: Trade gold with the 4H structure in mind. With price above the ~$3,370 trend support, favor longs on pullbacks into that demand zone and shorts only at proven supply near $3,400. Always use a tight ~$5 stop beyond each zone and scale out at logical pivot levels to manage risk.
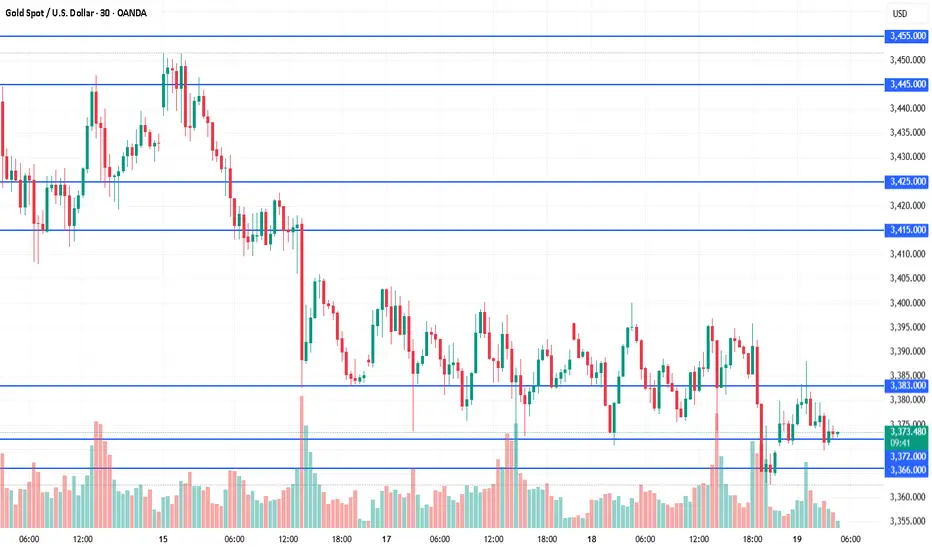
Data is stable. Will the price go down?Information summary:
The Fed kept the benchmark interest rate unchanged at 4.25%-4.50%, and did not make a rate cut decision for four consecutive meetings, which was in line with market expectations. The Fed said that uncertainty about the outlook has eased, but it is still at a high level. The Fed lowered its GDP forecast for 2025 to 1.4%, while raising its inflation forecast to 3%.
The Fed kept interest rates unchanged, which may suggest that the pace of future rate cuts will slow down.
Market analysis:
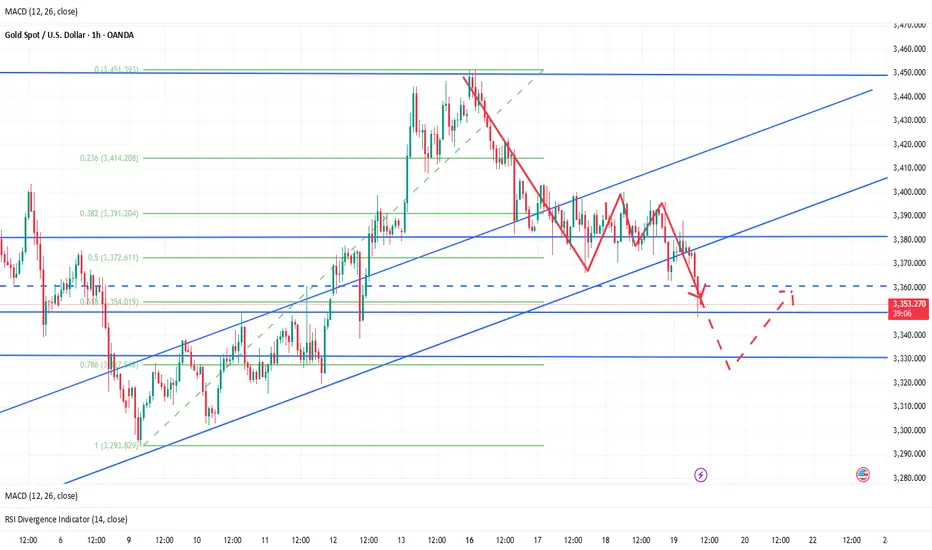
From the current 4-hour chart:
The price has fallen below the key support level of 3380. If it returns to below 3370 again, it is very likely to reach today's low. The low point of the downward trend is at the extreme position of 3350-3330.
From the hourly chart, the downward range has also been broken. The early rebound in the Asian market also failed to stabilize above the support level. Then from the hourly Fibonacci, the 0.382 position below is around 3350.
Therefore, if it goes down, the first target is also around 3350.
Operation strategy:
Short around 3380, stop loss at 3390, profit range 3350-3330.
GOLD - At CUT n REVERSE Region? Holds or not??#GOLD .. perfect move as per our analysis and now market just at his CUT N REVERSE region, that is around 3367-68 to 3370-71
Keep close that region because that is our ultimate region of the week and month.
Only holdings of that region means you can see again bounce for now otherwise not.
NOTE: we will go for cut n reverse below that region on confirmation.
Good luck
Trade wisely
How to trade the Fed's interest rate decision!In nearly an hour, the Fed will announce the Fed's interest rate decision and a summary of economic expectations;
In nearly an hour and a half, Powell will hold a monetary policy press conference.
If the Fed's policy statement or the latest forecast shows a dovish tendency, it may resume the downward trend of the US dollar, thereby supporting the upward trend of gold; and the recent mild inflation and weak employment data in the United States may prompt the Fed to soften its previous assessment, thereby strengthening expectations of interest rate cuts and providing support for gold prices.
From the current technical structure, gold maintains a volatile and anxious market during the day, and there is no clear direction in the short term, but gold is currently always below 3400, and the overall market is still in a weak trend; but gold has repeatedly touched the 3375-3365 area and can quickly recover, proving that there is still strong buying support below; in fact, it stands to reason that if gold is really weak, it should have continued to fall and touched the 3360-3350 area, but gold did not touch the area as expected, but used sideways trading to exchange time and space, and there was no sign of any downward breakthrough, so gold is likely to choose an upward direction.
In addition, the Middle East geopolitical crisis, global economic uncertainty, intensified trade frictions and rising inflation expectations will all provide structural support for gold. So if gold does not fall below the 3365-3355 area today, we will be bullish on gold first; but if gold cannot break through the 3410-3420 area in one fell swoop during the rise, then we need to be careful of the trend of gold rising and then falling.
As for how to trade the news next: the Federal Reserve interest rate decision. The above are my trading ideas and opinions, you can read them carefully and use them as a reference! If you still want to trade news after careful consideration, please be sure to set SL during the transaction to protect your account to the greatest extent!

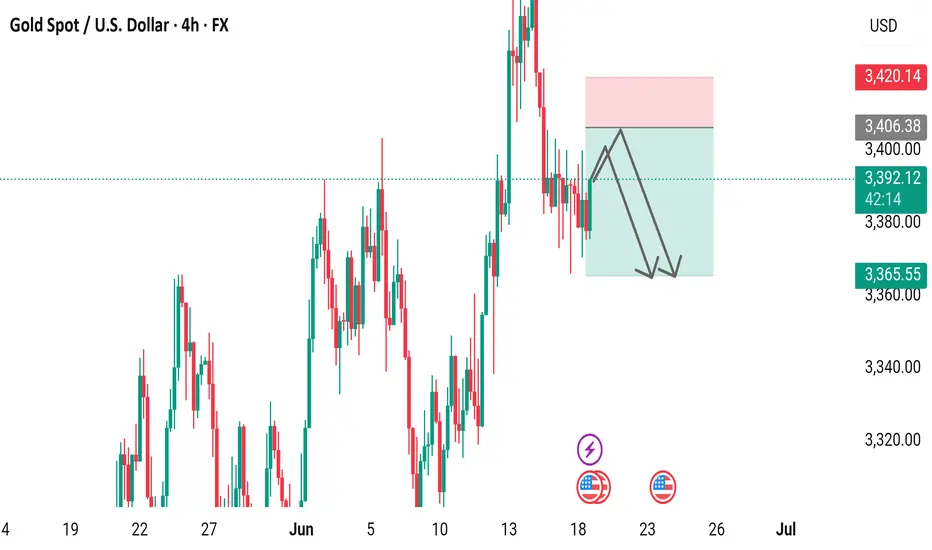
Gold Spot / U.S. Dollar (XAU/USD) 4-Hour Chart4-hour candlestick chart displays the price movement of Gold Spot (XAU) against the U.S. Dollar (USD) from June 4 to June 18, 2025. The current price is 3,391.79, reflecting a +3.61 (+0.11%) change. The chart highlights a recent upward trend with a notable peak, followed by a slight pullback. Key price levels are marked, ranging from 3,320.00 to 3,420.14, with technical analysis indicators such as a resistance zone (pink) and a support zone (light green) overlaid.
Thoughts before the Golden Decision
💡Message Strategy
Gold prices continued to fluctuate at high levels this week, lacking a clear direction. The Federal Reserve is about to announce its June interest rate decision. Although the market generally expects that the interest rate will remain unchanged this time, the key focus lies in the update of the dot plot and Powell's wording in the press conference. The market is currently betting that a rate cut cycle may begin in September, mainly based on a series of weak US economic data released recently. US retail sales fell 0.9% month-on-month in May, significantly lower than the market's expectation of -0.7%, while industrial output also unexpectedly shrank by 0.2%, indicating that the US economic momentum has slowed down.
At the same time, the US CPI data in May cooled down across the board, with both the annual rate and the core annual rate lower than expected, which further strengthened the market's expectations for a rate cut in September. Against this background, the US dollar fell from its high on Tuesday, boosting the short-term decline in gold prices.
In terms of geopolitical situation, according to Reuters, the six-day conflict between Israel and Iran showed no signs of cooling down. US President Trump publicly put pressure on Iran and released remarks that he would impose tariffs on the pharmaceutical industry. Coupled with the uncertainty of the trade outlook, the market's risk aversion sentiment has been strengthened, which will help gold maintain a high level.
📊Technical aspects
From the daily chart, the gold price has been running between the middle and upper tracks of the Bollinger Bands since late May. The Bollinger Bands have gradually converged, suggesting that volatility has decreased and the market is on the eve of a change.
The current gold price is hovering between the middle track of the Bollinger Bands at $3,322.96 and the upper track at $3,446.14, in a typical oscillating pattern.
In terms of MACD indicators, the current bar chart is close to the zero axis, and the DIFF line and the DEA line are in a state of convergence, and no effective golden cross or dead cross is formed, reflecting that the current situation is a typical consolidation market. RSI remains near 56, indicating that the market is not obviously overbought or oversold, and the short-term momentum is neutral.
Based on the above judgment and analysis, it is believed that gold is currently at a critical node. If it breaks through the 3400-line resistance band and is accompanied by a large volume, it will be expected to challenge the high of $3450. On the contrary, if it falls below the $3360 support, it may trigger a short-term adjustment, with the target pointing to the lower track of the Bollinger band at $3200.
At present, the overall adjustment of gold is supported by the expectation of the Fed's interest rate cut, and the bulls are relatively strong. Long positions are deployed before the decision.
💰 Strategy Package
Long Position:3380-3385,SL:3370
First target: 3400, second target: 3450

GOLD ROUTE MAP UPDATEHey Everyone,
A PIPTASTIC day on the markets with our chart idea playing out perfectly!!!
Yesterdays update, we stated how we hit our Bullish target, followed with no cross and lock confirming the rejection. We then stated, how we tracked the movement down with ema5 lock confirmation into the swing range and ended with waiting for the full swing to complete into 3393.
🔄 Update:
Today we got the move into 3393 just like we analysed. We continued to see play between 3372 and 3393, giving multiple opportunities to catch bounces from the dip. We will now look for ema5 to cross and lock 3372 or 3393 to confirm direction.
We will see levels tested side by side until one of the weighted levels break and lock to confirm direction for the next range
We will keep the above in mind when taking buys from dips. Our updated levels and weighted levels will allow us to track the movement down and then catch bounces up.
We will continue to buy dips using our support levels, taking 20 to 40 pips. As stated before, each of our level structures gives 20 to 40 pip bounces, which is enough for a nice entry and exit. If you back-test the levels we shared every week for the past 24 months, you can see how effectively they were used to trade with or against short/mid-term swings and trends.
🌀 The swing ranges give bigger bounces than our weighted levels - that's the difference between the two.
BULLISH TARGET
3440 - DONE
EMA5 CROSS AND LOCK ABOVE 3340 WILL OPEN THE FOLLOWING BULLISH TARGETS
3463
EMA5 CROSS AND LOCK ABOVE 3463 WILL OPEN THE FOLLOWING BULLISH TARGET
3483
EMA5 CROSS AND LOCK ABOVE 3483 WILL OPEN THE FOLLOWING BULLISH TARGET
3508
BEARISH TARGETS
3418 -DONE
EMA5 CROSS AND LOCK BELOW 3418 WILL OPEN THE FOLLOWING BEARISH TARGET
3393 - DONE
EMA5 CROSS AND LOCK BELOW 3393 WILL OPEN THE SWING RANGE
3372 - DONE
3353
EMA5 CROSS AND LOCK BELOW 3353 WILL OPEN THE SECONDARY SWING RANGE
3330
3306
As always, we will keep you all updated with regular updates throughout the week and how we manage the active ideas and setups. Thank you all for your likes, comments and follows, we really appreciate it!
Mr Gold
GoldViewFX