Gold-----sell near 3393, target 3380-3366Gold market analysis:
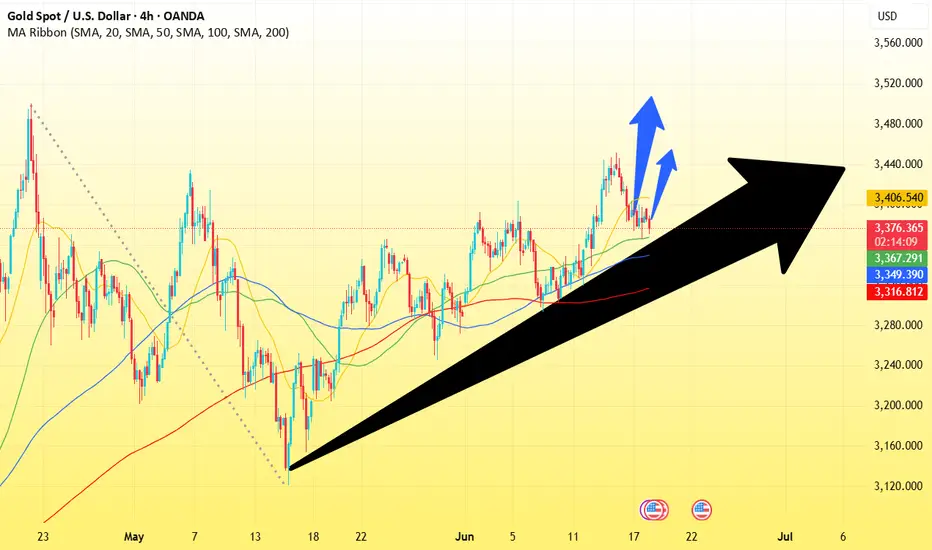
Yesterday, gold was basically a repeated shock, the K line was repaired at one position, and buying and selling were back and forth around the M side of the suppression platform 3405. Yesterday, our analysis was completely in line with our expectations. Yesterday, we also repeatedly arranged 5 sell orders, arranging 3382 break sell, 3387 sell, 3393 sell, 3382 sell, 3377 sell. Today's idea is to continue selling. The daily line cannot determine the bottom of this wave of decline. There are data in European and American time today. I think we can rely on the 3405 platform to be bearish before the data. If 3405 breaks, we adjust our thinking to be bullish. Otherwise, we can sell repeatedly. Gold is oscillating in the short term. Try not to chase it and wait for it to rebound and suppress the position to sell. In addition, the daily moving average suppression position of the moving average is 3396-3363, which is also the main reason for its repeated game at this position. The weekly buying momentum is not dead yet. Be cautious of its rocket in the second half of the week.
In today's Asian session, we will first focus on the suppression of 3395. The risk of taking more is relatively large. The low point below is not stable. The Asian session fell to 3370 and rebounded quickly. From the perspective of the pattern, 3372-3366 is the support. The suppression position of the 1H hourly moving average is near 3395. Yesterday's US session rebounded at around 3396, and the hourly K suppression position was 3400. All the above are suppressed. In addition, the opening position today is also near 3393.
Pressure 3393, 3400, 3405, support 3382, 3370, and the watershed of strength and weakness in the market is 3382.
Fundamental analysis:
In the previous fundamentals, we have been paying attention to geopolitical factors. The situation in the Middle East has indeed changed the way gold and crude oil are traded. Today we focus on the monetary policy of the Federal Reserve, and there is also a speech by Chairman Powell during the US session.
Operation suggestions:
Gold-----sell near 3393, target 3380-3366
Goldprediction
Today, the Federal Reserve is the key to breaking the deadlock!
📌 Core driving events
Yesterday, as the market believed that the possibility of direct U.S. involvement in the conflict had increased, tensions intensified again, and the market was once worried about possible attacks during the Asian session. Although it did not happen in the end, it is said that the next 24 to 48 hours will be a critical period. This wave of tension triggered widespread "risk aversion" operations in the market, but interestingly, gold did not react strongly. The market remained cautious before the Fed's interest rate decision was released, and the slight increase in risk appetite in the stock market also put pressure on gold prices.
📊Comment analysis
At present, the technical side of gold has been showing a bearish trend, but as of now, the market has not fallen below yesterday's closing low of 3364, and the upper side has been under pressure from the resistance of 3405. Long and short positions are wandering in this range, and the breakthrough market will either break through at the end of the day, and the current trend uses sideways trading to exchange time and space, and has not fallen below the support below, so there is a high probability that it will go up.
In the current tense market, it is more necessary to open a position near the high and low points to make a better game. At the same time, from historical experience, the impact of the Middle East geopolitical crisis on gold has three stages and has entered the second stage. The uncertainty of the global economy, the intensification of trade frictions and the rise in inflation expectations may provide structural support for gold. Therefore, if it does not break near 3364 today, it will be bullish first!
💰Strategy Package
Gold: More near 3368-70, defend the 3364 line, and look up to the 3397-3405 line. If it breaks 3405 upward, it will further impact 3422 and even the previous high, but if it breaks below 3364, the long single position will be adjusted out and it will no longer be bullish for the time being!
⭐️ Note: Labaron hopes that traders can properly manage their funds
- Choose the number of lots that matches your funds

The interest rate remains volatile,and the gold operation layout📰 Impact of news:
1. Initial jobless claims data
2. US-Iran conflict continues
3. Pay attention to the Fed's decision
📈 Market analysis:
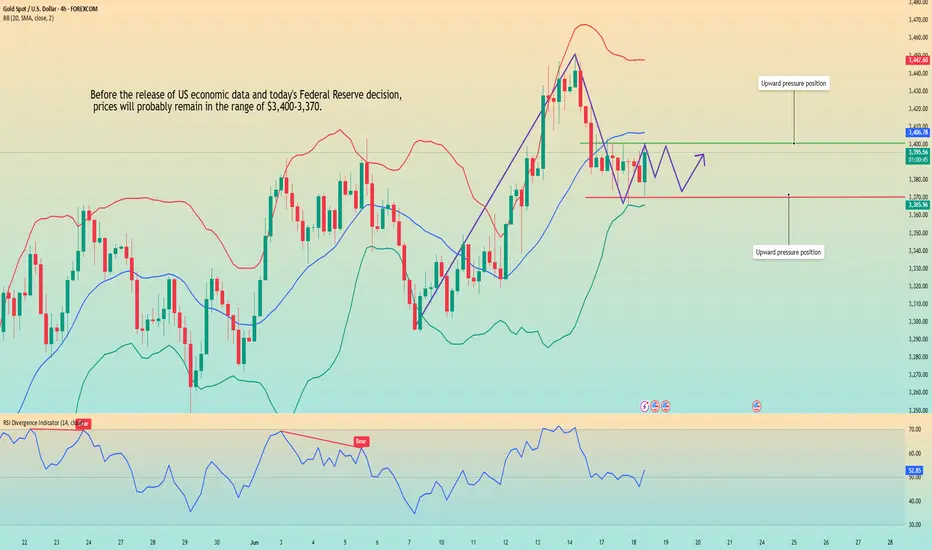
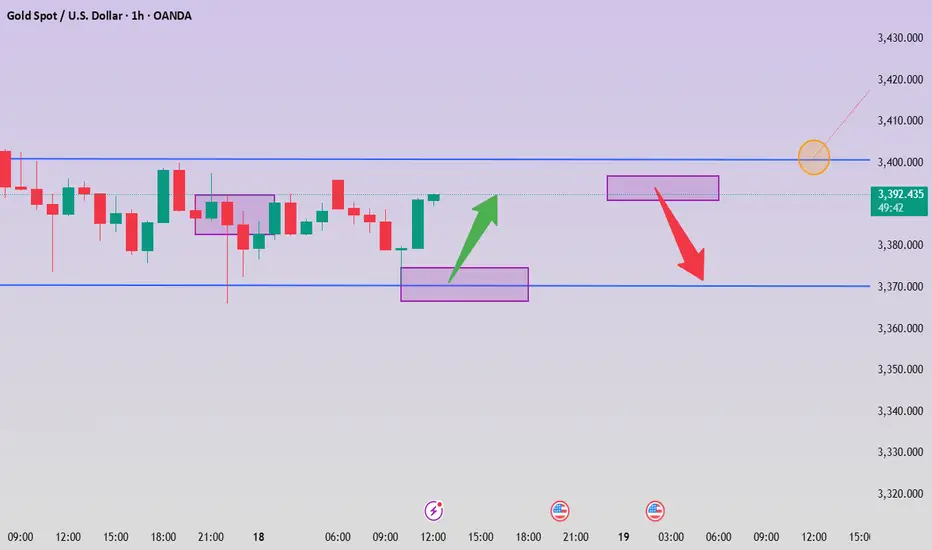
Gold has been trading sideways recently. It is expected that there will not be much fluctuation before today's Fed interest rate information and Powell's speech. It is expected to continue to fluctuate in the range of 3405-3365. At the same time, the escalation of geopolitical conflicts in the short term is also a point we need to pay attention to.
🏅 Trading strategies:
BUY 3380-3375-3365-3355
TP 3395-3400-3405
SELL 3405-3395
TP 3380-3375-3360
If you agree with this view, or have a better idea, please leave a message in the comment area. I look forward to hearing different voices.
TVC:GOLD FXOPEN:XAUUSD FOREXCOM:XAUUSD FX:XAUUSD OANDA:XAUUSD

Interest rate decision bearish
Today, the focus is on the Fed's latest interest rate decision, which will be announced on Wednesday. The market generally expects that it will maintain the policy rate range of 4.25%-4.50%. Trump recently asked the Fed to cut interest rates by one percentage point immediately, but the market reacted cautiously, believing that a sharp rate cut may increase inflation risks, especially in the context of Middle East conflicts pushing up oil prices. Fed Chairman Powell's statement at the press conference will become the focus of market attention. The market expects the Fed to maintain a cautious and patient tone, and the guidance on the interest rate outlook may be vague.
Technically, in terms of support, the 10-day moving average and the 20-day moving average form important support near 3464/3463 and 3445 respectively. In terms of resistance, yesterday's high near 3403 constitutes a key resistance above. If gold prices want to reverse the current weak pattern, they need to successfully break through this resistance level to open up upward space.
Today's detailed operation strategy
Short gold rebounds near 3400, defense 3410, target 3380-3364
Long gold falls back near 3364, defense 3356, target 3380-3400

Wide range fluctuations continue, the latest layout of gold📰 Impact of news:
1. Initial jobless claims data
2. US-Iran conflict continues
3. Pay attention to the Fed's decision
📈 Market analysis:
At present, the gold price is testing the 3380 line again, and the strong support below is 3365-3355. As long as it does not fall below this key support, the bulls will remain strong. At the same time, the two key points of 3405 and 3420 above are still short-term resistance. Breaking through may directly test 3450. In the short term, gold fluctuates repeatedly at the 3405-3365 level, temporarily maintaining a high-altitude low-multiple cycle. There is also initial jobless claims data released today. At the same time, the geopolitical situation in the short term is severe, so we need to be cautious. In addition, the New York Stock Exchange will be closed tomorrow. The focus this week is mainly on Friday, especially when it is superimposed with the Fed's interest rate decision, we need to be vigilant about the transmission effect of sudden changes in liquidity on the market.
🏅 Trading strategies:
BUY 3380-3365-3355
TP 33395-3400-3405
SELL 3405-3390
TP 3380-3360
If you agree with this view, or have a better idea, please leave a message in the comment area. I look forward to hearing different voices.
OANDA:XAUUSD FX:XAUUSD FOREXCOM:XAUUSD FXOPEN:XAUUSD TVC:GOLD

XAU/USD(20250618) Today's AnalysisMarket news:
World Gold Council: 95% of central banks expect gold reserves to rise in the next 12 months.
Technical analysis:
Today's buying and selling boundaries:
3385
Support and resistance levels:
3422
3408
3400
3371
3362
3349
Trading strategy:
If the price breaks through 3400, consider buying, the first target price is 3408
If the price breaks through 3385, consider selling, the first target price is 3360
Golden investment opportunity emerges!Market news:
In the early Asian session on Wednesday (June 18), spot gold fluctuated in a narrow range and is currently trading around $3,380 per ounce. As the "safe haven king" in the global financial market, international gold has shown resilience in bottoming out and rebounding under the dual drive of recent geopolitical and economic uncertainties. The rise in London gold prices is inseparable from the fueling of tensions in the Middle East. The conflict between Iran and Israel has entered its fifth day, and geopolitical risks continue to heat up, injecting strong momentum into safe-haven assets.Although geopolitical risks have pushed up the safe-haven demand for gold, the strong performance of the US dollar has significantly suppressed gold prices. Against the backdrop of escalating conflicts in the Middle East, the dollar's renewed support and the Federal Reserve's cautious attitude have become important factors limiting the upward trend of international gold prices. Investors need to pay close attention to the Fed's policy guidance, the trend of the US dollar and the latest developments in the Middle East. In addition, the initial value of the annualized total number of US building permits in May and the annualized total number of US new home starts in May will also be released on this trading day, and investors also need to pay attention.
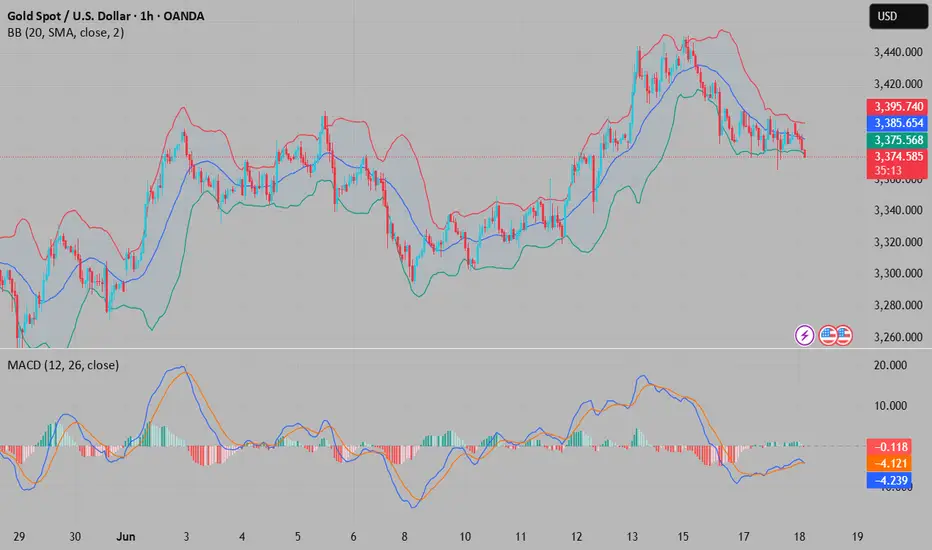
Technical Review:
Gold bottomed out and rebounded, and adjusted widely and fluctuated fiercely. The daily chart closed with a positive cross line, and the RSI indicator's central axis 50 value flattened. The price dropped to the MA10 daily average line of 3366 and rebounded sharply, reaching 3396 in the Asian session. The short-term four-hour chart moving average is glued together, and the RSI indicator's central axis is adjusted. The hourly chart Bollinger Bands are closed, and the moving averages are glued together. Technically, gold maintains a wide range of fluctuations and short-term participation.The intraday trend and the weekly chart's high point gradually move downward, which shows that the control of selling in the market is gradually increasing. Although the gold price failed to continue the buying trend at the beginning of the week, it does not mean that buying is completely dominant, especially before the announcement of the Federal Reserve's interest rate decision on Thursday this week, the market still has strong uncertainty about the future trend!
Today's analysis:
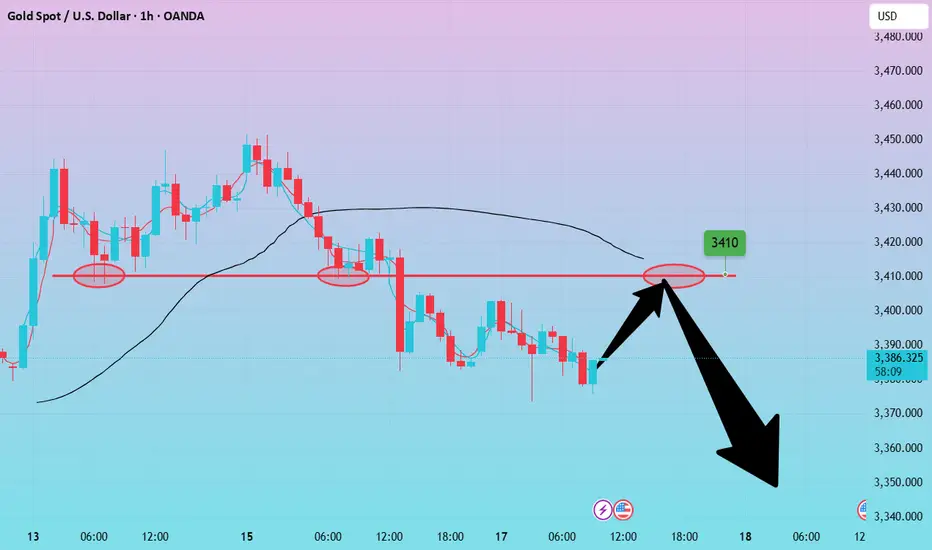
After gold bottomed out, it began to fluctuate again, but the overall trend is still selling. The gold rebound is still under pressure at 3400 and began to fall back. In the short term, gold 3400 is still an important resistance. Gold continues to sell at high prices before it effectively breaks through 3400. Today’s market is once again blocked when it hits a high point. The current intraday high is around 3396. The market has been operating under the pressure of 3400 in the past two days, and there is no sign of the market standing above 3400. Therefore, the 3400 barrier is still an effective pressure point. As long as it does not break through and stabilize at 3400 today, the rebound is an opportunity for us to sell!
Operation ideas:
Short-term gold 3365-3370 buy, stop loss 3356, target 3390-3440;
Short-term gold 3390-3400 sell, stop loss 3408, target 3370-3350;
Key points:
First support level: 3363, second support level: 3346, third support level: 3333
First resistance level: 3400, second resistance level: 3408, third resistance level: 3420
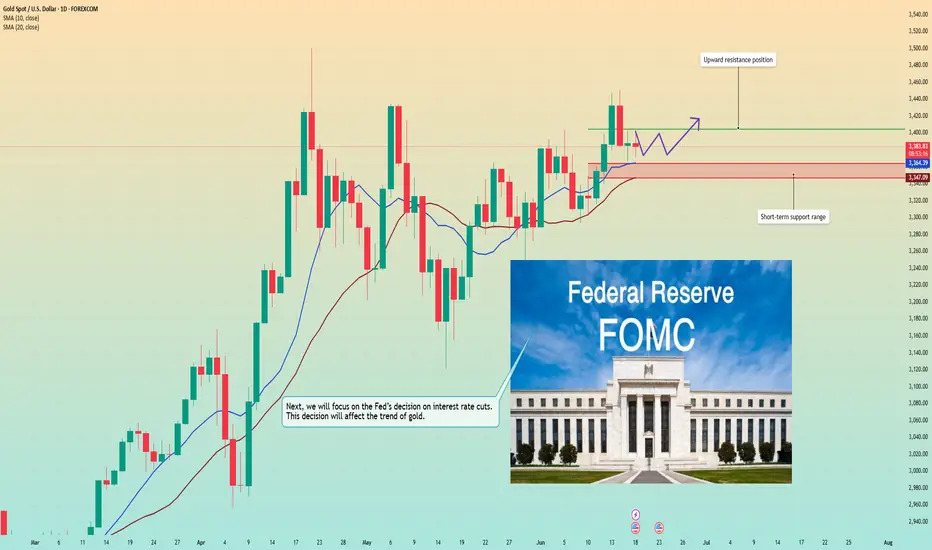
Data is about to be released. Will it affect the trend of gold?Information summary:
The Federal Reserve is about to announce the latest interest rate decision, and the market generally expects it to maintain the policy interest rate range of 4.25%-4.50% unchanged. Trump recently asked the Federal Reserve to cut interest rates by one percentage point immediately. However, the market reacted cautiously to this, believing that a sharp interest rate cut may increase inflation risks, especially in the context of Middle East conflicts pushing up oil prices.
Fed Chairman Powell's statement at the press conference will become the focus of market attention. The market expects the Fed to maintain a "cautious and patient" tone, and the guidance on the interest rate outlook may be vague.
Market analysis:
Technical indicators, from the daily chart, the support level is near the 10-day moving average and the 20-day moving average, and the 3365-3345 range forms an important support. In terms of resistance, yesterday's high near 3405 constitutes a key resistance above. If the price wants to reverse the current weak pattern, it needs to break through this resistance level strongly to open up the upward space.
From the 1-hour chart, the price started to fall after reaching a high point, and maintained stability in the upper and lower ranges; it is now close to the low point in the early trading, and the trend is relatively slow.
In the absence of an upward or downward breakthrough, we still follow the strategy of selling high and buying low.
Short around 3400, stop loss 3410, profit range 3380-3365;
Long around 3365 when the price falls back, stop loss 3355, profit range 3380-3400.
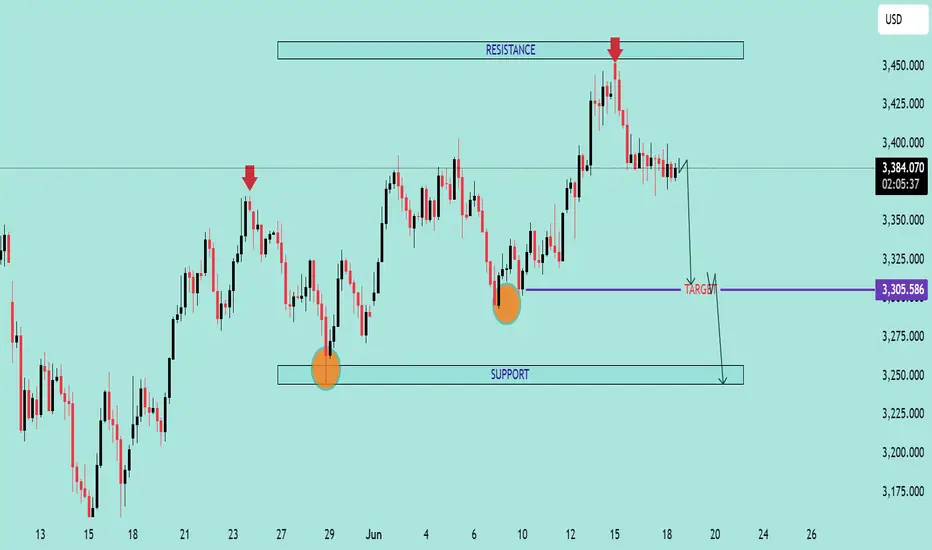
GOLD/USD Bearish Rejection at ResistanceGOLD/USD Bearish Rejection at Resistance 📉🟥
🔍 Technical Analysis Overview:
The GOLD/USD chart shows a clear bearish rejection pattern forming near the resistance zone around $3,450, marked with red arrows. After price tested this level twice, strong selling pressure appeared, resulting in a sharp decline.
📌 Key Observations:
🔴 Resistance Zone:
Price was rejected from the resistance area around $3,450 twice, indicating strong seller presence.
Double top-like behavior seen with lower highs confirming weakening bullish momentum.
🟠 Support Zone:
A well-respected support level near $3,250 has been identified based on past reaction (highlighted with orange circles).
Price previously bounced twice from this zone, validating it as a strong support level.
🎯 Target Level:
A near-term target of $3,305.586 is marked, which aligns with previous reaction zones and short-term structure support.
If momentum continues, a deeper push toward $3,250 support is probable.
📉 Bearish Bias Justified By:
Clear rejection from resistance
Lower high formation
Current consolidation with downward bias
Possible breakout to downside if $3,305 fails to hold
⚠️ Risk Note:
If price retraces and breaks back above $3,400 with volume, the bearish setup will be invalidated.
📊 Conclusion:
The chart favors bearish continuation with a primary target around $3,305, and extended downside to $3,250 if bearish pressure sustains. Traders should watch for bearish confirmation patterns below current price before engaging.
🔽 Resistance: $3,450
🔼 Support: $3,250
🎯 Target: $3,305
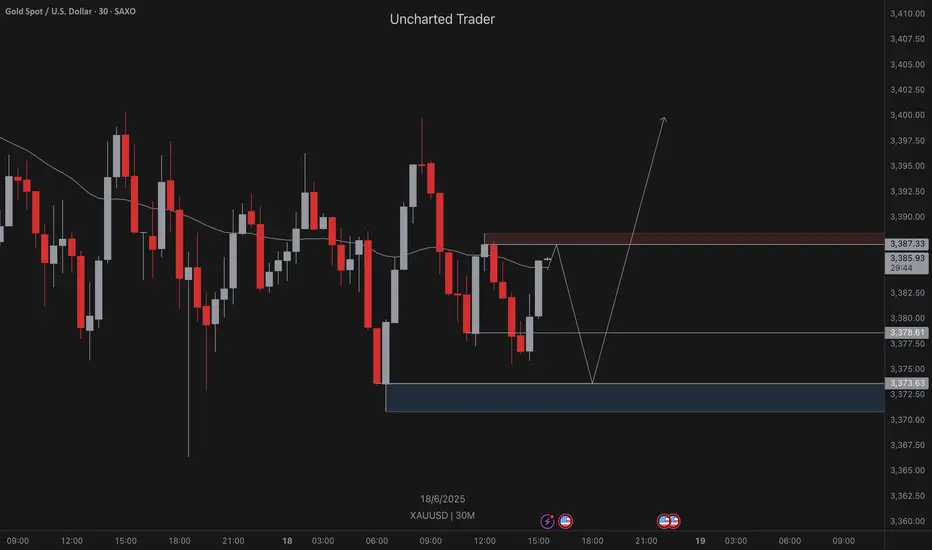
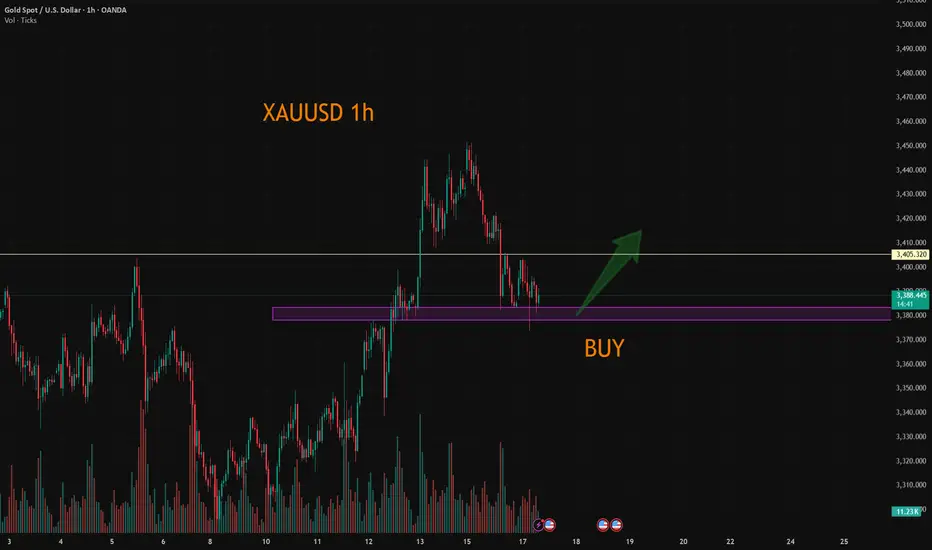
XAUUSD Consolidation Idea As we can see that Gold is on consolidation phase but we can still use the given support and resistance to our advantage
Although further confirmation will be needed in order get into sells or buys
Seize the opportunity to short gold after the reboundBecause gold fell back to the expected support area of 3375-3365 first, I just took the opportunity to go long on gold near 3372 and set TP: 3390. Obviously, our long position ended the transaction by hitting TP, and we made a profit of 180pips.
At present, gold continues to rebound to around 3396, and is facing the short-term resistance area of 3395-3405, and the upside may be limited. And I think before the Fed's interest rate decision and Powell's monetary policy conference, gold is likely to maintain a range of fluctuations, and the willingness of both long and short parties to break through may not be strong in the short term. And from the current structure, gold tends to fluctuate downward as a whole.
So for short-term trading, we might as well try to short gold in the resistance area. I think it is still very likely to retreat to at least the 3385-3380 area.
XAUUSD:A long trading strategy
Yesterday was affected by the easing signal gold high continued to correction, fell back to 3400 again, the trend exceeded personal expectations. Gold received another boost after the president's news, and rebounded slightly in the Asian session. In this eventful autumn, the market is subject to frequent news factors, the trend is slightly turbulent, to be ready to sweep back and forward.
Today's overall volatility is expected to have a contraction, individual expectations of the final close of the small negative line is more likely
Trading Strategy:
BUY@3380-85
TP:3404-3410
↓↓↓ More detailed strategies and trading will be notified here ↗↗↗
↓↓↓ Keep updated, come to "get" ↗↗↗
GOLD(XAUUSD) UPDATEKeep a close watch on the 3,403–3,406 zone (highlighted area in the chart). This is a strong resistance zone that gold has tested multiple times but failed to break.
What to expect?
If gold gives a clean breakout and sustains above this zone, we could see a good upside momentum unfolding.
📈 Break above = bullish momentum confirmation
💬 Stay alert and be ready to act if price breaches this key level with volume and strength.
Trade smart, manage risk.

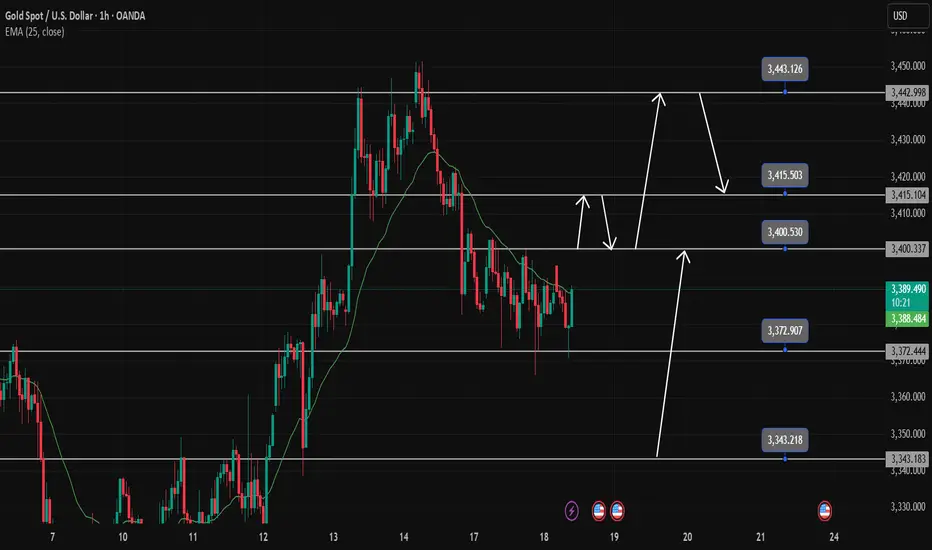
Trading strategy june 18Yesterday's D1 candle was a Doji candle. It shows the hesitation of buyers and sellers at the price near ATH.
The h4 structure is a sustainable bullish wave structure and is heading towards higher hooks.
The 3400 zone is the immediate resistance zone that Gold is heading towards. This zone will be the breakout zone for the confirmation of the candle closing above 3400.
The profit-taking reaction zone of sellers at 3415 acts as a price reaction when the price uptrends again and creates momentum towards 3443.
On the opposite side, the breakout point of 3472, if broken, will push the price to the support zone of 3342
Break out zone: 3400; 3372
Resistance: 3415; 3443
Support: 3343
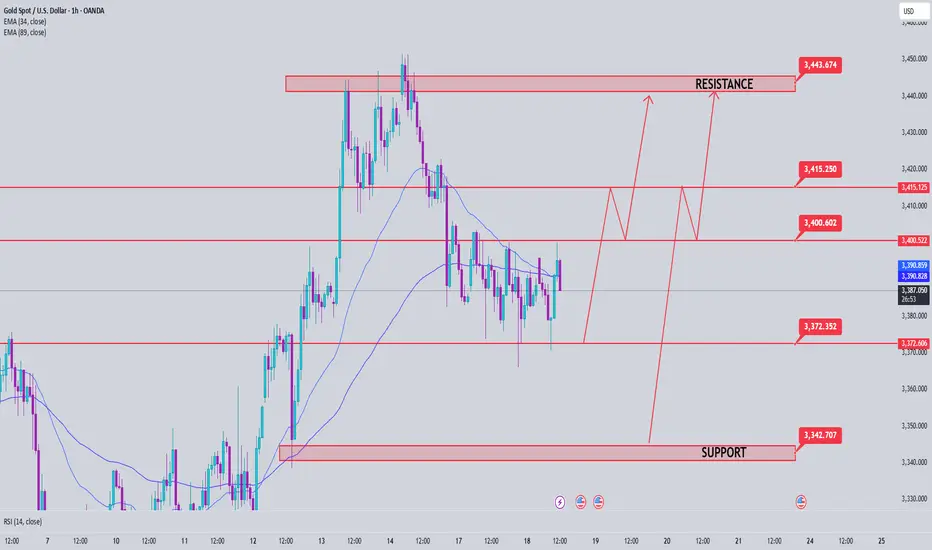
Gold price analysis June 18Yesterday's D1 candle was a Doji candle. It shows the hesitation of buyers and sellers at the price near ATH.
The h4 structure is a sustainable bullish wave structure and is heading towards higher hooks.
The 3400 zone is the immediate resistance zone that Gold is heading towards. This zone will be the breakout zone for the confirmation of the candle closing above 3400.
The profit-taking reaction zone of sellers at 3415 acts as a price reaction when the price uptrend returns and creates momentum towards 3443.
On the other hand, the breakout point of 3472, if broken, will push the price to the support zone of 3343
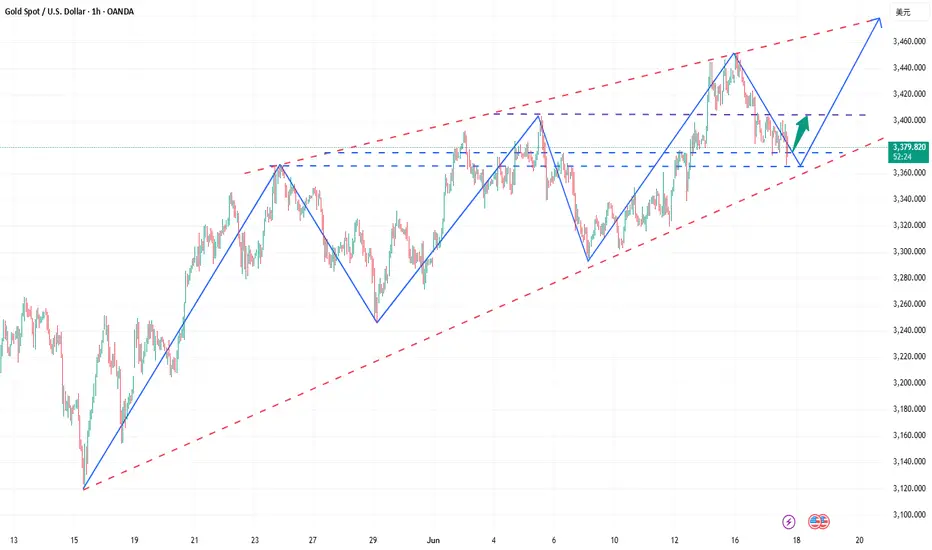
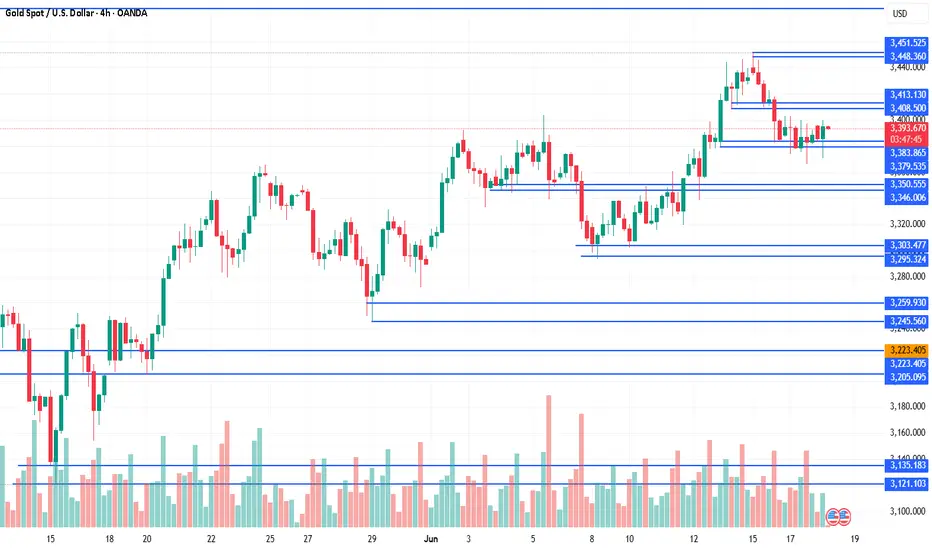
Gold (XAU/USD) 4H Technical Analysis - 18 June-2025Gold has been in a bullish 4H uptrend, making higher highs and higher lows. Recent data show gold peaked near ~$3,445 on June 16 (a new all-time high) before pulling back toward the $3,400 area.
In other words, price action remains constructive: successive higher lows (around $3,372, $3,322) and higher highs (around $3,445) indicate a strong uptrend.
As long as each pullback holds above the prior swing low (so far ~$3,372), the bullish structure (Break-of-Structure, BOS) is intact.
A decisive drop below ~3,372 (and especially below ~$3,322) would violate that structure (a Change-of-Character, CHoCH) and open a deeper correction.
Market Structure & Bias (4H)
Bullish bias: Gold has made a series of higher lows and highs on 4H, confirming an uptrend
Technical indicators (RSI bullish, price above 200-SMA) and fundamentals (safe-haven demand) support this bias.
Caution near $3,400:
The key $3,400 zone has switched roles as resistance-turned-support. Holding above $3,400 keeps bulls in control, but failure to regain it could allow a deeper dip toward ~$3,350.
Break-of-Structure (BOS): A BOS (new 4H high) upholds the uptrend.
A CHoCH (e.g. a close below $3,372/$3,322) would signal a possible reversal
Key 4H Levels & Zones
Resistance/Supply: ~$3,445–3,450 (recent swing high); ~$3,500 (psychological/all-time level).
Price may stall or reverse near these supply zones.
Pivot/$3,400: ~3,400–3,413 zone – a critical pivot. Gold traded near $3,400 recently; a break above targets $3,450, while failure could drop to support.
Support/Demand Zones: ~$3,372 (prior 4H higher-low). Near ~$3,350–3,353 – the 61.8–78.6% Fibonacci retracement of the last rally and a “golden pocket” demand area. ~$3,322–3,328 – a strong 4H demand order-block where price held on the last pullback.
Finally ~$3,300 (major low below).
Order Blocks & Imbalances: Smart-money traders note a 4H demand block at $3,322–3,328 (the low of a large bullish candle).
A brief sweep above $3,338 (a liquidity grab) was followed by a clean bounce from this zone.
Any unfilled gaps (imbalances) near $3,380–3,400 may attract price back during retracements.
In summary, the 4H chart shows a bullish structure with key support at ~$3,372–3,350 (demand/Fib zone) and resistance around $3,445–3,500. As FXStreet notes, the uptrend remains “intact” on 4H as long as dips are bought.
However, traders should watch for any break below $3,372/$3,322, which would flag a bearish structure break.
Until then, the overall bias is bullish, favoring long entries on dips into the above support zones.
1H High-Probability Trade Setups (Bullish Bias)
Setup 1 – Buy on $3,400 pivot hold: Entry zone $3,390–3,400 (at/just above 4H pivot). Stop: ~$3,380 (just below pivot, ~$10 below entry). TPs: $3,420 and $3,450. Trigger: A bullish candlestick pattern or break-and-retest of ~$3,400 (e.g. bullish engulfing or hammer on 1H). Reason: The $3,400 level is a key 4H support/resistance flip.
Holding here would confirm the uptrend continuation, targeting the recent swing highs. A 1H bullish signal (like a reversal bar) gives a clear entry.
Setup 2 – Buy on deep pullback: Entry zone $3,370–3,380 (around 4H higher-low). Stop: $3,360. TPs: $3,400 (the pivot) and $3,420. Trigger: A strong 1H bullish candle or double-bottom forming near zone. Reason: This area lines up with the 4H demand/Fib zone ($3,350–3,372).
It represents a higher-low in the 4H structure. A bounce here would signal buyers stepping in at a key support.
Setup 3 – Buy after breakout of $3,445: Entry zone $3,450–3,455 (above recent high). Stop: ~$3,440. TPs: $3,480 and $3,500. Trigger: A clean 1H candle close above $3,445 (breakout) and retest. Reason: A push above $3,445 (June high) would form a new 4H BOS, suggesting continued momentum. Buying on the breakout retest captures follow-through to the next targets.
(Each setup uses a small $~10 stop relative to gold’s price. Always wait for the specified trigger pattern before entering.)
Takeaway:
On the 4H chart, gold remains bullish while above ~$3,372/$3,350. Key zones to watch are $3,372–3,350 (buy zone) and $3,400–3,445 (sell/resistance). For now, favor long entries into support, and confirm with clear 1H signals before trading.
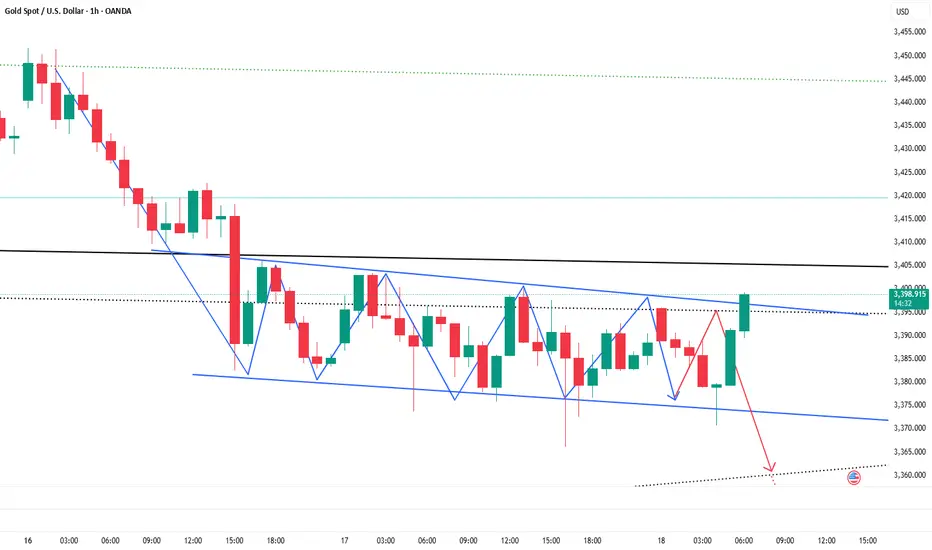
Gold fluctuates under pressure. Can it break out?Information summary:
The conflict between Iran and Israel has entered the fifth day, Tel Aviv air raid alarms are frequent, and the fire of oil tankers in the Strait of Hormuz has exacerbated the panic of energy transportation, and safe-haven buying supports gold prices;
Trump's contradictory statement of "peace talks + toughness" has exacerbated the market's differences on the direction of the conflict, and risk aversion has fluctuated repeatedly.
In the early Asian session, spot gold fluctuated narrowly at $3,375, continuing the stalemate under the geopolitical conflict and the game of the US dollar. As the "king of safe havens", gold has recently bottomed out and rebounded based on the tension in the Middle East, and the current price fluctuates around 3,395.
Market analysis:
The four-hour chart shows that the moving average is sticking to wait for a breakthrough in the direction, and the short-term moving average is sticking to $3,380. The RSI indicator fluctuates around 50, suggesting that a breakthrough will be ushered in after a narrow consolidation; the lower rail support of the rising channel moves up to $3,370, and if it fails, it may test $3,350.
At present, the price is repeatedly testing the resistance position of 3400. If the price stands above this position, it may continue to rise to around 3430. If it breaks the support of 3370 US dollars, it will look to 3360 US dollars.
Operation strategy:
Short near 3400, stop loss 3410, profit range 3370-3365.
If the price falls back to around 3370, you can try to go long, and the profit point is around 3390.
Gold may usher in new opportunities
Key fundamental drivers
- Middle East tensions and nuclear negotiations Despite the ongoing tensions, Iran's signal of restarting nuclear talks has reduced risk aversion, triggering an intraday sell-off in gold, and the market has digested the reduced possibility of escalation of the conflict. The turbulent situation in the Middle East remains a trigger for market volatility, and any downgrade/escalation signals may trigger sharp fluctuations in gold prices.
- Fed policy and rate cut bets The Fed kept interest rates unchanged this week, but Powell's "data-dependent" stance has raised market expectations for a September rate cut to 60%. A dovish meeting statement could push gold prices above $3,400, while a delayed rate cut signal could drag gold prices to $3,350.
Short-term outlook
In the short term, gold prices may fluctuate between $3,350 and $3,450, and a breakthrough depends on:
- Upside catalyst: Escalating tensions in the Middle East + weak retail sales data may push gold prices to $3,450.
- Downside risks: Fed hawkish signals + fading geopolitical risks could push prices to $3,300.
Key event risks
- June 19: Fed policy meeting (expected to be dovish)
- June 21: US CPI data (inflation indicator to measure the timing of rate cuts)
- Middle East situation: progress in nuclear negotiations and conflict dynamics
💰Strategy Package
Set gold price:
🔥Sell gold area: 3390-33396 SL 3400
TP1: 3380 US dollars
TP2: 3375 US dollars
🔥Buy gold area: $3374-$3366 SL $3360
TP1: 3390 US dollars
TP2: 3400 US dollars
XAUUSD DAYTRADE SIGNAL!!!Hello Everyone i want share my trade for today at Gold/USD pair.
price moving slow downside, with liquidity, for today i will use Fibonacci.
Open Short position at 3390
Stop Loss 3396
Take profit 3366
The reason for this trade is catch liquidity and dollar is still bullish and that's the reason why i think gold will go down again.
Always make your research!!!!

Gold is under pressure! What is the key to breaking the deadlock
📌 Core driving events
The conflict between Iran and Israel has entered the fifth day. Air raid alerts in Tel Aviv are frequent. The fire on a cruise ship in the Strait of Hormuz has exacerbated the panic of energy transportation. Safe-haven buying supports gold prices;
Trump's contradictory statement of "peace talks + tough" (may send executives to meet but demand "unconditional surrender") has exacerbated the market's disagreement on the direction of the conflict, and risk aversion has fluctuated repeatedly.
The Federal Reserve will announce its interest rate decision today. The market expects it to remain unchanged at 4.25%-4.50%, but Powell's statement on rate cuts will affect the trend of the US dollar (Trump continues to pressure for a 1 percentage point rate cut).
📊Comment Analysis
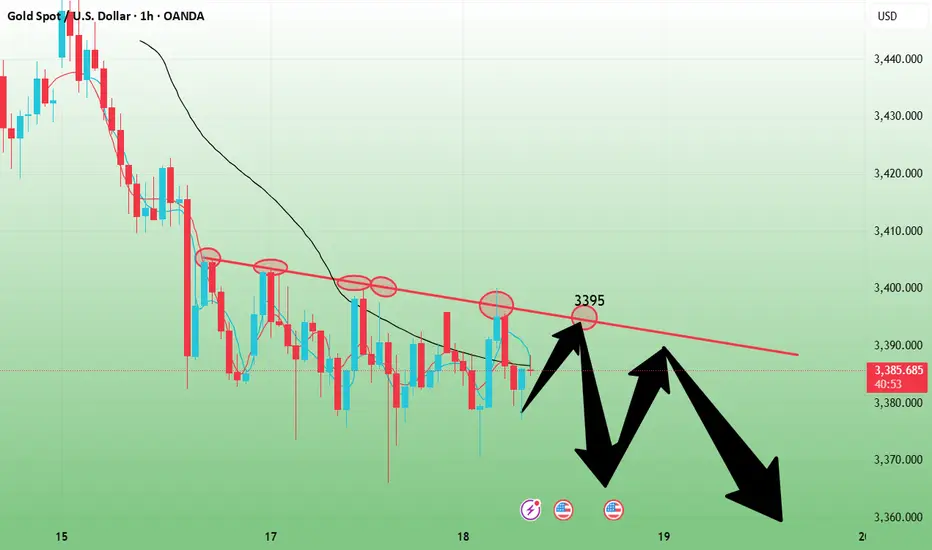
1-hour chart: 3396 becomes the intraday strength and weakness watershed
The Asian morning session hit a high of 3396 US dollars and fell back. This point is the previous high pressure point. If the intraday rebound does not break through this position, the bearish thinking will be maintained;
💰Strategy Package
Set gold price:
🔥Sell gold area: 3390-33396 SL 3402
TP1: 3380 US dollars
TP2: 3375 US dollars
🔥Buy gold area: $3374-$3368 SL $3362
TP1: 3390 US dollars
TP2: 3400 US dollars
⭐️ Note: Labaron hopes that traders can properly manage their funds
- Choose the number of lots that matches your funds

Gold-----Sell near 3405, target 3390-3360Gold market analysis:
Yesterday's daily line closed with a big negative line, which was basically a day to kill the buying. Today's idea is to sell in the short term. The daily and weekly trends have not yet turned to selling. Although the daily line closed with a big negative line yesterday, its shape and indicators have not completely turned to selling. There is still motivation to buy in the later stage. In addition, Iran and Israel are still fighting. It is still difficult to see a deep decline in the short term. We estimate that today's Asian session will rebound slightly and then fall. If today's daily line continues to fall again, it may enter a new short-term selling mode. We are just a follower. We follow the short-term. If the short-term trend is bearish, we will rebound and sell. The daily line closes the negative Asian session and waits for the opportunity to sell.
In the Asian session, we pay attention to the suppression of the 3410 position. It is the suppression position of the shape, the suppression position of the 1-hour moving average, the central axis position of yesterday's big drop, and the suppression position of the daily line. If the Asian session stands on 3410, it may bring a new technical rise in buying. After all, the shape of the daily line is still buying. Secondly, if it breaks 3382, it can continue to sell it with a small rebound. 3405 is also a suppression, and it is also considered to sell when it is close.
Pressure 3405 and 3410, support 3282, the strength and weakness dividing line 3400.
Fundamental analysis:
Yesterday, Iran and Israel started bombing each other again, and the situation began to escalate.
Operation suggestion
Gold-----Sell near 3405, target 3390-3360
Gold is weak, and there may be a low point yet to come!According to the current structure, gold is obviously in a weak position. Gold has failed to break through the high point of the previous wave after multiple rebounds during the day. 3400 has become a new round of pressure area; and gold has just accelerated its decline and fell below 3370. For the current trend, falling below 3370 will weaken the bullish sentiment to a certain extent and indicate that there is further room for decline, so I think gold should have a low point, and the low point we should first pay attention to is in the range of 3365-3355.
So in terms of short-term trading,
First, we can try to short gold with the short-term resistance area of 3395-3405;
But if gold first retreats to the support area of 3365-3355, we can first choose to go long on gold.

Have you caught up with this golden opportunity?The 4-hour K-line pattern of gold shows that the upward trend remains intact, focusing on the strong support range of 3360-3365 (technical resonance with the 5-week moving average). Before the price effectively breaks below the support band, the bulls still have upward momentum, otherwise the trend may reverse. The 3365-3400 range is maintained for intraday fluctuations. The gold operation strategy recommends arranging long orders in the 3370-3375 area when the price falls back, and adding positions to long positions if the support of 3360-3365 is broken.
Operation strategy: Gold recommends going long near 3370-3375 now, and adding positions to long positions in the support area of 3360-3365 when the price breaks, with the target of 3380-3390.
If you still lack direction in gold trading, you might as well try to follow my pace. The strategy is open and transparent, and the execution logic is clear and definite, which may bring new breakthroughs to your trading. The real value does not rely on verbal promises, but is verified by the market and time.