XUA/USD) Bearish Trend Read The captionSMC Trading point update
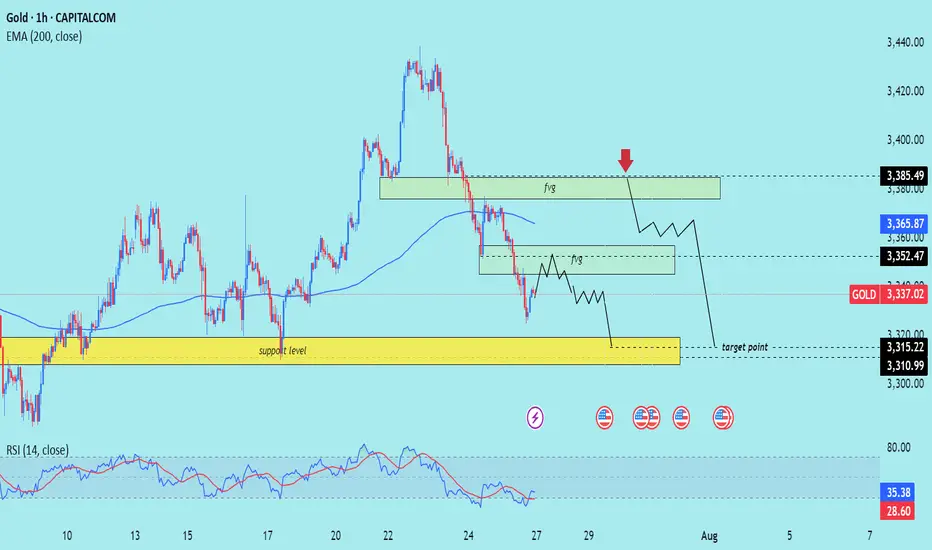
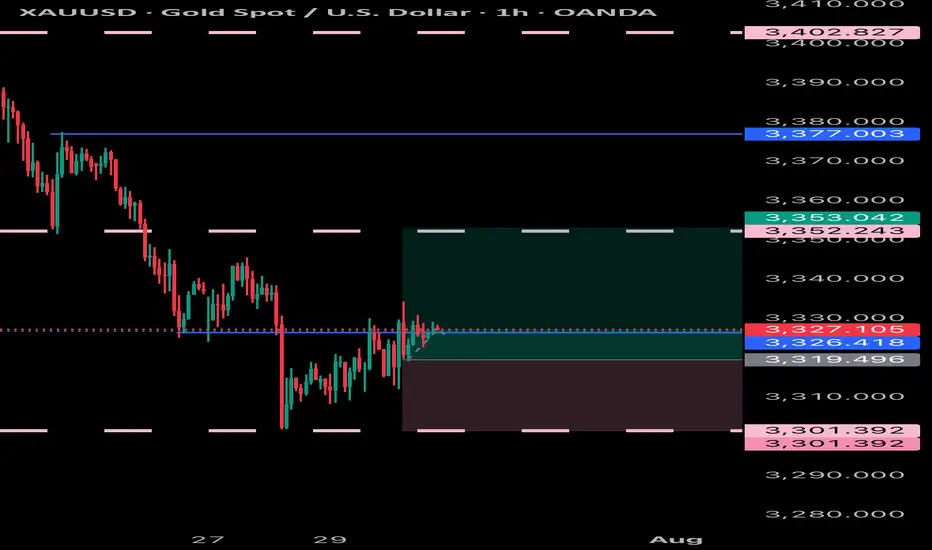
Technical analysis of (XAU/USD) on the 1-hour timeframe, targeting a move toward the $3,310–$3,315 support zone. Here's the full breakdown:
---
Technical Analysis – Gold (1H)
1. Fair Value Gap (FVG) Supply Zones
Two FVG supply zones are marked where price previously dropped sharply:
Upper FVG zone near $3,385.49 (with red arrow: expected rejection point)
Lower FVG zone near $3,352.47
Price is expected to reject from either zone, resuming the bearish move.
2. Market Structure: Lower Highs, Lower Lows
The chart shows a clear bearish structure, with consistent lower highs and lower lows.
The current price action suggests a potential pullback into FVG, followed by another leg down.
3. Key Support Zone (Target Area)
The yellow box between $3,315.22–$3,310.99 represents a strong demand/support zone and is marked as the target point.
This level has acted as a prior accumulation zone and is likely to attract buying interest again.
4. EMA 200 Resistance
Price is trading below the 200 EMA (currently at $3,365.87) — indicating a bearish bias.
EMA also aligns near the lower FVG zone, reinforcing the area as a potential reversal point.
5. RSI Indicator
RSI at 35.38 is nearing oversold territory but still shows downward pressure.
No divergence or reversal signal yet — supports the continuation view.
Mr SMC Trading point
---
Summary
Bias: Bearish
Current Price: $3,337.02
Supply Zones (FVG):
$3,385.49 (stronger supply)
$3,352.47 (minor supply)
Support Target: $3,315.22–$3,310.99
Structure: Bearish (LL-LH formation)
EMA: 200 EMA acting as dynamic resistance
RSI: 35.38 – still bearish momentum
---
Please support boost 🚀 this analysis)
Goldprediction
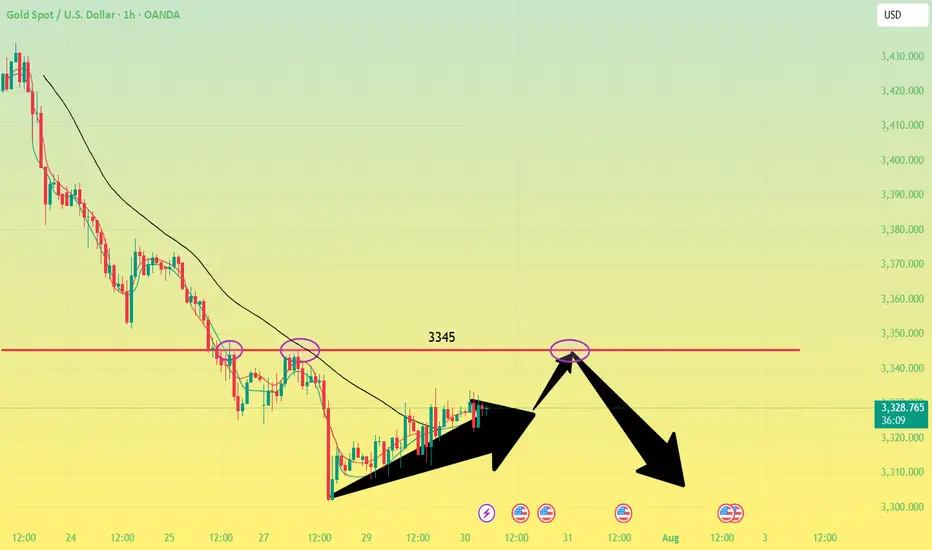
Gold - Sell around 3345, target 3320-3301Gold Market Analysis:
Gold has been in a correction over the past two days, with repeated ups and downs, generally trending towards a low and then a rebound. Yesterday, we insisted on selling at 3320, 3326, and 3328, but the profits weren't significant. The daily chart doesn't clearly indicate stabilization or a reversal of trend. Looking at the longer-term trend, I still insist on buying if 3345 breaks. If it doesn't break, we can hold on to the bearish trend. We previously mentioned that 3300 is support on the daily and weekly charts. A technical rebound and correction after selling below this level is inevitable and a normal technical correction. Furthermore, starting Wednesday, big data will be released one by one, and the market is waiting for the data to guide its direction. The weekly chart is also confused and directionless. We're just small investors; we need to follow, not speculate. The 5-day moving average on the daily chart has dipped below 3335, a level that has been retested multiple times in the Asian session. The current correction range is 3300-3335, with resistance around 3345-3343. The daily chart closed positive again, suggesting that the support below may be difficult to break in the short-term Asian session, and a significant decline is unlikely. We anticipate continued correction pending the ADP results.
Support is 3311 and 3301, resistance is 3345, with minor resistance at 3335. The dividing line between strength and weakness is 3335.
Fundamental Analysis:
Today, focus on the ADP employment data and the EIA crude oil inventory data. The US interest rate results are the highlight, along with the speech.
Trading Recommendation:
Gold - Sell around 3345, target 3320-3301
Gold big data is here! Gold prices are igniting the market!Market News:
Spot gold fluctuated narrowly in early Asian trading on Wednesday (July 30), currently trading around $3,325 per ounce. London gold prices recovered some of their losses on Tuesday after falling for the fourth consecutive day, as the US dollar gave up some of its earlier gains, boosting international demand for gold. Declining US Treasury yields and a weak US labor market report also prompted investors to buy gold. The gold market is currently at a critical turning point. Fundamental buying and selling factors are in fierce competition: on the one hand, easing global trade tensions are suppressing safe-haven demand; on the other hand, falling US Treasury yields and expectations of a possible Federal Reserve shift are providing support. Meanwhile, progress in US-China trade negotiations, Trump's tough stance on Russia and the Middle East, and ongoing geopolitical tensions continue to add further uncertainty to the future of the gold market. Furthermore, attention will be paid to the Bank of Japan and Bank of Canada's interest rate decisions, the US second-quarter GDP data and the July ADP employment data. Second-quarter GDP data from Germany and the Eurozone also warrant attention.
Technical Review:
Gold bottomed out and rebounded, stopping at the 3310 level before rising sharply above the 30 mark. The daily chart closed with a small positive candlestick pattern. The 10/7-day moving averages remain converging, suppressing the 57 level above. The RSI stopped below the 50-day moving average and adjusted downward, with the price trading below the middle Bollinger Band at 40. A four-hour chart golden cross formed and pointed upward. The hourly MACD momentum bar is above zero, while the RSI is flattening, indicating a neutral trend. Gold technically remains in a wide range of fluctuations. The trading strategy is to sell high and buy low. Plan to buy low at 3318/06 and sell high at 3346/58. The release of important data today will affect the original technical trend of gold and silver, increasing volatility. Be aware of market risks.
Today's Analysis:
Although gold rebounded yesterday, the momentum wasn't particularly strong, with the upward trend remaining erratic. Bullish volume remains insufficient. Today's key events will be the non-farm payroll report and the Federal Reserve's interest rate decision. Pre-market activity is unlikely to see a significant upturn, so we'll have to wait for the data to provide direction. Expect volatility before the release! The slope of gold's 1-hour rebound doesn't necessarily indicate a deep V-shaped pattern. Gold hasn't yet reversed, and a second bottom is possible. Only if gold doesn't break a new low during this second bottoming out could a double bottom form. Gold is still expected to decline in the Asian session. If gold rebounds and comes under pressure, continue selling. A deep V-shaped reversal is only possible if gold breaks through and stabilizes at the 3345 level. Until then, continue selling at high prices.
Trading strategy:
Short-term gold: Buy at 3310-3313, stop loss at 3300, target at 3340-3360;
Short-term gold: Sell at 3343-3346, stop loss at 3355, target at 3310-3300;
Key points:
First support level: 3310, Second support level: 3292, Third support level: 3284
First resistance level: 3338, Second resistance level: 3346, Third resistance level: 3358

Are you ready for the BUY BTCUSD signal?✏️ The pennant pattern is forming. After BTCUSD reached a new peak, the past 1 week, BTC price has been accumulating to form a bullish pennant pattern. This is a bullish continuation pattern that signals when breaking the upper boundary of the flag pattern.
📉 Key Levels
BUY Trigger: Break and trade above 199000
Target 128000
Leave your comments on the idea. I am happy to read your views.

XAU/USD(20250730) Today's AnalMarket News:
According to a Reuters/Ipsos poll, Trump's approval rating has fallen to 40%, the lowest level since his second term.
Technical Analysis:
Today's Buy/Sell Levels:
3322
Support and Resistance Levels:
3348
3338
3332
3312
3306
3296
Trading Strategy:
If the market breaks above 3332, consider entering a buy position, with the first target price at 3338. If the market breaks below 3322, consider entering a sell position, with the first target price at 3312.

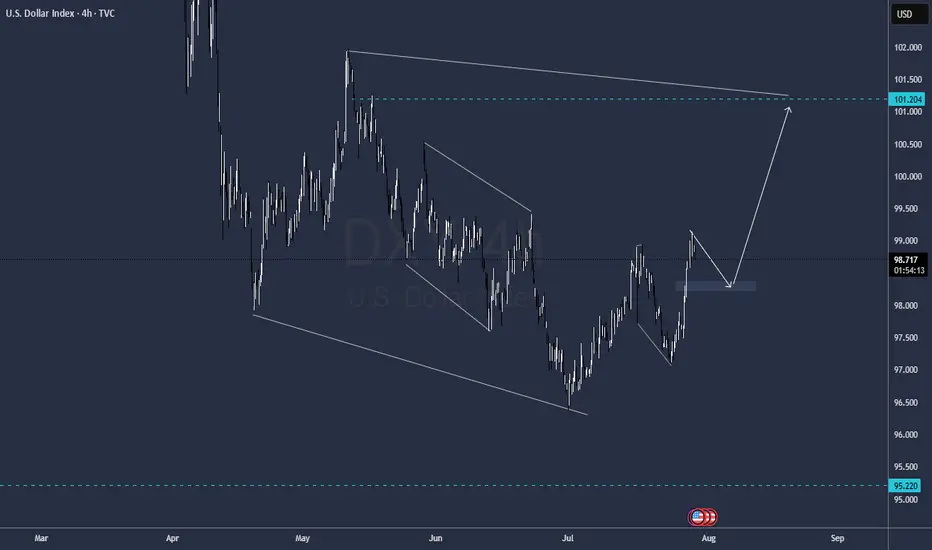
DXY dayly structureMay change indeed
but its pretty much what meassures and current development is showing
GG
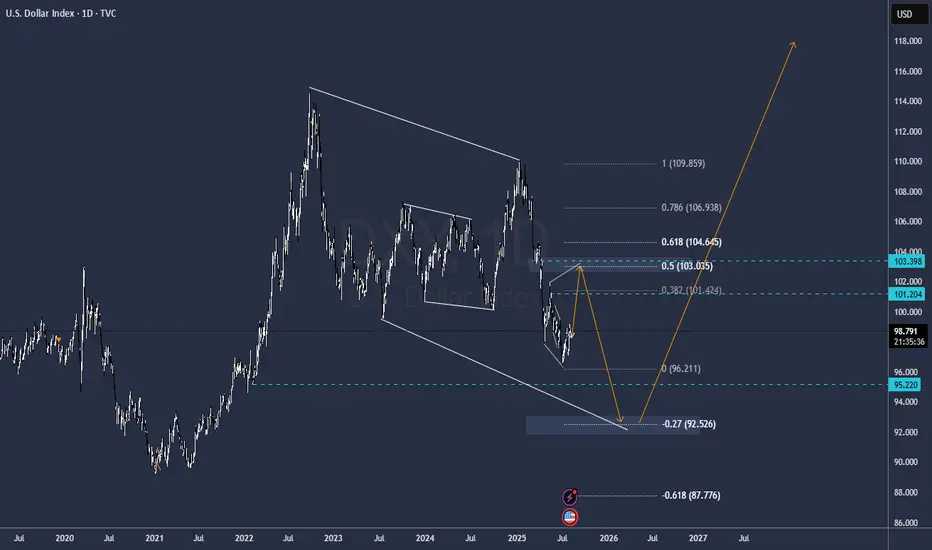
DXY FOMC FORECASTCristal Clear structure to me, dolar down today before FOMC and then up wild
Levels highlighted
Najors Gold and Cryptos will follow the same behavior
GG
GOLD GOLDEN XauUsd is now still respecting the trend and will keep holding expecting an even stronger push to the up side
GOLD this snicky GuyTruth be told, im not a big fan of this scenario, its going up mssy but it still looking Bulish, i I have to make a call I will be tking the sell from 3370 and yeah mayb the buy with really, really small risk, but its is up to you
Levels labeled in the chart
GG
GOLD Falls Back Toward the $3,300 ZoneOver the past four trading sessions, gold has depreciated more than 3.5%, showing a renewed and steady bearish bias around this major safe-haven asset in the short term. Selling pressure has remained strong recently, as confidence in financial markets has gradually improved. Investors have responded positively to the latest trade agreement developments, which have temporarily reduced concerns surrounding the trade war. As a result, demand for safe-haven assets has declined, directly impacting gold, one of the most important hedging instruments currently in the market.
Sideways Range Remains Active
Since late April, gold has been unable to establish a clear directional bias, and has remained trapped within a sideways range, with resistance around $3,400 per ounce and support at $3,300 per ounce. So far, price action has not been strong enough to break out of this structure. However, gold is now testing important support levels, where sellers could begin to face stronger barriers as the price attempts to break through the bottom of the established range.
RSI: The RSI line has consistently crossed below the neutral 50 level, indicating that selling momentum is becoming more dominant. If this trend continues in the short term, it could reinforce the presence of bearish pressure in upcoming sessions.
MACD: The MACD histogram has started to move below the zero line, suggesting that the momentum of the moving averages has shifted firmly to the downside. This reflects a strong bearish tone, and if this continues, selling pressure could become more relevant in the short term.
Key Levels:
$3,400 per ounce – Major Resistance: This level marks the recent all-time high for gold. If buying momentum pushes the price back above this zone, it could trigger a renewed bullish bias and set the stage for a sustained upward trend in the sessions ahead.
$3,300 – Current Barrier: This level defines the lower bound of the short-term channel. A break below this support could confirm a dominant bearish bias, potentially lasting for several trading sessions.
$3,200 – Final Support: This marks the lowest price level reached by gold in recent months and lies below the 100-period simple moving average. If the price drops to this zone, it could trigger the start of a new short-term downtrend on the chart.
Written by Julian Pineda, CFA – Market Analyst

XAUUSD Monthly Technical OutlookMarket Structure Overview:
• The chart reveals consistent Breaks of Structure (BOS) to the upside, confirming a strong bullish market trend.
• Price has successfully reclaimed and retested the strong resistance zone (~3390–3400), which now acts as new support.
• A series of higher highs and higher lows show clear bullish intent, supported by sustained bullish momentum after each correction.
⸻
📈 Volume & Price Action:
• The Volume Profile (VRVP) on the left shows strong historical accumulation near the current breakout zone.
• After the breakout from resistance, the price retested this zone—validating it as support—and is expected to continue its bullish leg toward $3,500, the next psychological and technical target.
⸻
📍 Key Levels:
• Support Zone: $3,375 – $3,390 (previous resistance turned support)
• Immediate Resistance: $3,425
• Target Level: $3,500 (Monthly High Projection)
⸻
📘 Educational Note:
• This setup aligns with classic market structure theory: BOS + Retest + Continuation.
• The pullback into the breakout zone is a textbook bullish continuation signal often used in institutional trading strategies.
• Traders watching this pattern should combine it with confirmation entries such as bullish engulfing candles, FVGs, or order block rejections for safer entries.
⸻
🎯 Projection:
• As long as the price holds above $3,375, the bullish scenario toward $3,500 remains valid.
• Expect possible consolidation or minor pullbacks before continuation.
⸻
📌 Disclaimer:
This analysis is for educational purposes only and does not constitute financial advice. Always do your own research before entering the market.

BTC's latest trading strategy and analysis layout#BTCUSD
BTC's current technical signals show a bull-bear tug-of-war situation.If a golden cross is formed near the zero axis, it may indicate a new wave of rise; if it falls below the zero axis, we need to be wary of a deep correction.
There are certain opportunities for both bulls and bears in the current market, but global regulatory policies have not yet been unified. Policies such as the US "GENIUS Act" may affect BTC and require continued attention. BTC is currently facing significant buying support around 117,500, but the hourly chart shows that there is still potential for a continued pullback. The current trend has not yet finished. Pay attention to the support level of 116,000 below. If it falls below, it may fall into the consolidation range of 116,000-114,000. For aggressive traders, consider going long at 117,500-116,500, with a target of 118,500-119,500. A break above this level could lead to 120,000.
🚀 117500-116500
🚀 118500-119500

XAUUSD idea 29/07/25We are waiting for our asset to reach our action zone, and based on the reaction, we’ll decide on our next moves.ALWAYS WAIT FOR A CONFIRMATION TO SEE IF THE PRICE VALIDATES THE ZONE.and you what is your vision of the EURUSD its interests me! i wait you in the commentary

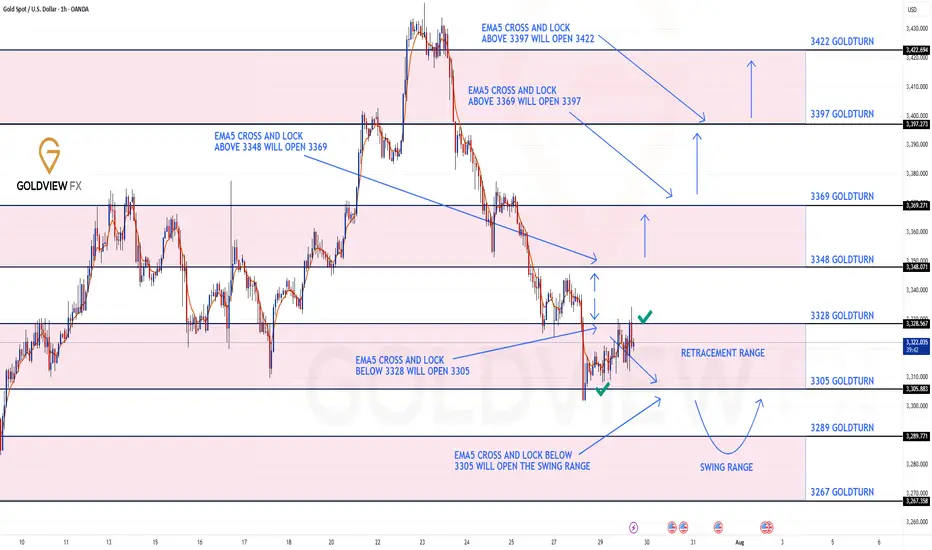
GOLD ROUTE MAP UPDATEHey Everyone,
Following yesterday’s move into the 3305 retracement range, we got the expected reaction without an EMA5 lock, which further confirmed the rejection from that level and led to a clean bounce into 3228 just like we analysed.
From here, we anticipate price to range between 3328 and 3305. EMA5 cross and lock above 3328 or below 3305 will be key to confirming the next directional move.
We’ll continue to monitor for that confirmation and adjust accordingly.
We will keep the above in mind when taking buys from dips. Our updated levels and weighted levels will allow us to track the movement down and then catch bounces up.
We will continue to buy dips using our support levels taking 20 to 40 pips. As stated before each of our level structures give 20 to 40 pip bounces, which is enough for a nice entry and exit. If you back test the levels we shared every week for the past 24 months, you can see how effectively they were used to trade with or against short/mid term swings and trends.
The swing range give bigger bounces then our weighted levels that's the difference between weighted levels and swing ranges.
BULLISH TARGET
3348
EMA5 CROSS AND LOCK ABOVE 3348 WILL OPEN THE FOLLOWING BULLISH TARGETS
3369
EMA5 CROSS AND LOCK ABOVE 3369 WILL OPEN THE FOLLOWING BULLISH TARGET
3397
EMA5 CROSS AND LOCK ABOVE 3397 WILL OPEN THE FOLLOWING BULLISH TARGET
3422
BEARISH TARGETS
3328 - DONE
EMA5 CROSS AND LOCK BELOW 3328 WILL OPEN THE FOLLOWING BEARISH TARGET
3305 - DONE
EMA5 CROSS AND LOCK BELOW 3305 WILL OPEN THE SWING RANGE
3289
3267
As always, we will keep you all updated with regular updates throughout the week and how we manage the active ideas and setups. Thank you all for your likes, comments and follows, we really appreciate it!
Mr Gold
GoldViewFX
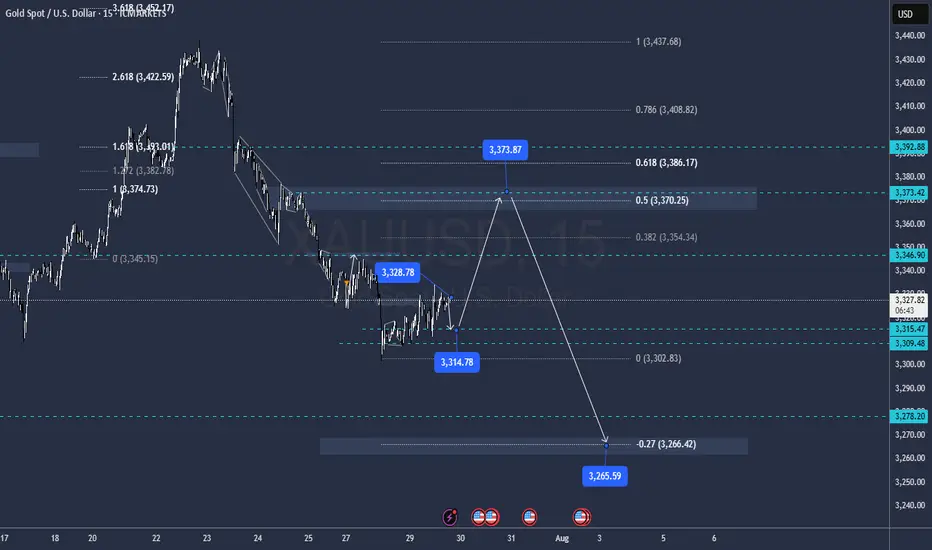
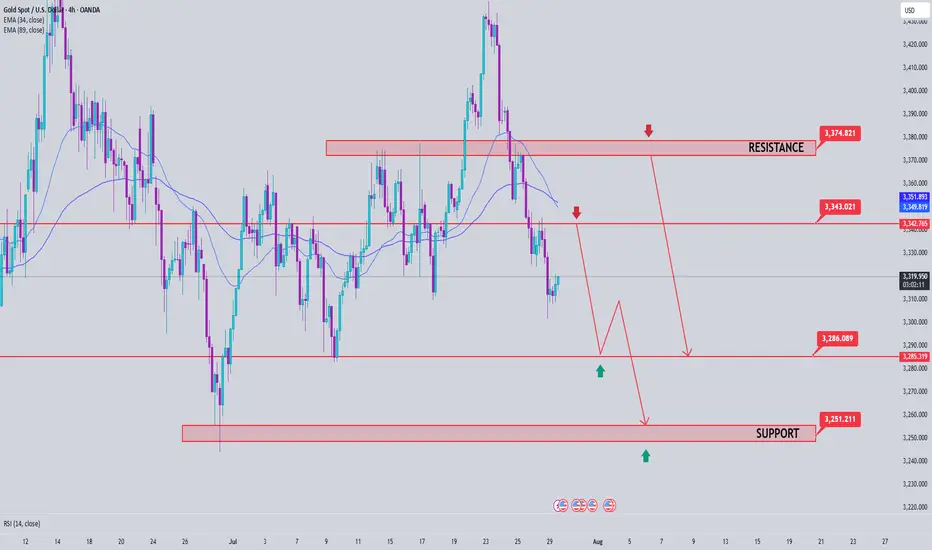
Gold Price Analysis July 29📉 XAUUSD ANALYSIS – IS THE CORRECTION OFFICIALLY STARTING?
Gold has officially broken out of the bullish wave structure and left the rising price channel – an important technical signal that the bearish correction trend has been activated. This development opens up the possibility of retests of the broken trendline, and if that happens in today's session, this could be a good opportunity to look for SELL entry points in the new trend.
📌 Short-term trading strategy:
Potential selling zone: 3343 – 3345
Downside target: 3283 first, followed by the strong liquidity zone around 3250
Confirmation of bearish force: Price continues to maintain below the 3375 area – which will act as an important resistance level. Only when the daily candle closes back above this zone will the uptrend be re-established.
✅ Reverse buying strategy if there is a strong support signal:
Buy trigger zone: Observe the price reaction around the 3285 area - there needs to be a clear bearish rejection signal (pin bar/bullish engulfing candle...)
Deeper buying zone: 3251 - where liquidity is concentrated and there is a possibility of bottom-fishing demand appearing.
GOLD - One n Single Area, what's next??#GOLD... market just reached at his ultimate area as we discussed in our last week analysis and in Friday analysis as well.
The area is 3309-10
Keep close and don't be lazy here.
NOTE: we will go for cut n reverse below 3309 in confirmation.
Good luck
Trade wisley

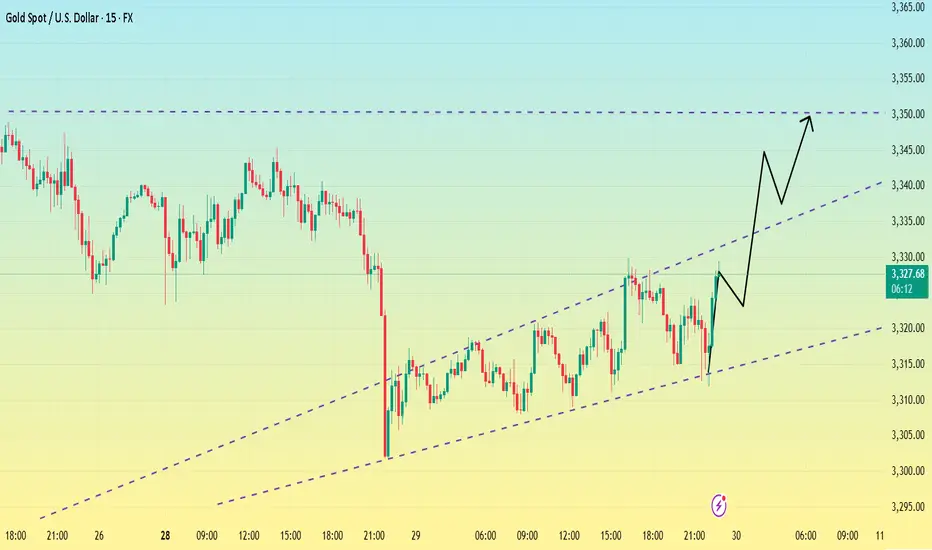
Bottoming out? Be wary of the market.After a sharp drop to around 3300 on Monday, gold rebounded, reaching a high of around 3330 so far.
From the 1-hour chart,Gold has now broken out and stabilized within the hourly chart's downward trend channel. The key upward level is currently around 3330. If it breaks above 3330 again, caution is advised; it may test 3345-3350. Conversely, if it fails to break above 3330, gold may consolidate between 3300-3330 before the non-farm payrolls release.
From a short-term 15-minute perspective, the current 15-minute range has been broken out and stabilized. The current situation is unfavorable for bears. Based on the trend, a breakout above the 15-minute range would indicate a rebound. However, until 3330 holds, the 3320-3330 range is the only option. However, the current trend favors a bullish pullback, so I'm not too keen on shorting. Therefore, focus on support at 3320.
If it fails to break below 3320, enter a long position near 3320. The upper target is the top of the 3345-3350 range.
European session under pressure 3321 continue to shortI reminded everyone last night that if gold holds the 3300 mark, it will consolidate in the 3300-3345 range in the short term. The current gold price basically fluctuates narrowly between 3320-3310. Judging from the daily chart, the short-term upper pressure is at 3330. Only if the daily line stands firmly above 3330, there is a possibility of a rebound upward in the short term. Judging from the hourly chart, gold is still in a downward trend, and the hourly line is blocked near 3321. In the short term, if it cannot break through 3320-3330, gold will continue to fall. You can consider shorting, with the target at 3310-3300. If the European session is still volatile, maintain high shorts and low longs to participate in the cycle.
My premium privileges are about to expire, and subsequent trading strategies and analysis will be published in the group.

GOLD: Time for massive drop? +3000 pips move! Gold has failed to breakthrough the previous resistance indicating a strong sellers hold around $3440 region. Now since the price has stared dropping we can see it dropping around $2800 in long term. In order for this to happen we need strong confirmation, which will help us understand the possible volume.
Agree with our idea?
Like and comment!

XAUAUSD ideaWe are waiting for our asset to reach our action zone, and based on the reaction, we’ll decide on our next moves.ALWAYS WAIT FOR A CONFIRMATION TO SEE IF THE PRICE VALIDATES THE ZONE.and you what is your vision of the EURUSD its interests me! i wait you in the commentary

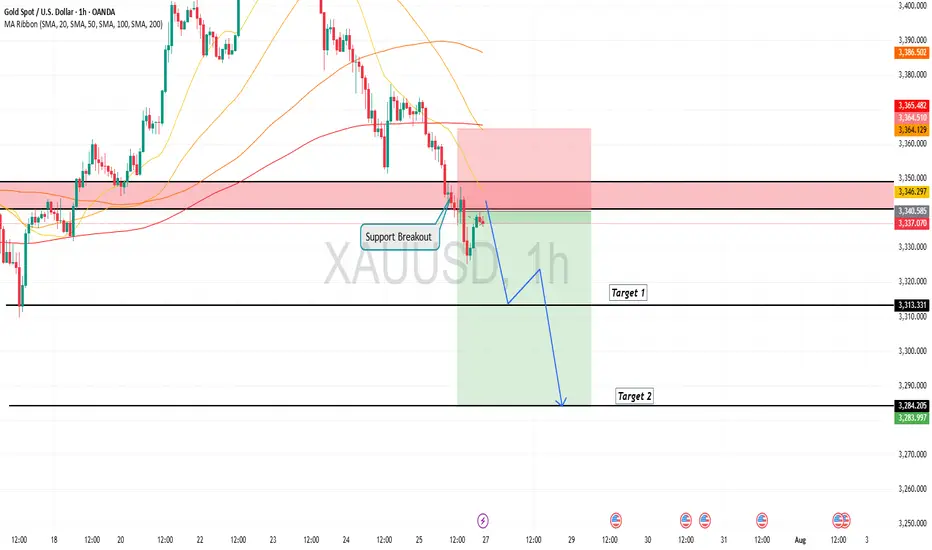
Gold is in the Bearish Direction after Breaking SupportHello Traders
In This Chart GOLD HOURLY Forex Forecast By FOREX PLANET
today Gold analysis 👆
🟢This Chart includes_ (GOLD market update)
🟢What is The Next Opportunity on GOLD Market
🟢how to Enter to the Valid Entry With Assurance Profit
This CHART is For Trader's that Want to Improve Their Technical Analysis Skills and Their Trading By Understanding How To Analyze The Market Using Multiple Timeframes and Understanding The Bigger Picture on the Charts
The latest trend analysis and layout of the day,flexible adoptio#XAUUSD
⚠️News focus on the Sino-US trade talks, which may affect the gold trend.
Since the opening of the market today, gold has been fluctuating in a narrow range in the short term, without giving a clear trading direction🤔, and the short-term trend has not changed much.📊
🚦It remains constrained by resistance and a downward trend. In the short term, we need to pay attention to the 3300 mark below and the support of 3295-3285📈. On the upside, we should pay attention to the short-term suppression level of 3321-3333 and yesterday's high of 3345-3350.📉
In the short term, as long as it does not break through yesterday's high point, the volatile downward trend will not change. 🐂Once it breaks through, the short-term decline will stop, and the market will continue the bull rebound to test 3370~3380 or even 3400 before falling again.
Therefore, short-term trading focuses on the 3300 mark below and the long trading opportunities at 3295-3285. On the upside, defend the 3345-3350 highs and establish short positions.🎯
🚀 BUY 3310-3330
🚀 TP 3321-3333
🚀 BUY 3295-3285
🚀 TP 3310-3330
🚀 SELL 3320-3330
🚀 TP 3310-3300
🚀 SELL 3345-3350
🚀 TP 3330-3285

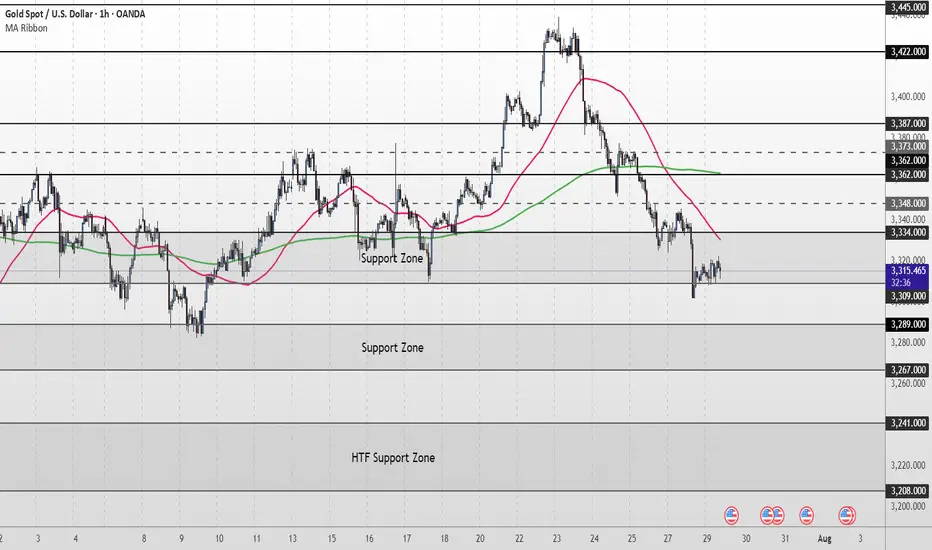
XAU/USD Intraday Plan | Support & Resistance to WatchGold remains under pressure, currently trading around 3,312. Price is holding just above the 3,309–3,289 Support Zone, but remains below both the 50MA and 200MA, which continue to slope downward—indicating short-term bearish pressure.
As long as price remains below the 3,334–3,348 resistance zone, the bearish momentum is intact. A clean break above this area would be the first sign of recovery, opening the path toward 3,362 and 3,373, where the next round of supply may emerge.
If price fails to reclaim 3,334 and breaks below 3,309, the 3,289–3,267 Support Zone becomes the next key downside target. Failure to hold that level would expose the HTF Support Zone (3,241–3,208).
📌 Key Levels to Watch
Resistance:
‣ 3,334
‣ 3,348
‣ 3,362
‣ 3,373
Support:
‣ 3,309
‣ 3,289
‣ 3,267
‣ 3,241
🔍 Fundamental Focus – Tuesday, July 29
Heads up — today’s focus is on 4:00pm, when we get JOLTS Job Openings 🟥 and CB Consumer Confidence 🟡
⚠️ Stay light and nimble — bigger moves may come tomorrow with red-folder data stacking up.