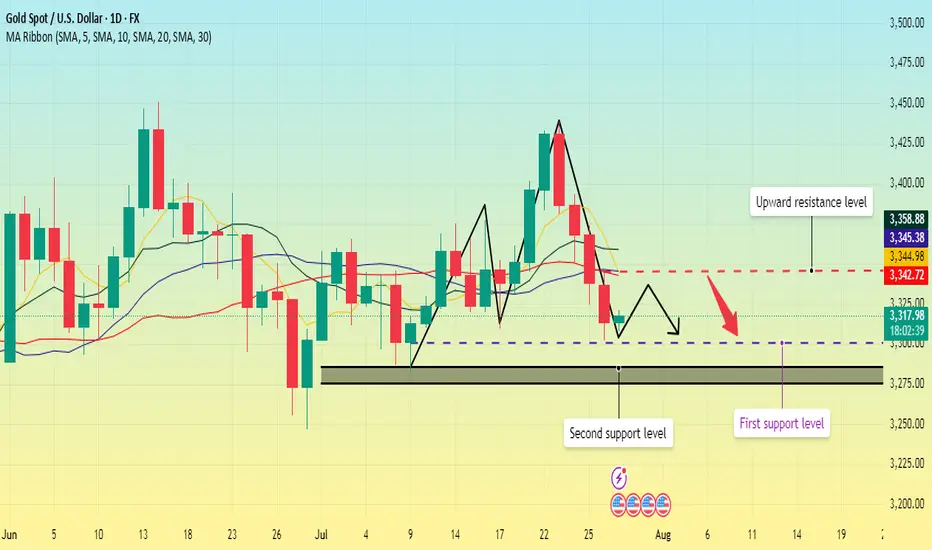
Gold----Sell near 3326, target 3300-3280Gold market analysis:
The recent gold daily line is still weak. It rebounded yesterday and fell again. It has touched the strong support of the weekly line. Today's idea is still bearish. Consider continuing to sell it if it rebounds. It is estimated that it will be repaired if there is support at 3300. The daily line was a cross star yesterday, and the upper shadow line was very long. The daily moving average suppression position was also around 3345, and the suppression position of the pattern was also around 3350. Today, the price is below 3345. We insist on being bearish. This week is a data week. The subsequent trend depends on the release of data. If the data is not strong and the weekly selling signal is added, it is very likely that gold will enter the 3200 era. After the weekly line breaks 3280, it basically opens up the weekly line's downward space, and will start a deep decline in the later period. In the Asian session of gold, we pay attention to the suppression of 3326. This position is the indicator suppression and the small suppression of the pattern. Consider selling it near this position. If it stands above 3326, don't sell it. The repair range will be 3345. Consider selling it at 3345. If the US market cannot break 3300, we should consider whether it will rebound. On the contrary, if it breaks 3300 directly in the Asian market, we should consider selling it directly.
Support 3300 and 3280, suppress 3326 and 3345, and the watershed of strength and weakness in the market is 3326.
Fundamental analysis:
This Monday and Tuesday are relatively quiet, and the big data will be released one by one starting from Wednesday.
Operation suggestion:
Gold----Sell near 3326, target 3300-3280
Goldprediction

Gold repeatedly tested lows. Will it break through?On Monday, the Asian market opened low and rose in the early trading. In the European trading, it rose to around 3345. The European trading was under pressure and fluctuated. The US trading began to accelerate its decline, and the lowest point reached around 3302. Then it continued to fluctuate in the range of 3300-3320.
On July 27, the United States and the European Union reached a framework trade agreement; the agreement reduced market concerns about the global economic recession, promoted the attractiveness of risky assets, and boosted the stock market and the US dollar. Although Trump has repeatedly pressured for a substantial interest rate cut, the market has strong expectations for a September interest rate cut. The current expectation of maintaining a stable interest rate dominates the market, coupled with the strength of the US dollar, which puts gold prices under downward pressure in the short term.
Gold opened low in the early trading on Monday and then rebounded to recover the losses, but then fell below the low again, and the daily line closed in the negative, and now it has formed a four-day negative decline. MA5 and 10-day moving averages form a dead cross, and there is a downward turn.
The focus on the upper side is around Monday's high of 3345, which is also near the current position of MA5, 20, and 30-day moving averages. Below this position, gold is weak; if it breaks upward, it is necessary to prevent the possibility of a rebound correction.
The lower support first focuses on the 3300 integer mark; secondly, focus on the area around 3285-3275.
Operation strategy:
Short near 3340, stop loss 3350, profit range 3320-3300;
Long near 3300, stop loss 3290, profit range 3320-3340.
Before the release of US data on Tuesday, you can maintain this operation strategy; after the data is released, adjust the strategy based on the impact of the data.
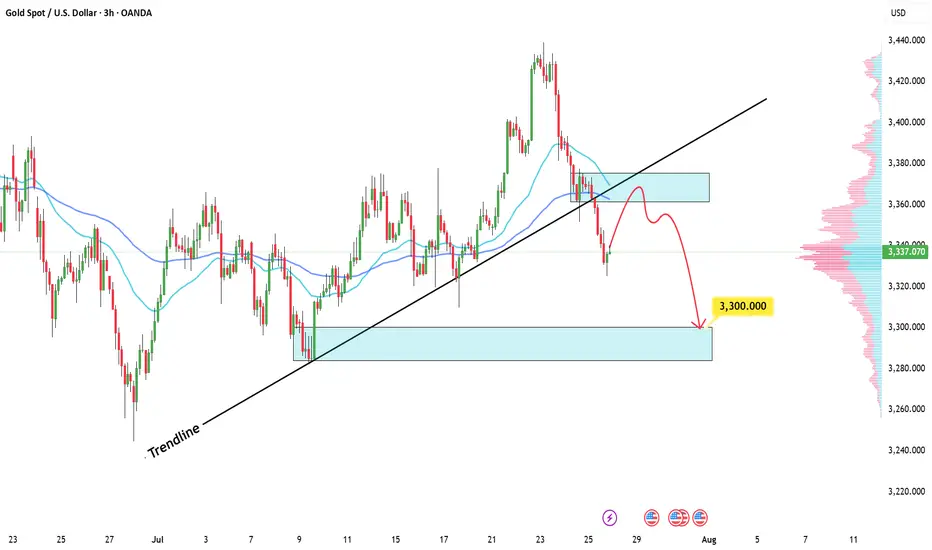
XAUUSD: Bearish Bias SetupI am watching for a possible reversal in XAUUSD, predicting a rejection with a downside target around 3.300.
This downside target is reasonable based on this setup, as it is based on a previous bullish move, from which price could find support and bounce, or break below, and the downside momentum could start to continue down.
I am just sharing my thoughts on the chart, this is not financial advice. Always confirm your setup and manage your risk accordingly.
XAU/USD(20250729) Today's AnalysisMarket news:
After gold prices soared to an all-time high of more than $3,500 an ounce in April, the latest report from the Commodity Futures Trading Commission (CFTC) showed that fund managers have increased their bullish bets to the highest level in 16 weeks.
Technical analysis:
Today's buying and selling boundaries:
3320
Support and resistance levels:
3363
3347
3337
3303
3293
3277
Trading strategy:
If the price breaks through 3320, consider buying in, with the first target price of 3337
If the price breaks through 3303, consider selling in, with the first target price of 3293

Gold Price Rally: Why Hedge Funds Are Making Their Biggest Bet Glimmer of Gold: Why Hedge Funds Are Making Their Biggest Bullish Bet in Months
In the complex and often turbulent theater of global finance, the movements of so-called "smart money" are watched with an eagle's eye. When these sophisticated players, particularly hedge funds, move in concert, it often signals a fundamental shift in market sentiment. Recently, a powerful signal has emerged from the depths of the commodities market: hedge funds have dramatically increased their bullish bets on gold, pushing their net long positions to a 16-week high. This aggressive positioning is not a random fluctuation; it is a calculated response to a potent cocktail of persistent geopolitical instability, simmering trade tensions, and a growing conviction that the global economic landscape is tilting in favor of the ultimate safe-haven asset.
The surge in bullish sentiment represents a significant vote of confidence in the yellow metal. It suggests that some of the world's most well-resourced and analytically driven investors are looking past the daily noise of equity markets and are instead positioning themselves for a future where security, stability, and tangible value take precedence. They are not merely dipping their toes in the water; they are making a decisive, leveraged bet that the forces buffeting the global economy will continue to drive capital towards gold's enduring allure. This move has sent ripples across the financial world, prompting investors of all stripes to ask a critical question: What does the smart money see that we should be paying attention to?
Decoding the Data: A Sharp Turn Towards Bullishness
To understand the magnitude of this shift, one must look to the weekly Commitments of Traders (COT) report published by the U.S. Commodity Futures Trading Commission (CFTC). This report provides a detailed breakdown of positions in the futures markets, separating traders into different categories, including "Managed Money." This category, which primarily consists of hedge funds and commodity trading advisors, is a key barometer for speculative sentiment.
The latest data reveals a sharp and decisive increase in bullish conviction. Hedge funds significantly ramped up their gross long positions—outright bets that the price of gold will rise. Simultaneously, they have been closing out their short positions—bets that the price will fall. The combination of these two actions has a powerful magnifying effect on the "net long" position, which is the difference between the number of long and short contracts.
Reaching a 16-week high is particularly noteworthy. It indicates a reversal of previous caution or bearishness and the establishment of a new, more aggressive bullish trend. For months, hedge funds may have been hesitant, weighing the prospects of higher-for-longer interest rates against emerging geopolitical risks. The current data shows that the scales have tipped decisively. This isn't a gradual accumulation; it's a forceful pivot, suggesting a high degree of conviction in the upside potential for gold. This influx of speculative capital acts as a powerful tailwind for the gold price, creating upward pressure as more funds chase the emerging momentum.
The Three Pillars of the Golden Thesis
The coordinated move by hedge funds is not based on a single factor but on a confluence of three powerful, interlocking macro-economic and geopolitical narratives. Each pillar reinforces the others, creating a compelling case for holding gold.
1. The Unsettled World: Geopolitical Risk as a Prime Catalyst
Gold has, for millennia, served as the ultimate barometer of fear. In times of peace and prosperity, its appeal can wane in favor of assets that offer growth and yield. But in an environment of escalating geopolitical tension, its value proposition becomes unparalleled. The current global landscape is rife with such tensions.
Persistent conflicts in key regions continue to create uncertainty, threatening to disrupt energy supplies, shipping lanes, and international relations. The risk of these conflicts widening or drawing in other powers keeps a floor under the demand for haven assets. Beyond active conflicts, the world is witnessing a broader realignment of global power. The rise of multi-polarity and the challenging of the post-Cold War order create a backdrop of systemic instability.
Furthermore, political uncertainty within major economies adds another layer of risk. Election cycles in dominant nations can lead to unpredictable policy shifts on everything from trade and taxation to international alliances. This policy uncertainty makes investors nervous, prompting them to allocate capital to assets that are insulated from the whims of any single government or political outcome. Gold, being a stateless monetary asset with no counterparty risk, is the natural recipient of these capital flows. Hedge funds are betting that these geopolitical undercurrents will not only persist but potentially intensify, making gold an essential portfolio hedge.
2. The Friction of Trade: A Drag on Global Growth
The era of seamless globalization has given way to a period of strategic competition and trade friction. The ongoing trade disputes between the world's largest economic blocs, most notably the United States and China, have moved beyond mere rhetoric and are now an entrenched feature of the global economy. Tariffs, export controls, and national security-driven industrial policies are disrupting long-established supply chains and creating a more fragmented and less efficient global marketplace.
This environment is a significant headwind for global economic growth. The uncertainty surrounding trade policy makes it difficult for businesses to make long-term investment decisions, dampening corporate spending and hiring. Slower global trade directly translates to slower economic growth, which in turn puts pressure on corporate earnings and equity valuations.
In this context, gold shines. As an asset that does not rely on economic growth to generate returns, it acts as a valuable diversifier in a portfolio dominated by stocks and bonds. When growth falters, gold's role as a store of value becomes more pronounced. Hedge funds are positioning for a scenario where persistent trade tensions continue to weigh on the global economy, making riskier assets less attractive and defensive assets like gold more appealing.
3. The Central Bank Pivot: Anticipating Looser Money
Perhaps the most powerful financial driver for gold is the outlook for monetary policy, particularly from the U.S. Federal Reserve. The price of gold has an inverse relationship with real interest rates (interest rates minus inflation). When real rates are high, the opportunity cost of holding a non-yielding asset like gold is also high, as investors can earn a handsome, risk-free return in government bonds. Conversely, when real rates are low or falling, the opportunity cost of holding gold diminishes, making it a more attractive investment.
For the past couple of years, central banks have been in a fierce battle against inflation, raising interest rates at an aggressive pace. However, the market is now increasingly looking ahead to the next phase of the cycle: rate cuts. While the timing is still a matter of debate, the consensus is that the next major policy move from the Fed and other major central banks will be to lower rates to support a slowing economy.
Hedge funds are front-running this anticipated pivot. They are accumulating gold now in expectation that falling interest rates in the future will provide a significant tailwind for its price. Even before the cuts materialize, the mere expectation of looser monetary policy is enough to fuel a rally. Furthermore, there is a persistent fear that central banks might make a policy error—either by keeping rates too high for too long and triggering a deep recession, or by cutting rates too soon and allowing inflation to become re-anchored. Either scenario is bullish for gold, which performs well during both economic downturns and periods of high inflation.
This speculative demand from hedge funds is layered on top of a powerful, long-term structural trend: voracious buying from the world's central banks. For several years, central banks, particularly those in emerging markets like China, India, and Turkey, have been steadily diversifying their foreign reserves away from the U.S. dollar and into physical gold. This "de-dollarization" trend is a strategic move to reduce dependence on the U.S. financial system and to hold a neutral reserve asset in an increasingly fractured world. This consistent, price-insensitive buying from official institutions creates a strong and stable floor of demand for gold, providing hedge funds with the confidence to build their own large, speculative positions on top of it.
Conclusion: A Resounding Vote for a Golden Future
The sharp increase in bullish gold bets by hedge funds is more than just a statistic; it is a story about risk, fear, and the search for security in an uncertain world. It reflects a growing consensus among sophisticated investors that the confluence of geopolitical turmoil, economic friction, and an impending shift in monetary policy has created a uniquely favorable environment for the precious metal.
These funds are acting as canaries in the coal mine, signaling a potential increase in market volatility and a flight to safety. Their aggressive positioning, backed by billions of dollars in capital, can become a self-fulfilling prophecy, driving prices higher and drawing in more waves of investors. As the world continues to grapple with deep-seated structural changes, the decision by the "smart money" to make its largest bullish wager on gold in months is a clear and resounding signal: in the quest for a safe harbor, all that glitters is, once again, gold.

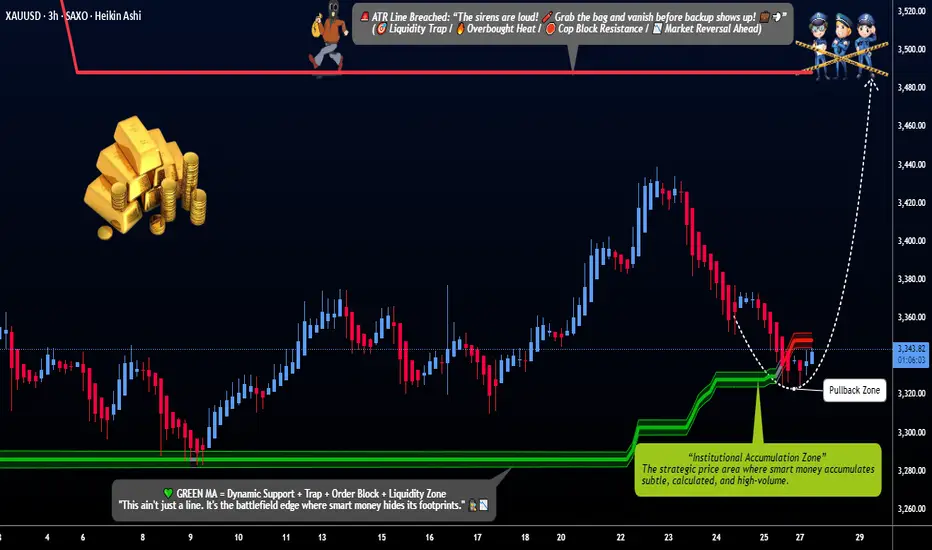
"XAU/USD Gold Heist Plan | Pullback Entry for Big Bullish Move"🔐💰“GOLD HEIST PLAN UNLOCKED: Thief Trader’s XAU/USD Breakout Blueprint”💰🔐
by The Market Robber a.k.a. Thief Trader – Stealing Pips, One Candle at a Time!
🌍 Hey Money Makers, Market Hustlers, Robbers, & Chart Crackers! 🌍
Bonjour! Hola! Marhaba! Hallo! Ola! What's poppin'?
Welcome to another exclusive robbery plan crafted in pure Thief Trading style—built off technicals, fundamentals, market psychology, and a bit of outlaw intuition. 💸⚔️
This one’s for the GOLD DIGGERS – literally. We’re targeting XAU/USD for a high-voltage bullish heist 🎯💥. Stick to the plan, follow the chart, and you might just make it out with a sack full of pips 💰🔥.
🔓 THE SETUP: GET READY TO ROB THE GOLD MARKET
We're eyeing a LONG ENTRY, with clear intent to break past the consolidation zone and avoid the trap laid by the "market police" at the ATR barricade zone 🚨. This level is where overbought drama and bear claws are strongest – we slip in, grab the profits, and bounce before they know what hit ‘em.
🧠 Use caution: This level is filled with liquidity traps, reversals, fakeouts and retail bait zones. Classic Thief style means we know where the guards are sleeping and where the cameras don't reach. 🎥🔕
💸 ENTRY PLAN:
🟢 Entry Zone: Watch for a pullback to 3320.00 or above. Don’t jump early.
💡 Tactics:
Use Buy Limit Orders (DCA / Layered Entry Style)
Drop them in on 15min/30min swing levels – catch price slipping into liquidity
Confirm with minor structure breaks / order block retests
🔔 Set those alerts – the real move happens when the breakout candle hits.
🛑 STOP LOSS STRATEGY:
🧠 Pro Rule: No stop-loss before breakout.
Once breakout confirms:
🔴 SL Zone: Recent swing low (approx. 3280.00) on the 4H chart
🎯 Adjust SL based on:
Lot size
Order count
Risk appetite
You know the game: manage your risk like a pro thief—quiet, calculated, and fast on the getaway. 💨
🎯 TARGET ZONE:
🏁 TP Zone: 3490.00
⚠️ Escape earlier if the pressure gets heavy – smart thieves never overstay the job.
🧲 SCALP MODE:
Only scalp LONG SIDE – don’t get caught chasing shorts unless you're rich enough to burn your drawdown 🔥
🔐 Use trailing SL to secure bags while climbing the ladder.
🧠 FUNDAMENTALS & MACRO EDGE:
The Gold market is currently in a BEAR structure with hints of bullish reversal potential. This heist isn’t just technical – it’s backed by:
🌍 Global Macro Flows
💼 COT Reports
📰 Sentiment & News Risk
💣 Geo-political Heat
📊 Intermarket Analysis (Dollar, Yields, Risk-On/Off correlations)
Dig deep for the full macro breakdown. Knowledge is leverage.
(Find full reports on reputable sources — you know where to look 👀)
🚨 RISK ALERT:
Before, During & After News Releases:
Avoid fresh entries 🔕
Use Trailing SLs to protect live trades
Watch spread spikes & low-liquidity traps
👉 Don't trade when the market's drunk.
💖 SHOW LOVE – BOOST THE PLAN:
💥Smash that Boost Button💥 if you want more precision heist strategies like this. Support the Thief Trading Style, and we’ll keep robbing the markets clean and teaching the crew how to get in & get out profit-heavy. 🏴☠️📈💰
🎭 I’ll be back with another chart crime scene soon. Until then, stay sneaky, stay profitable, and always move like the market’s watching (because it is). 😎
🔐 Thief Trader Out. Rob. Exit. Repeat. 🔁💸
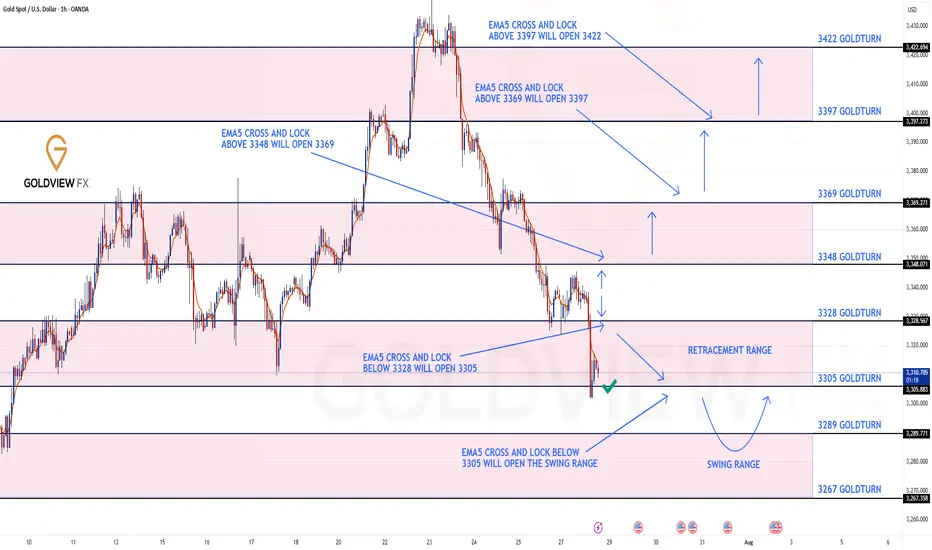
GOLD ROUTE MAP UPDATEHey Everyone,
Please see update on our 1H chart route map.
Gold continued its bearish momentum into today, hitting our bearish target at 3238, while leaving the 3348 bullish gap still open.
After a break below 3328, price followed through and hit 3305, entering our key retracement range, which gave the bounce to manage any premature positions on the top. We’re now watching closely for a reaction at this level.
A clean EMA5 cross and lock below 3305 will open the path toward the swing range.
However, failure to lock below this level could trigger a bounce from here.
This is a pivotal area for the next directional move.
We will keep the above in mind when taking buys from dips. Our updated levels and weighted levels will allow us to track the movement down and then catch bounces up.
We will continue to buy dips using our support levels taking 20 to 40 pips. As stated before each of our level structures give 20 to 40 pip bounces, which is enough for a nice entry and exit. If you back test the levels we shared every week for the past 24 months, you can see how effectively they were used to trade with or against short/mid term swings and trends.
The swing range give bigger bounces then our weighted levels that's the difference between weighted levels and swing ranges.
BULLISH TARGET
3348
EMA5 CROSS AND LOCK ABOVE 3348 WILL OPEN THE FOLLOWING BULLISH TARGETS
3369
EMA5 CROSS AND LOCK ABOVE 3369 WILL OPEN THE FOLLOWING BULLISH TARGET
3397
EMA5 CROSS AND LOCK ABOVE 3397 WILL OPEN THE FOLLOWING BULLISH TARGET
3422
BEARISH TARGETS
3328 - DONE
EMA5 CROSS AND LOCK BELOW 3328 WILL OPEN THE FOLLOWING BEARISH TARGET
3305 - DONE
EMA5 CROSS AND LOCK BELOW 3305 WILL OPEN THE SWING RANGE
3289
3267
As always, we will keep you all updated with regular updates throughout the week and how we manage the active ideas and setups. Thank you all for your likes, comments and follows, we really appreciate it!
Mr Gold
GoldViewFX
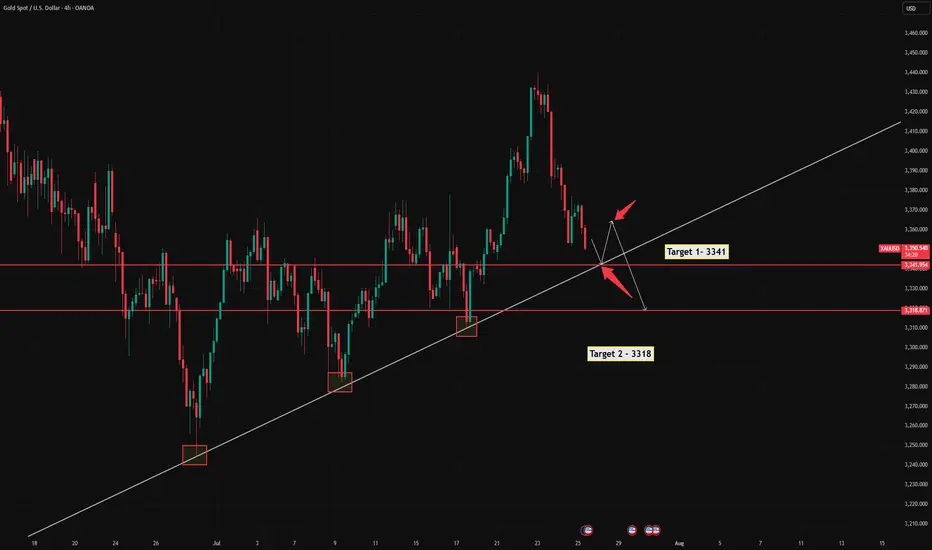
Gold XAUUSD Sell in trendline completion stageGold XAUUSD Sell in trendline completion stage - short term trade. now in 4th touch. bounce back to test previous level testing and return back to support again and it will break to test the sellers.
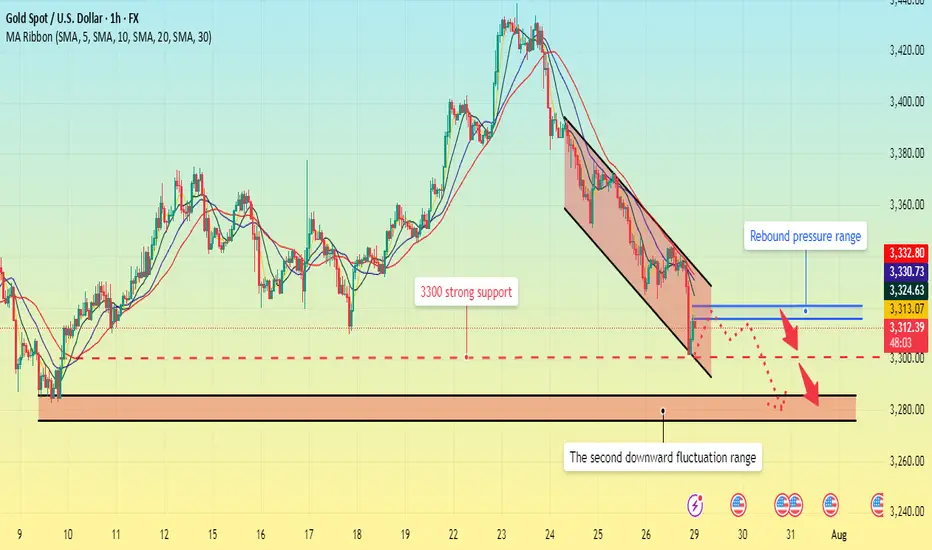
Gold fell below support. What will be the subsequent trend?The 1-hour moving average of gold continues to show a downward short position, indicating that the downward momentum is still sufficient; the wave pattern of gold's current decline remains intact, but the rebound strength is very weak, showing an obvious short trend of gold. Moreover, when gold rebounded in the short term, obvious resistance began to form above 3320, and the upward momentum was slightly insufficient.
From the daily chart, before 3300 fails to fall, it is likely to fluctuate around 3300-3350. On the contrary, if it falls below 3300, it is likely to reach the bottom of the 3385-3375 range.
This week is a super data week. The data of each day may affect the trend of gold on that day, but it will not form a unilateral strong trend. Therefore, the volatility before and after the data is released is likely to be large, so traders should focus on the following data:
1. US ADP employment report, US second quarter GDP preliminary value;
2. Federal Reserve interest rate decision;
3. US PCE annual rate, monthly rate;
4. The last trading day of this week will usher in non-agricultural data.
GOLD Continuation and ReversalIt still needs one more fall
Sell from 3348 to 3312
Buy from 3312 to 3392
GG

How to plan for the evening, pay attention to the 3300 markAfter the shorts took profits, gold consolidated in the 3310-3300 area. Judging from the daily chart, the decline in gold seems to have just begun, with the middle track of the Bollinger Band at around 3345 and the lower track at 3285. The possibility of falling below the 3300 mark cannot be ruled out in the evening. If gold falls below the 3300 mark, it may first hit 3295. If the decline continues, it may even hit the low of 3285-3275 below. However, if the 3300 mark can be effectively defended, then the possibility of maintaining the consolidation of 3300-3345 in the evening may be maintained. Therefore, it is not recommended to easily participate in transactions at the current position in the evening. It is mainly advisable to wait and see and pay attention to the breakthrough of the 3300 mark.
My premium privileges are about to expire, and subsequent trading strategies and analysis will be published in the group.

Secured The Dump on GOLDIn this video, I quickly go through how I managed to secure the dump on GOLD during the New York Session. It's not easy but it's simple.

Monday market forecast and analysis ideas#XAUUSD
There will be a lot of data next week, such as the 8.1 tariff deadline that I have repeatedly emphasized, the Federal Reserve decision, NFP data, etc. It can be said that it is relatively difficult to analyze purely from a technical perspective, because there is uncertainty in many data, the data results are often non-linearly correlated with market reactions (good news does not necessarily lead to a rise, and bad news does not necessarily lead to a fall), and large fluctuations can easily form oscillating K-lines with long upper and lower shadows. Therefore, the first arrangement for next week is to participate in trading with a light position and avoid letting emotions control your thinking.
The closing price on Friday was near 3337, proving that the short-term judgment on the rebound momentum of gold is correct, so there are two possible situations on Monday.
1. The first thing we need to pay attention to is 3345-3350 to determine whether it constitutes a short-term pressure level. The weekly line closed with a negative cross star. Combined with the monthly line trend, in terms of support, focus on the trend line support near this week's low of 3325. If this position is not broken, the market is expected to usher in a wave of rebound; if it falls below 3325, the bottom may look to 3310 or even 3295 for support.
2. The rebound momentum of Friday continued on Monday, breaking through 3350 first, and then it is possible to reach the previous high resistance area of 3370-3380. If it encounters resistance here, gold will continue to fall and fluctuate, and the target may even be 3310. If the price remains strong and issues such as interest rate cuts and tariffs are imminent, it means that the short-term downward trend has ended and may even set a new high.
The above content is only a forecast for Monday’s market. It will be greatly affected by data and news, and may be adjusted in real time next week based on intraday trends. You can refer to this, but remember not to be swayed by emotions. We will participate with a light position, and the specific trading strategy can wait for my trading signal.
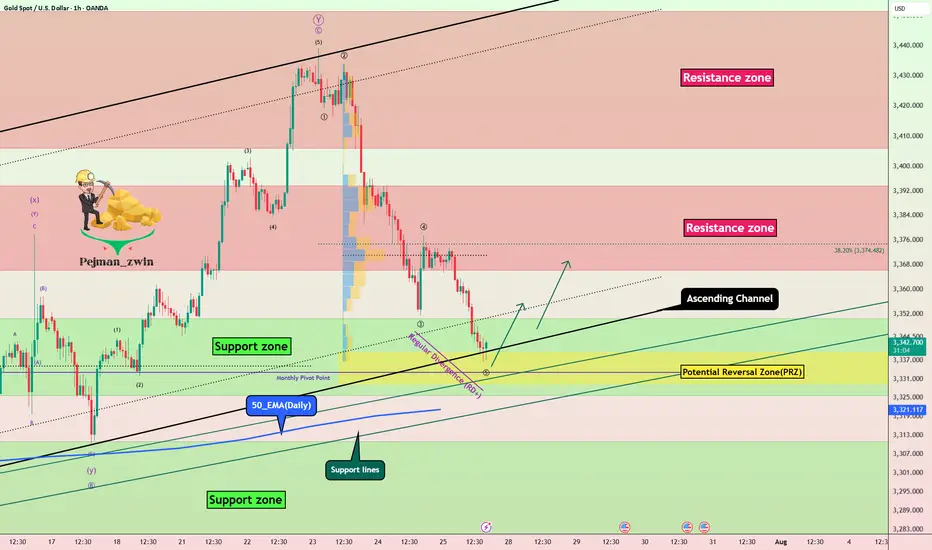
Gold Recovery Setup = Divergence + Support ClusterGold ( OANDA:XAUUSD ) fell to the lower line of the ascending channel and the Support zone($3,350-$3,326) , as I expected in my previous idea .
Gold is currently near a set of Supports .
Supports:
Support zone: $3,350-$3,326
Monthly Pivot Point: $3,333
Potential Reversal Zone(PRZ): $3,339-$3,329
Lower line of the ascending Channel
50_EMA(Daily)
Support lines
In terms of Elliott Wave theory , Gold appears to be completing a bearish wave 5 .
Also, we can see the Regular Divergence(RD+) between Consecutive Valleys .
I expect Gold to rise to at least $3,359 .
Second target: $3,367
Note: Stop Loss (SL) = $3,319
Do you think Gold can break the Support cluster by the end of trading hours?
Gold Analyze (XAUUSD), 1-hour time frame.
Be sure to follow the updated ideas.
Do not forget to put a Stop loss for your positions (For every position you want to open).
Please follow your strategy; this is just my idea, and I will gladly see your ideas in this post.
Please do not forget the ✅ ' like ' ✅ button 🙏😊 & Share it with your friends; thanks, and Trade safe.
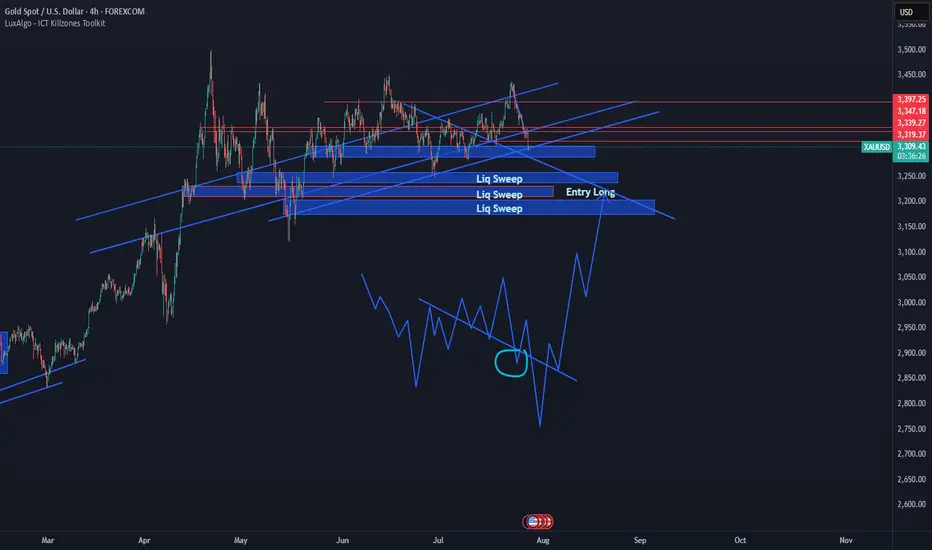
Gold (XAUUSD) - Liquidity Sweep Setup and Long Bias PlanPrice is currently respecting my projected structure and moving in line with expectations. I'm anticipating a deeper liquidity sweep into the marked demand zones below, where multiple liquidity pools are likely to be taken out. These areas have historically provided strong reactions.
🟦 Key Zones:
Three stacked liquidity sweep levels are highlighted, where previous lows and stop clusters are expected to be swept.
Watch closely for bullish reaction after liquidity grab in these zones.
🟢 Plan:
Looking for potential Entry Long after confirmation from the sweep and market structure shift.
Expecting price to accumulate, fake out with a final sweep (as sketched), and then launch upwards.
If the sweep completes and the structure confirms, targeting a strong bullish continuation move.
📈 Context:
Higher timeframe bullish structure still intact.
Setup aligns with ICT Smart Money Concepts – targeting liquidity and institutional order flow behavior.
💡 This idea will be updated as the setup develops. Trade safe and wait for confirmation.
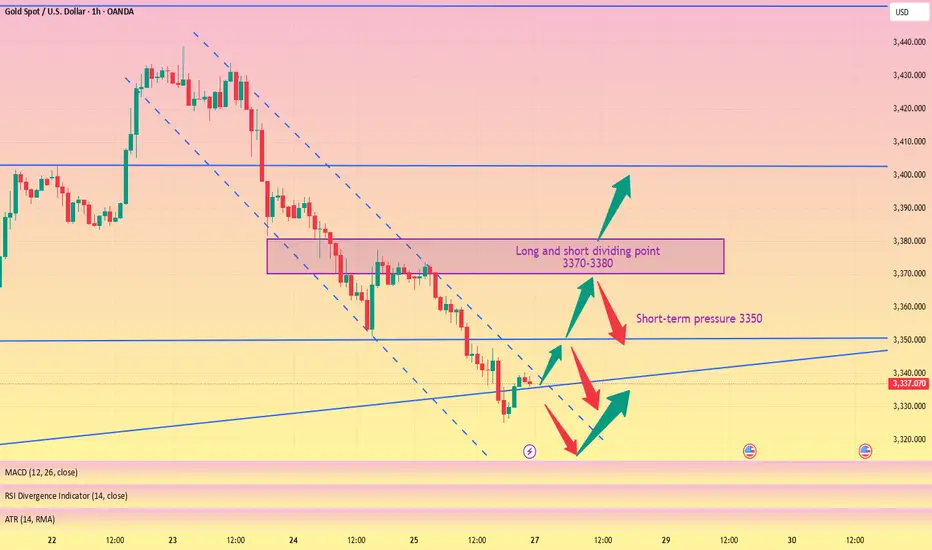
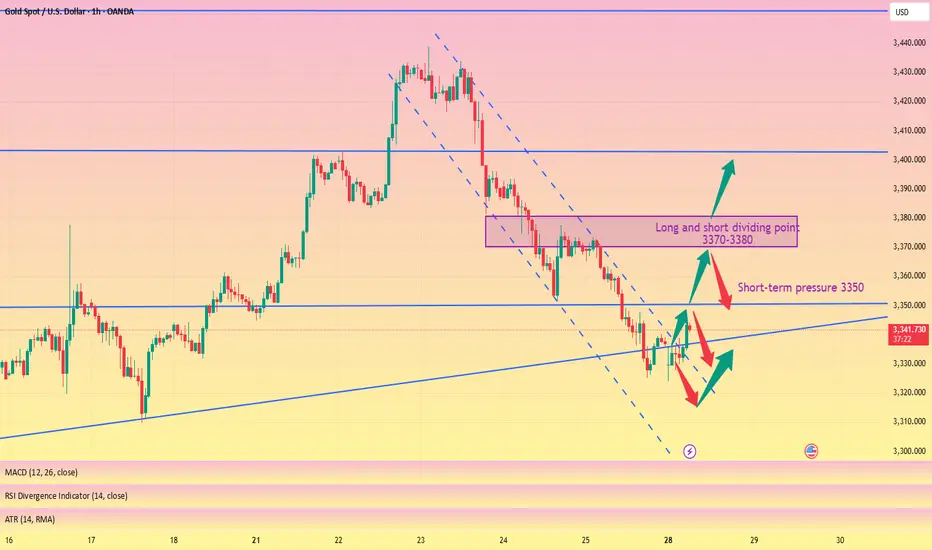
Pay attention to 3350 gains and lossesGood morning, bros. This morning gold again tested last week's low near 3325. From the chart, gold may continue to rise this week, with tariffs approaching, the Fed's interest rate cut, and NFP data imminent. The current strength and weakness are at 3350-3355. If it can effectively break through and stand above, it is expected to continue to test the previous high point, which is also the long-short dividing point of 3370-3380.
From the daily chart, there is not much change in the operational range of gold in the short term, and the change in the 4H chart is more obvious. After the decline in the early trading, it is now rebounding. There is a possibility of closing positive at the low. If it is directly positive on Monday, then it will bottom out directly at the beginning of the week. If it refreshes the low on Monday, the low point of 3285 will be seen below. Therefore, today's market focuses on the continuity of long and short. Of course, according to the current changes, the biggest possibility is to continue to rebound at the low point, pay attention to the support of 3310-3300 below, and pay attention to the gains and losses of the high point of 3355 above.

Excellent profits is closed 300 pips tp Hit I mentioned throughout Today's commentary session:
My strategy is still the same – sell from 3338-3340
Gold around my key level at 3345-3340, which the market respects well and as our first target was 3318 then 3305
Very happy with the profits so far.
My medium-term targets remain 3290 which is pending but 300 pips achieved alhumdullilah. I sold gold from every local high.
Also I mentioned 3340 turns retest and I opened my sell trades and 300 pips TP HIT PROFITS
All I say thanks to those who followed us and made profits.

The correction is quite surprise. What direction for GOLD price?✏️Quite surprised with the adjustment of gold at the end of the previous trading week. The rising price channel is still holding around the lower border of the price channel around 3316. A liquidity sweep and candle wick removal in this area is considered a good buying opportunity.
If h1 closes below this border, limit trading BUY signals until the bottom support of 3286. When the price can close the candle below 3316, gold will trade in a wide range and there is no main trend dominating the market.
📉 Key Levels
Support: 3316-3286
Resistance: 3372-3400-3418
Buy trigger: Reject and Trading above 3316
BUY DCA Break 3372
Target: 3400
SELL Trigger: Break bellow and Retest 3416
Leave your comments on the idea. I am happy to read your views.

Market forecasts are completely accurate, trading signals#XAUUSD
After opening today, gold tested the lowest point near 3324 and then rebounded, which is in line with my prediction of gold trend last night. Next, we need to pay attention to whether the upper 3345-3350 constitutes a short-term pressure level. If you are aggressive, you can consider shorting at 3345-3350, with the target at 3330-3325. Continue to hold if it falls below 3325, and stop loss if it breaks above 3350. After it breaks above, you can consider following up with a long order to close the position at 3360-3370. Short once at 3370-3380 for the first time, and stop loss if it breaks above 3380.
🚀 SELL 3345-3350
🚀 TP 3330-3325
🚀 BUY 3352-3355
🚀 TP 3360-3370
🚀 SELL 3370-3380
🚀 TP 3345-3325-3310
Be sure to study my trading strategy carefully. If you only look at the price points, you will definitely suffer certain losses. Participate in the transaction at the right time based on your own account funds and set stop losses.
XAUUSD on critical rangeGold is currently below rising channel also completion on Head& Shoulder on H4 time frame. DXY is recovering on weekly charts.
What's possible scanarios we have?
▪️today's not mych volume had been seen, still my stance are same H4 candle closed above 3345 ,I will be on bullish side till 3370-3380.
▪️Secondly H4 candle closing below 3330 this Parallel moves upside will be invalid and we have targets at 3310 then 3290 on mark.
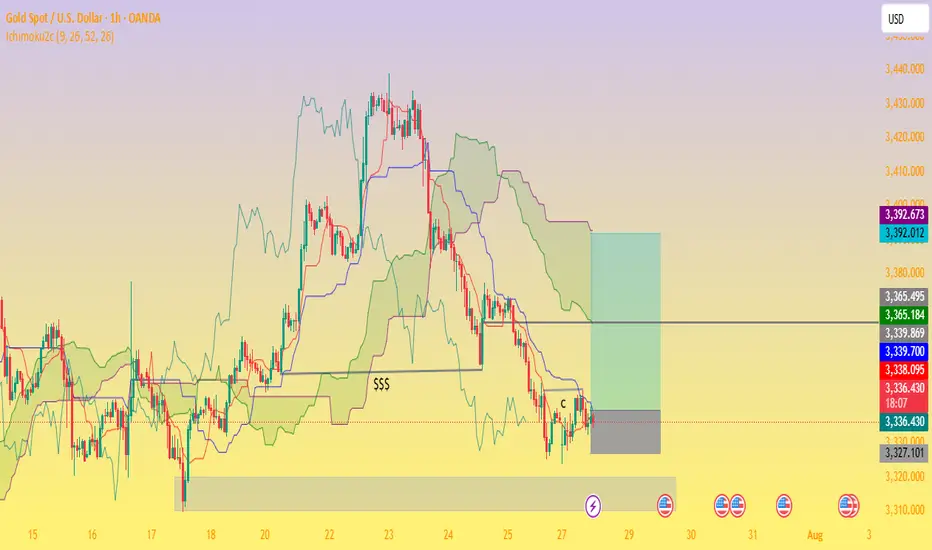
XAU/USD 1H – Range Consolidation Below Ichimoku Cloud. Chart Review & Technical Insight
1. Ichimoku Cloud & Overall Structure
Price is below the Ichimoku Cloud, with the cloud ahead sloping downward—indicative of bearish short‑term momentum and resistance overhead as long as the cloud holds above price.
The Kijun-sen (blue) line is above the Tenkan-sen (red), reinforcing the bearish bias on this timeframe.
2. Price Action & Key Zones
A support zone around 3,327–3,330 USD/oz is visible, underpinned by multiple rejection taps and price consolidation (“$$$” zone). A clean break below could open the path toward the 3,320’s or lower imbalance region.
On the upside, resistance lies near 3,339–3,340, backed by the cloud’s lower boundary and the Kijun-sen level.
The highlighted green rectangle appears to signal a potential bullish breakout target zone toward 3,365–3,392, contingent on recovery above the cloud.
3. Momentum & Trade Considerations
Momentum is weak, with price moving sideways inside a low‑volatility rectangle on diminishing volume and few directional impulses.
Possible ABC corrective structure is forming as marked, suggesting price may oscillate sideways or continue correcting within established bounds.
A bullish scenario would require clearing the Ichimoku Cloud and resistance at 3,340–3,360 USD.
Conversely, a bearish breakdown below ~3,327 could confirm continuation deeper into the 3,320s or toward the next significant demand zone near 3,300 USD.
.
✅ Summary
Bias: Slightly bearish to neutral until price can clear the Ichimoku Cloud.
Key Levels to Watch:
Support: 3,327–3,330 (immediate), then 3,320–3,300.
Resistance: 3,339–3,365, cloud top near 3,365, further target zone 3,392.
Scenarios:
Bullish breakout: Close above cloud → potential rally toward 3,365–3,392.
Bearish breakdown: Close below 3,327 → deeper correction toward 3,320 and lower imbalance areas.
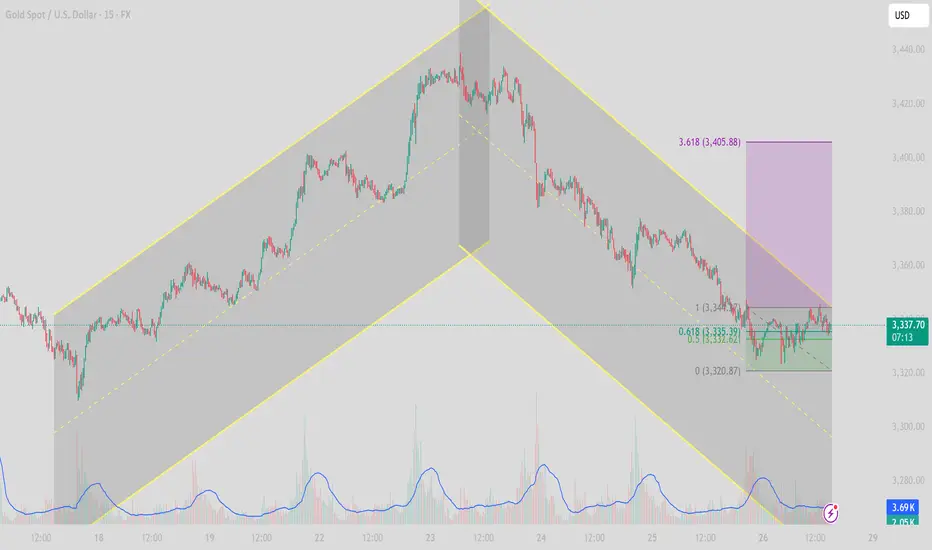
[XAUUSD] Gold Price Analysis July 28Symmetrical Channel Structure and High-Probability Trading Strategies
In today’s trading session (July 28), the XAUUSD 15-minute chart reveals a clear symmetrical channel pattern, indicating a technical correction after a previous strong uptrend.
1. Trend Structure
Phase 1 (July 18–23): Price moved within an ascending channel, forming higher highs and higher lows — a clear bullish structure.
Phase 2 (July 23–26): After peaking, price reversed into a descending channel, establishing a bearish sequence of lower highs and lower lows.
Currently, price is consolidating near the lower boundary of the descending channel, testing short-term support.
2. Key Support and Resistance Levels
Price Level
Technical Significance 3,360 – 3,365
Key resistance zone – top of descending channel 3,345
Dynamic resistance – EMA21 on M15 3,320 – 3,315
Crucial support zone – lower boundary of channel 3,300
Psychological support & prior swing low (July 10)
3. Price Action and Indicators
Volume has gradually decreased, signaling potential weakening of selling momentum.
RSI on M15 has rebounded from the oversold zone, currently moving above 40, suggesting a short-term technical bounce.
EMA21 & EMA50 are still sloping downward, confirming short-term bearish pressure.
4. Intraday Trade Scenarios
✅ Scenario 1: Rebound Play from Channel Support
Entry: 3,320 – 3,325 (after bullish confirmation candle)
Stop Loss: Below 3,312
Take Profit: 3,345 – 3,355 (resistance zone & mid-channel)
⚠️ Scenario 2: Trend-Following Short from Resistance
Entry: 3,345 – 3,350 (if price rejects at EMA21 or channel resistance)
Stop Loss: Above 3,360
Take Profit: 3,320 – 3,310
5. Strategy Outlook
XAUUSD remains in a corrective bearish phase after a strong rally. As long as the 3,312 level holds, there’s potential for a technical rebound during the London–New York session. However, sellers remain in control unless price breaks and closes above 3,360.
Follow for more real-time gold strategies. Save this post if you found it helpful!
XAG/USD on high time frame
"Hello, for investors in XAG/USD, the $37 zone appears to be a low-risk area for buying. Both technical and fundamental analyses suggest that the price is likely to move higher towards $48."
If you require further insights or have additional information to discuss, feel free to share!
