Analysis of technical prospects for gold prices!Market news:
In the early Asian session on Monday (July 28), spot gold bottomed out and rebounded. At the beginning of the session, it continued the decline of last Friday to around 3320. As the United States and Europe reached a trade agreement, the international demand for gold hedging further declined. However, the price of gold was supported by bargain hunting and quickly recovered most of the decline. It is currently trading around 3337 US dollars per ounce. As the global reserve currency, the trend of the US dollar is crucial to the price of gold. Last week, the US dollar index rebounded from a low of more than two weeks, significantly pushing up the cost of gold for overseas buyers. The progress of US-EU trade negotiations has become another major driver of the recent decline in London gold prices. Although the demand for hedging has been suppressed in the short term, geopolitical uncertainty still provides long-term support for gold. At the same time, the trend of global central banks buying gold provides a solid bottom support for gold.Looking ahead to this week, the economic calendar will provide several high-impact data releases. The Federal Reserve will announce its monetary policy decision after the policy meeting on July 29-30. On Friday, the US Bureau of Labor Statistics will release the July employment report. If the number of non-farm payrolls (NFP) increases by more than 100,000, it may indicate that the labor market is in good enough condition that the Fed can prioritize controlling inflation and supporting the dollar when making policies. If the new non-farm payrolls data reaches or falls below 70,000, the dollar may find it difficult to find demand before the end of next week and help gold gain bullish momentum.
Technical analysis:
Technically, the gold daily chart forms a continuous negative structure, and the New York closing price re-loses the key support of the MA10-day moving average at 3360 and the middle track of the Bollinger Band. The RSI indicator breaks through the middle axis and runs in a short-term ... Pay attention to the rebound repair after selling low opening at the beginning of the gold week. The main idea is to sell at a high price and buy at a low price as an auxiliary.
Today's analysis:
Gold rebounded after opening low in the Asian session. Gold continued to refresh the low point. Then gold was obviously still in a selling trend. Since gold is still in a selling trend, it will continue to sell to the end. Gold rebounded in the Asian session and continued to sell. Gold continued to sell under pressure in the Asian session. Gold waited patiently for 3350 to continue selling in the Asian session. Gold's 1-hour moving average continued to cross downward and arranged for selling. There was basically no obvious rebound in this round of gold's decline. Then gold was likely to continue the short selling trend after the rebound correction. The wave structure of gold's current decline remained intact. Gold continued to sell under pressure near the last low of 3350.
Operation ideas:
Buy short-term gold at 3309-3312, stop loss at 3300, target at 3340-3360;
Sell short-term gold at 3350-3353, stop loss at 3362, target at 3320-3300;
Key points:
First support level: 3320, second support level: 3306, third support level: 3292
First resistance level: 3346, second resistance level: 3358, third resistance level: 3467
Goldprediction
The US and Europe reached an agreement. Gold rebounded.At the current node, the EU and the US reached a tariff cooperation, 15% tariff + 600 billion US dollars for investment in the United States. The additional tariffs are considered a big deal, and the US has become the winner again this time.
Of course, this is a small negative for the current gold market.
From a multi-period analysis, the monthly chart price is still in a reverse K state. For the current situation, we need to pay attention to the gains and losses of the monthly highs and lows. The weekly chart shows that the price has continued to fluctuate at a high level recently. As time goes by, the weekly watershed is temporarily at 3320. After last week's high and fall, there is currently a further downward performance.
The four-hour chart shows that the price has continued to be suppressed after breaking through the four-hour support last Wednesday. The four-hour level resistance is currently around 3355, and the resistance level has moved up compared with the early Asian market. Therefore, we will pay attention to the pressure at this position in the future. If it fails to break through for a long time, it is likely to fall directly under pressure; pay attention to the support range of 3320-3310 below.

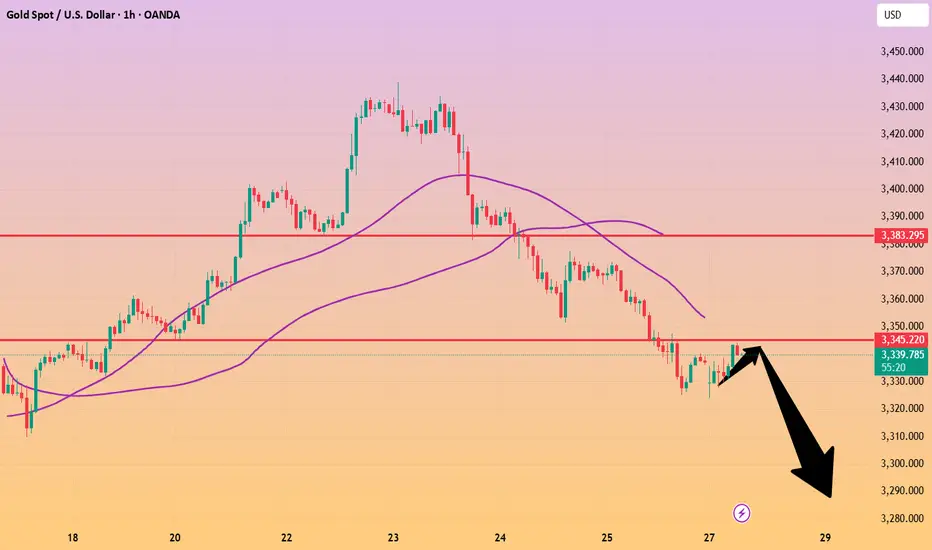
Gold remains unchanged. Still weak.Last Friday, gold rebounded around 3373, but the bullish momentum was insufficient, and then it bottomed out and fell sharply. The price fell below the short-term rising trend line support. At present, the MA5-10 daily moving average is in a high dead cross short arrangement. On this basis, Quaid believes that gold can still be bearish now. At present, the Asian market continues to fluctuate downward in the early trading. Today, we will focus on the support of 3310-3300.
The short-term price is currently maintained at around 3335, which can be regarded as the watershed between long and short today. If the European session stabilizes above the MA50 moving average, the trend will change to a certain extent. Now we still look at the bottom near 3300.
Operation strategy:
Short near 3340, stop loss 3350, profit range 3310-3300.
XAU/USD(20250728) Today's AnalysisMarket news:
Trump announced that the US and Europe reached a trade agreement: 15% tariffs on the EU, $600 billion in investment in the US, zero tariffs on the US by EU countries, the EU will purchase US military equipment, and will purchase US energy products worth $750 billion. However, the US and Europe have different statements on whether the 15% tariff agreement covers medicines and steel and aluminum. Von der Leyen: The 15% tariff rate is the best result that the European Commission can achieve.
US Secretary of Commerce: The deadline for tariff increases on August 1 will not be extended. The United States will determine the tariff policy on chips within two weeks.
Technical analysis:
Today's buying and selling boundaries:
3345
Support and resistance levels:
3393
3375
3363
3326
3315
3297
Trading strategy:
If the price breaks through 3345, consider buying in, the first target price is 3363
If the price breaks through 3326, consider selling in, the first target price is 3315

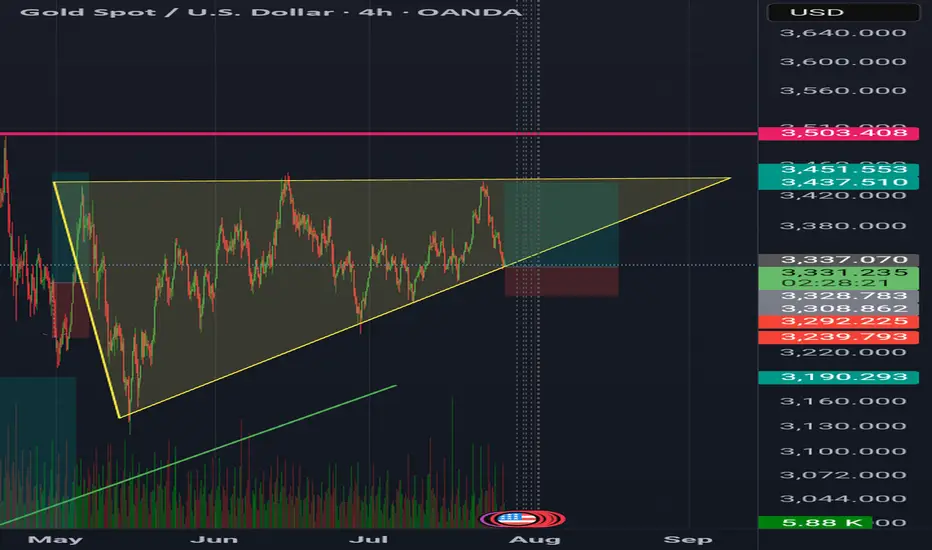
GoldXau usd daily analysis
Time frame 4 hours
Gold is moving up and down in the yellow triangle, you can see on the chart
I think Gold move up to 3450 $ and if we have no positive news, it will drop to the down side. This analysis has good benefit and Risk rewards ratio is 3
On the other hand if Gold break the 3320 $ my analysis is faild and must listen to the economic news
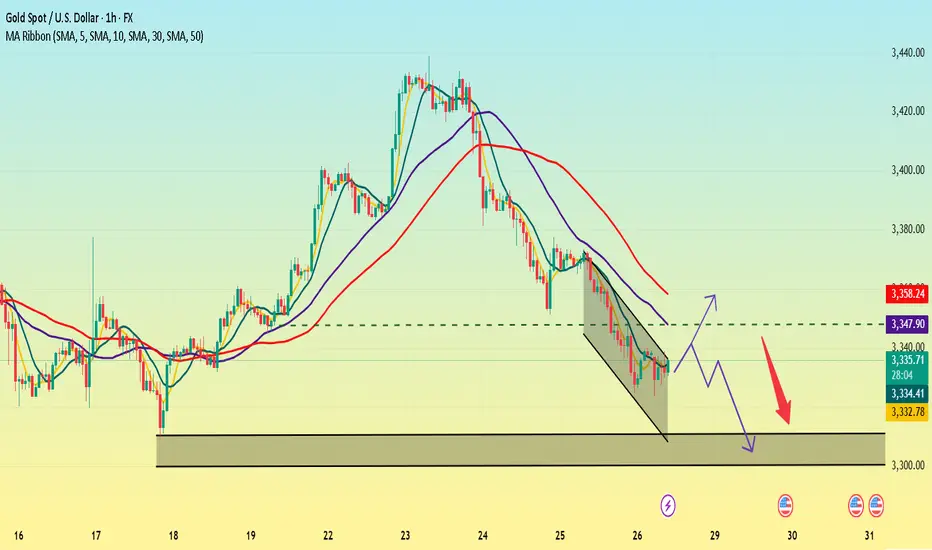
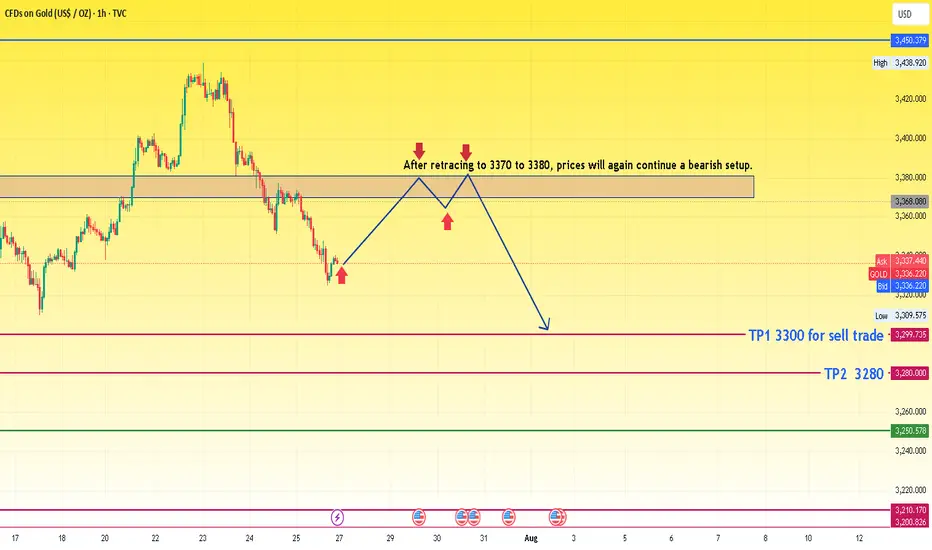
XAUUSD idea for upcoming weekThe chart presents a bearish outlook for gold based on a retracement and continuation pattern. Here's a detailed analysis:
🔍 Chart Summary:
Current Price: Around 3336
Bias: Bearish (after retracement)
Resistance Zone: 3370 – 3380
Sell Confirmation Area: Upon rejection from the 3370–3380 resistance zone
Target 1 (TP1): 3300
Target 2 (TP2): 3280
📈 Technical Structure:
Recent Trend:
The price has dropped sharply from its recent peak.
Now it's attempting a pullback to previous support, which has turned into a resistance zone (3370–3380).
Price Action Expectation:
A retracement is expected toward 3370–3380.
If the price gets rejected from this resistance block, the chart suggests the formation of a lower high.
After rejection, a bearish continuation is expected.
Projected Move:
Short entry around the resistance zone.
Targets:
TP1: 3300 (intermediate support)
TP2: 3280 (major support)
🧠 Trade Idea Logic:
The chart follows a classic bearish price action setup: impulse → retracement → continuation.
The consolidation and break area has flipped from support to resistance.
The retracement zone is clearly defined, making it a high-probability area for reversal if bearish signals (e.g., rejection candles) form.
⚠️ Key Considerations:
Wait for confirmation: Do not enter blindly at 3370–3380. Look for rejection patterns (like a bearish engulfing or pin bar).
Volume and fundamentals: Watch for economic data or geopolitical news that might invalidate the technical setup.
SL Suggestion: Above 3385 or 3390 to allow some room for wick spikes.
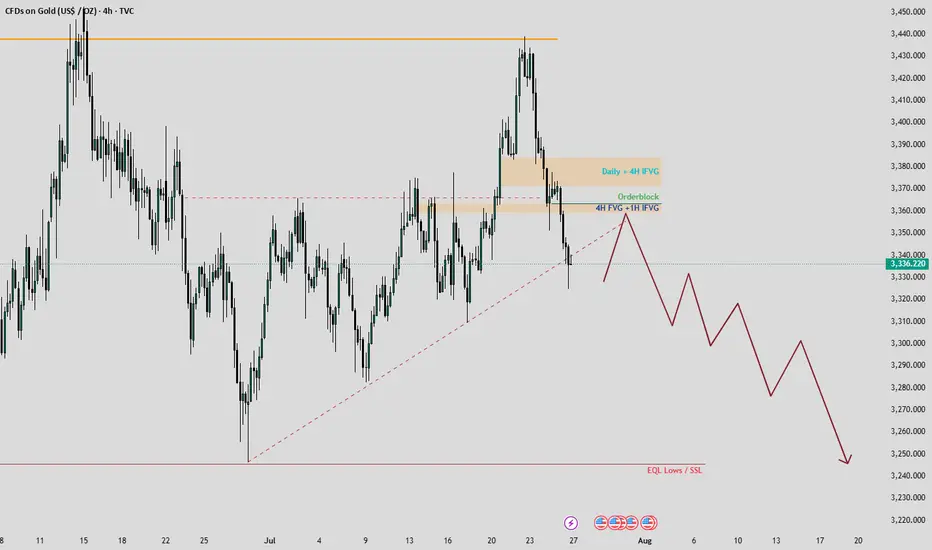
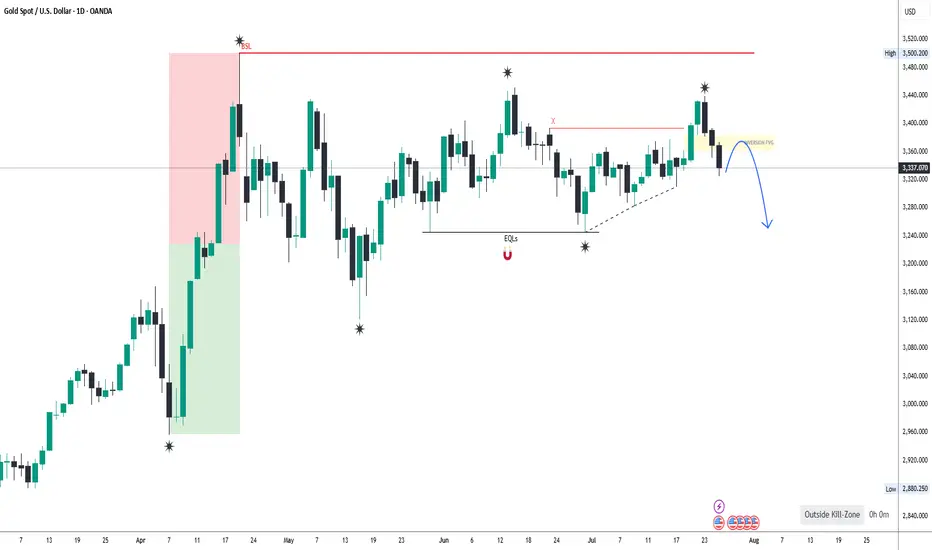
Gold Market Analysis: Seize the Bearish Opportunity!Hello, amazing traders! 📊 Last week, gold put both buyers and sellers through a rollercoaster, peaking at $3,439 on Monday and Tuesday before a sharp decline shook the market. The chart reveals a classic triangle pattern with a sneaky false breakout, designed to trap the unwary. Now, with the upside liquidity swept away, a bearish move is on the horizon—let’s break it down!
📈 Chart Insights
Take a look at the attached chart! Gold’s recent action highlights:
False Breakout: The price tricked traders with a brief surge, only to reverse sharply.
Target Zone: Equal Lows at $3,240 are the next key level to watch.
Retracements: Expect a pullback to the $3,360-$3,365 range, where order blocks, 4H Fair Value Gaps (FVG), and Hourly Imbalance Fair Value Gaps (IFVG) form a powerful demand zone.
🎯 Trading Plan
Entry Point: Prepare to short around $3,360-$3,365 as gold retraces to this strong PD Array.
Stop Loss: Place above $3,385 to avoid the daily and 4H FVG zone ($3,375-$3,385), which should act as resistance.
Target: Aim for $3,240, the Equal Lows, with updates on short-term targets to follow.
Note: The $3,375-$3,385 range is a balanced zone—unlikely to be revisited soon.
🚨 Why Act Now?
This setup offers a golden (or should I say bearish gold?) chance to capitalize on the market’s momentum. The chart’s clear levels and the false breakout signal a high-probability move. Stay tuned for real-time updates as we track this trade!
💬 Join the Conversation!
Loved this analysis? Hit the Like button to show your support! ❤️ Follow me for more actionable insights, and drop a comment below—where do you see gold heading next? Let’s build a thriving TradingView community together! 🙌
Happy trading, and may your trades be as sharp as this analysis! ✨
Gold at crucial 0.61 FIB3340 is super crucial level for gold. lets see how the first 4H candle behaves. if it breaks 3340 decisively, then we can easily long gold else 3275 is nearby looking.
But considering Aug-1, tariff date coming near, i expect flat market till 30th and major volatility coming from Aug 1st, it might push gold to ATH this time.

Gold is weak. It may break through next week.This week, gold rose and fell, rising for two consecutive days on Monday and Tuesday, and falling for three consecutive days from Wednesday to Friday. The weekly line finally closed with a small real body negative line with a long upper shadow.
Gold's trend this week was due to the strengthening of the US dollar and the progress in US-EU trade negotiations, which hit the safe-haven demand, leading to a decline in gold prices.
Next week, focus on multiple time points that may trigger market trends, including the Federal Reserve's decision, non-agricultural data, the August 1 tariff deadline, and the economic and trade talks between Chinese representatives in Sweden and the United States. These events may set the tone for the market in the second half of the year and need to be paid attention to.
At the beginning of this week, we focused on the triangular convergence pattern formed by the high and low points since 3500 points. On Tuesday, gold broke through the pattern upward, but failed to stand firm on Wednesday. Instead, it fell to form a false breakthrough, and on Friday it fell to the lower edge of the triangular convergence range. However, from the perspective of the international futures market, the overall situation is still in the triangular convergence pattern and has not achieved an effective upward breakthrough. Based on this, we need to continue to keep a close eye on the changes in the triangle convergence pattern next week. The direction of its next breakthrough will have an important impact on the short-term trend.
Operation strategy:
Short near 3350, stop loss 3360, profit range 3320-3315. If the price continues to fall, you can hold a small position, and the area near 3300 is likely to be touched.

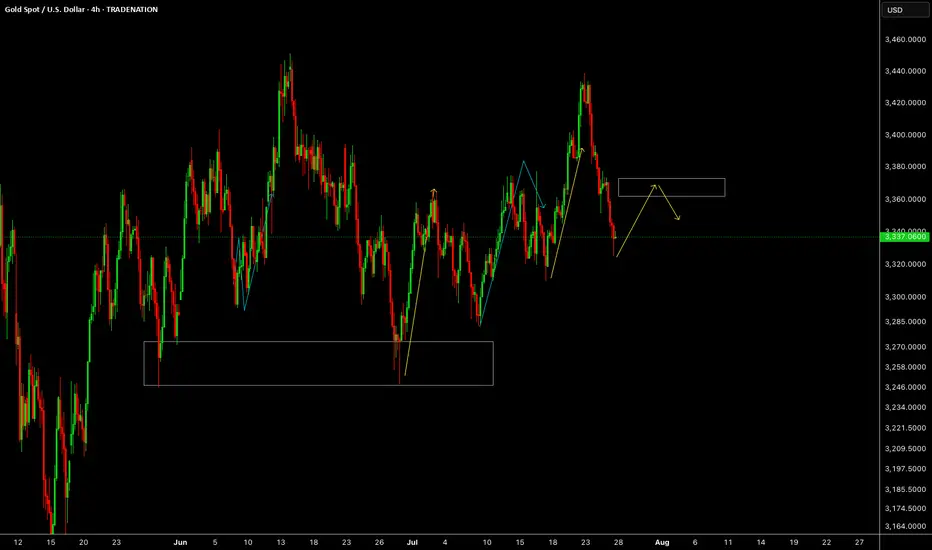
GOLDGOLD looks like it will be giving us correction or impulse up early part of this week. Reaction will be above 3360.
Disclosure: We are part of Trade Nation's Influencer program and receive a monthly fee for using their TradingView charts in our analysis.
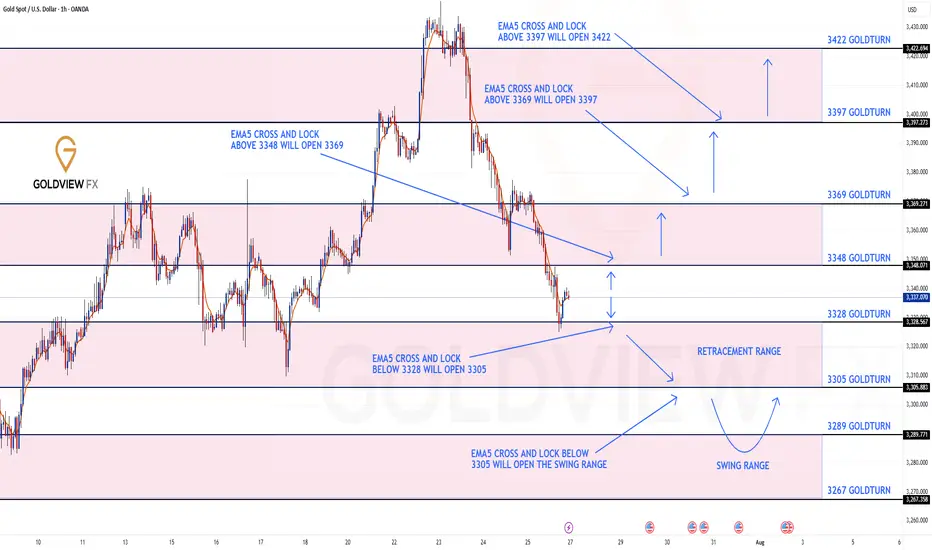
GOLD 1H CHART ROUTE MAP UPDATE & TRADING PLAN FOR THE WEEKHey Everyone,
Please see our updated 1h chart levels and targets for the coming week.
We are seeing price play between two weighted levels with a gap above at 3348 and a gap below at 3328 . We will need to see ema5 cross and lock on either weighted level to determine the next range.
We will see levels tested side by side until one of the weighted levels break and lock to confirm direction for the next range.
We will keep the above in mind when taking buys from dips. Our updated levels and weighted levels will allow us to track the movement down and then catch bounces up.
We will continue to buy dips using our support levels taking 20 to 40 pips. As stated before each of our level structures give 20 to 40 pip bounces, which is enough for a nice entry and exit. If you back test the levels we shared every week for the past 24 months, you can see how effectively they were used to trade with or against short/mid term swings and trends.
The swing range give bigger bounces then our weighted levels that's the difference between weighted levels and swing ranges.
BULLISH TARGET
3348
EMA5 CROSS AND LOCK ABOVE 3348 WILL OPEN THE FOLLOWING BULLISH TARGETS
3369
EMA5 CROSS AND LOCK ABOVE 3369 WILL OPEN THE FOLLOWING BULLISH TARGET
3397
EMA5 CROSS AND LOCK ABOVE 3397 WILL OPEN THE FOLLOWING BULLISH TARGET
3422
BEARISH TARGETS
3328
EMA5 CROSS AND LOCK BELOW 3328 WILL OPEN THE FOLLOWING BEARISH TARGET
3305
EMA5 CROSS AND LOCK BELOW 3305 WILL OPEN THE SWING RANGE
3289
3267
As always, we will keep you all updated with regular updates throughout the week and how we manage the active ideas and setups. Thank you all for your likes, comments and follows, we really appreciate it!
Mr Gold
GoldViewFX
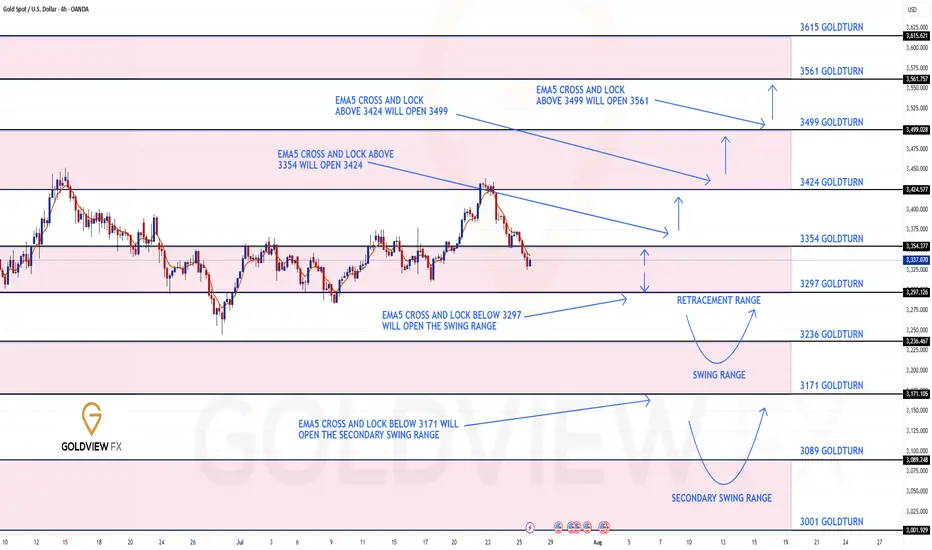
GOLD 4H CHART ROUTE MAP UPDATE & TRADING PLAN FOR THE WEEKHey Everyone,
Please see our updated 4h chart levels and targets for the coming week.
We are seeing price play between two weighted levels with a gap above at 3354 and a gap below at 3297. We will need to see ema5 cross and lock on either weighted level to determine the next range.
We will see levels tested side by side until one of the weighted levels break and lock to confirm direction for the next range.
We will keep the above in mind when taking buys from dips. Our updated levels and weighted levels will allow us to track the movement down and then catch bounces up.
We will continue to buy dips using our support levels taking 20 to 40 pips. As stated before each of our level structures give 20 to 40 pip bounces, which is enough for a nice entry and exit. If you back test the levels we shared every week for the past 24 months, you can see how effectively they were used to trade with or against short/mid term swings and trends.
The swing range give bigger bounces then our weighted levels that's the difference between weighted levels and swing ranges.
BULLISH TARGET
3354
EMA5 CROSS AND LOCK ABOVE 3354 WILL OPEN THE FOLLOWING BULLISH TARGETS
3424
EMA5 CROSS AND LOCK ABOVE 3424 WILL OPEN THE FOLLOWING BULLISH TARGET
3499
EMA5 CROSS AND LOCK ABOVE 3499 WILL OPEN THE FOLLOWING BULLISH TARGET
3561
BEARISH TARGETS
3297
EMA5 CROSS AND LOCK BELOW 3297 WILL OPEN THE SWING RANGE
3236
3171
EMA5 CROSS AND LOCK BELOW 3171 WILL OPEN THE SECONDARY SWING RANGE
3089
3001
As always, we will keep you all updated with regular updates throughout the week and how we manage the active ideas and setups. Thank you all for your likes, comments and follows, we really appreciate it!
Mr Gold
GoldViewFX
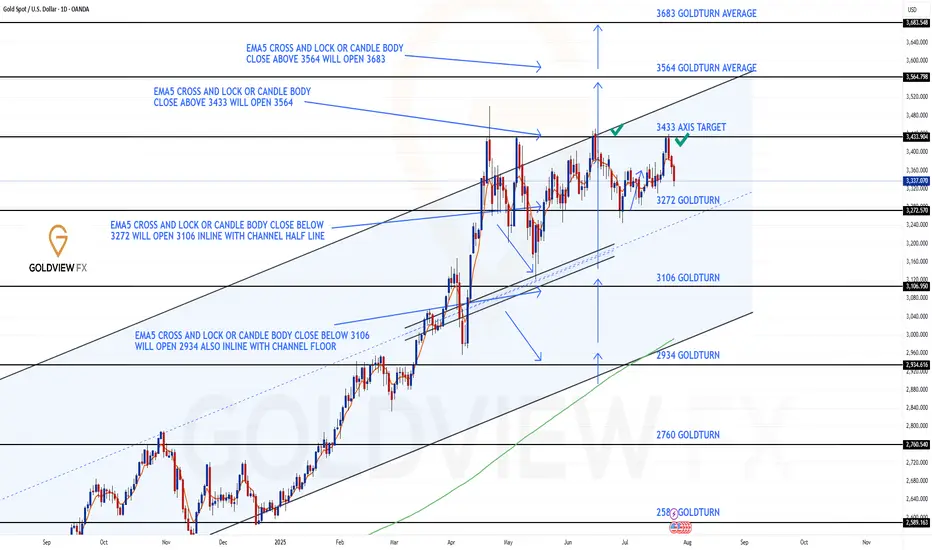
GOLD DAILY CHART ROUTE MAPHey Everyone,
Daily Chart Update – Bounce + Rejection: Structure Still Dominates
Just a quick follow up on our range structure, we got exactly what we were anticipating.
Price gave us the perfect bounce off 3272, launching into 3433 for THE test of resistance. That move delivered another clean 160+ pip rotation, once again showing how laser accurate the structure has been.
As expected, 3433 held as resistance, and the lack of a break and hold above confirms another clean rejection. The range between 3272 support and 3433 resistance remains firmly in play, and structure continues to govern price action to the pip.
Here’s where we are now:
🔹 Range Still Active
Price continues to rotate inside our 3272–3433 box. Until we see a clean break and close beyond either boundary, we’ll keep playing the range.
🔹 No Breakout = No Change
The failure to break and lock above 3433 confirms rejection. We’re still looking for EMA5 lock for potential breakout confirmation, until then, range trades rule.
🔹 Precision Holds
Both 3272 and 3433 have now been tested and held perfectly. The respect these levels continue to show reaffirms their importance in our roadmap.
Updated Key Levels
📉 Support – 3272
Continues to act as a major pivot. Valid long entries remain on dips into this zone, unless a breakdown occurs.
📈 Resistance – 3433
Now officially tested and confirmed. Watching closely for any future breakout attempts or another rotation lower.
Thanks again for all the amazing support. Sticking to the plan, trading the structure, and staying disciplined.
Mr Gold
GoldViewFX
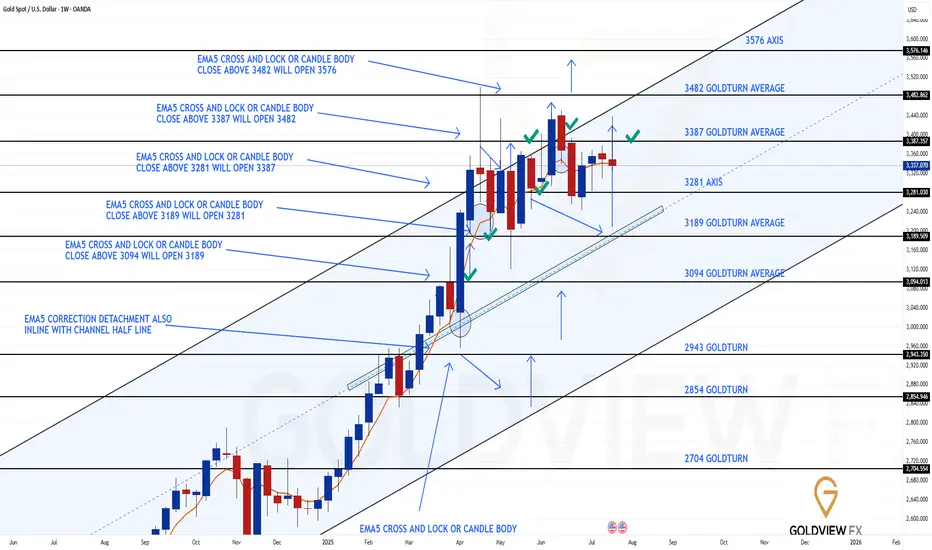
GOLD WEEKLY CHART MID/LONG TERM ROUTE MAPHey Everyone,
Weekly Chart Update – 3387 Tested, Channel Top Rejected
Quick follow up on our Weekly Chart roadmap – price continues to respect the structure with precision.
As anticipated, we got the test of 3387, completing the short term magnet move we've been tracking. That level aligned perfectly with the channel top, and true to form, we saw a clean rejection right on cue just short of the full channel top leaving that open.
Importantly, there was no close or lock above that zone, reaffirming it as valid resistance for now. As a result, the range remains active, with price still oscillating between 3281 support and 3387 resistance.
Key structural notes:
🔹 Structure remains intact
No weekly close above 3387, no breakdown below 3281. The rising channel is still fully respected, and EMA5 has yet to turn bearish.
🔹 3281 Holding Strong
This level continues to act as a key weekly pivot. As long as it holds, we maintain a constructive outlook within the current range.
🔹 3387 Tested + Rejected
First test gave us the expected reaction. Until we see a confirmed close above, it remains the top of the current range.
Updated Levels to Watch:
📉 Support – 3281
Weekly pivot and current range low. Still our key area for dip buys within this structure.
📈 Resistance – 3387
Now tested and confirmed. No break or lock above = valid rejection level.
📈 Resistance 2 – 3482
Unfilled weekly gap. Still the broader target, but we need a proper breakout above 3387 first.
Plan: We continue to treat 3281–3387 as the active weekly range. If 3281 fails, we reassess at the midline of the channel. If 3387 breaks and holds, we shift focus toward 3482.
Thanks again for all the incredible engagement and support, it means a lot to us here at GoldViewFX. Stay focused, stay disciplined.
Mr Gold
GoldViewFX
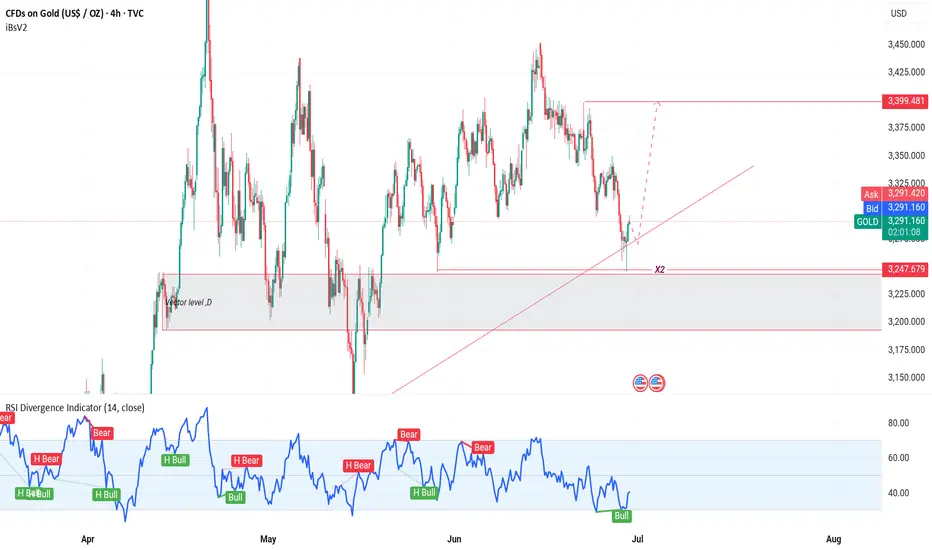
Gold on high time frame
"Hello traders, focusing on gold, the price recently swept liquidity around $3,250 and displayed strong signals indicating a potential upward movement. The next target could be around $3,400."
If you need further clarification or have more details to discuss, feel free to share!
XAUUSD BearishGold, Price have been moving side-ways taking out internal highs & lows inside PREMIUM, now we have clean lows that are still intact with equal lows near equilibrium. I would like to see price dropping low to take out liquidity resting below those previous lows and drop into DISCOUNT.
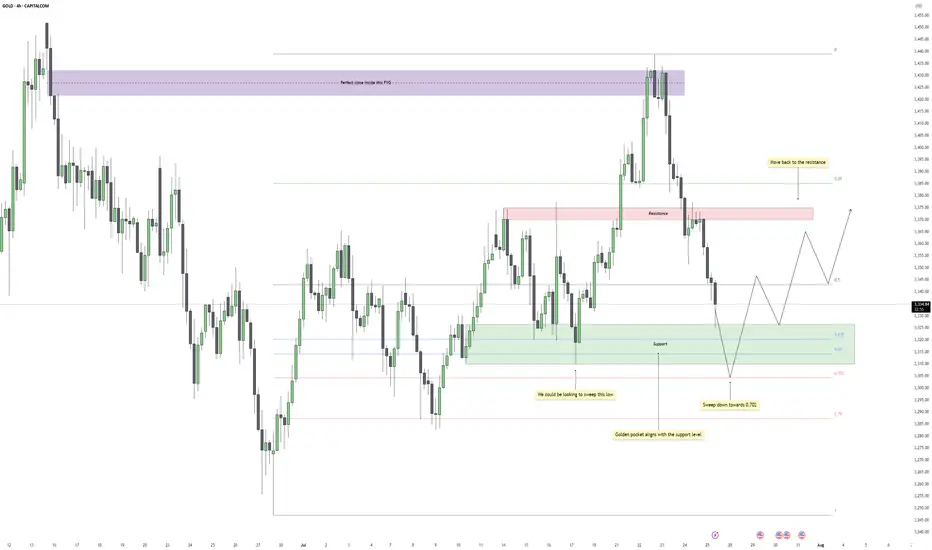
Gold - Eyes on the Final Flush Before ReclaimGold recently dropped after reacting perfectly inside a higher time frame fair value gap. That zone acted as clean supply, offering a precise close within the imbalance and initiating a strong bearish leg. The move confirmed that buyers were overwhelmed at that level, and price began its descent back into a broader consolidation range.
Support Cluster and Fibonacci Alignment
The current zone being tested holds significant weight. Price has tapped into a clear support region, one that has already caused multiple strong bounces in recent sessions. What adds further confluence is the alignment of this zone with the golden pocket region of the entire upward leg. This kind of technical overlap increases the chances of responsive buying once liquidity is cleared below.
Liquidity Target and Inducement Setup
Just below current price action, there's a clean low that hasn't been taken out yet. This low acts as the inducement, sitting right above deeper Fibonacci levels, especially the 0.702. If price continues lower in the short term, a sweep of that low into the golden pocket would provide the ideal liquidity grab before a reversal. The market often rewards those who wait for that final flush.
Bullish Recovery Path
Once the liquidity is taken and price stabilizes at the golden pocket zone, the path is open for a recovery move back into the midrange and potentially higher. The most likely magnet for price after a successful bounce would be the previous resistance zone, which coincides with the 0.5 retracement of the recent drop. That area should act as the next decision point and could either cap the rally or provide the base for a continuation if buyers show strength.
What I’m Watching
The cleanest scenario would be a sweep of the low just below support, ideally pushing into the lower green box near the 0.702 level, followed by a strong bullish reaction. I’ll be watching for a market structure shift on the lower timeframes at that point to confirm the entry. If that happens, the trade has room to develop back into the prior resistance zone, offering a solid range for intraday or swing setups.
Conclusion
Gold remains in a broader range for now, but the technicals suggest one more drop to clear late long positions before a recovery. The reaction at the support cluster will be crucial. If bulls step in after the sweep, there’s a high-probability path back toward resistance, with the move likely supported by the golden pocket confluence.
___________________________________
Thanks for your support!
If you found this idea helpful or learned something new, drop a like 👍 and leave a comment, I’d love to hear your thoughts! 🚀
Analysis of gold price trend next week!Market news:
This week, international gold recorded its biggest weekly decline in a month. Spot gold turned sharply lower after a sharp rise and finally closed lower. Signs of progress in US-EU trade negotiations hit the safe-haven demand for London gold prices. Geopolitical situation is also a factor in the downward trend of gold prices. On the 25th local time, Tahir Noonu, a senior Hamas official, said that Hamas was absolutely positive about the efforts of the relevant mediators, but was surprised by the US statement. Before the United States and the European Union made progress in trade negotiations, fund managers raised their bullish bets on gold to the highest level since April this year. The trade war has pushed gold prices up 27% this year. Although the easing of trade tensions will weaken safe-haven demand, gold has also been supported by strong buying from central banks.Next week, international gold prices will focus on US-EU and US-China trade negotiations. If the negotiations are optimistic, gold prices may continue to test the $3,300/ounce mark; in addition, focus on the Federal Reserve's resolution. After Trump's visit to the Federal Reserve headquarters, whether the Federal Reserve will maintain its independence will be highlighted in this resolution. Non-agricultural data will also be released on Friday, which needs attention.
Technical Review:
From the weekly gold level, gold is still in a wide range of 3500-3120. It has been fluctuating for ten weeks. The Bollinger Bands are gradually shrinking. MA5 and MA10 are running horizontally, indicating that gold fluctuations will continue. This time, gold stabilized and rose from 3247 to 3438 and then fell back. The current short-term range is 3247-3438! Next week, pay attention to the range of fluctuations and choose a new direction after the narrowing. The daily level is currently in the 4th wave adjustment. There is a high probability that there will be a 5th wave rise after the adjustment, and then a large-scale ABC adjustment will be started. At present, there are two changes in the structure of the 4th wave, one is the triangle contraction and the other is the ABC structure. No matter how it runs, the market outlook is to wait for low-level long positions to see the 5th wave rise. In the short term, gold is still oscillating and selling.
Next week's analysis:
Gold is still adjusting, but it has basically adjusted in place. The current daily price has also adjusted to the key support level of 3300. Similarly, the four-hour chart just stepped back to the upward trend line support, which is the short-term long order entry. Buy above the 3300 mark next week! Next week, gold is expected to further test the 3310-3280 support level. Gold at the 4-hour level peaked at 3438 and then fell back. It has now formed a unilateral trend. The K-line is under pressure from the 5-day moving average and continues to set new lows, and breaks the short-term upward trend line. The Bollinger band opens downward and diverges, and the MACD water cross diverges downward to underwater, indicating that the current gold trend is in an absolute weak position! Next, gold will continue to test the support near the previous low of 3300. If 3300 is not broken, gold buying will continue to have momentum. If 3300 is broken, the short-term rise will end, and the subsequent rebound will basically be just a correction. However, the current 4-hour green column shows signs of shrinking volume, so it is not easy to sell at a low level. Try to sell after the rebound correction, or buy at a low level!
Operation ideas:
Short-term gold 3305-3308 buy, stop loss 3297, target 3350-3370;
Short-term gold 3350-3353 sell, stop loss 3362, target 3320-3300;
Key points:
First support level: 3320, second support level: 3309, third support level: 3300
First resistance level: 3346, second resistance level: 3360, third resistance level: 3375
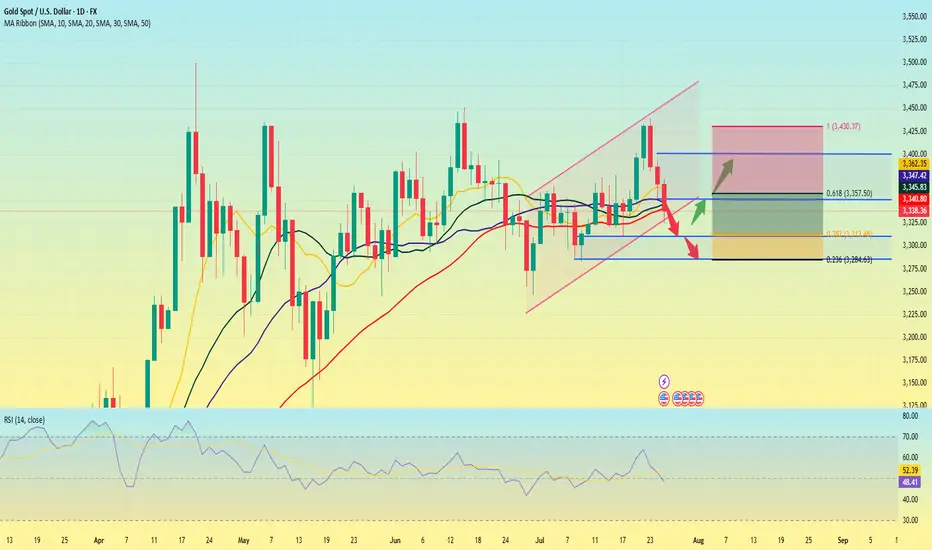
Gold is weak. Will it explode next week?Gold prices failed to stabilize above $3,400 after a bullish breakout this week. The technical outlook highlights the recent indecision of gold bulls.
In the first two trading days of this week, spot gold prices rose by 2.4%, but the cumulative decline in the last three trading days of this week reached nearly 3%. The sharp fluctuations this week were due to the positive progress in Trump's trade negotiations, and the rebound in market risk appetite, which hit the safe-haven demand for gold.
Looking at next week, the economic calendar will provide several high-impact data releases. The Federal Reserve will announce its monetary policy decision after the policy meeting on July 29-30; the US Bureau of Labor Statistics will release the July employment report; and some important news such as the US-China trade negotiations may trigger the next major move for gold.
From a technical perspective, the current market short-term technical outlook highlights the hesitation of gold buyers. The daily chart shows that the RSI is still slightly below 50, and gold prices have difficulty staying away from the 20-day and 50-day MAs after breaking through these two levels earlier this week.
On the upside, 3450 constitutes the first resistance for gold prices. If it breaks through this resistance, gold prices will most likely hit the 3400 integer mark again.
On the downside, if gold prices remain below 3340, technical sellers may still be interested. In this case, 3310 can serve as the first support level, followed by the second support level near 3285.
A new week is about to begin, and I wish all traders good luck.
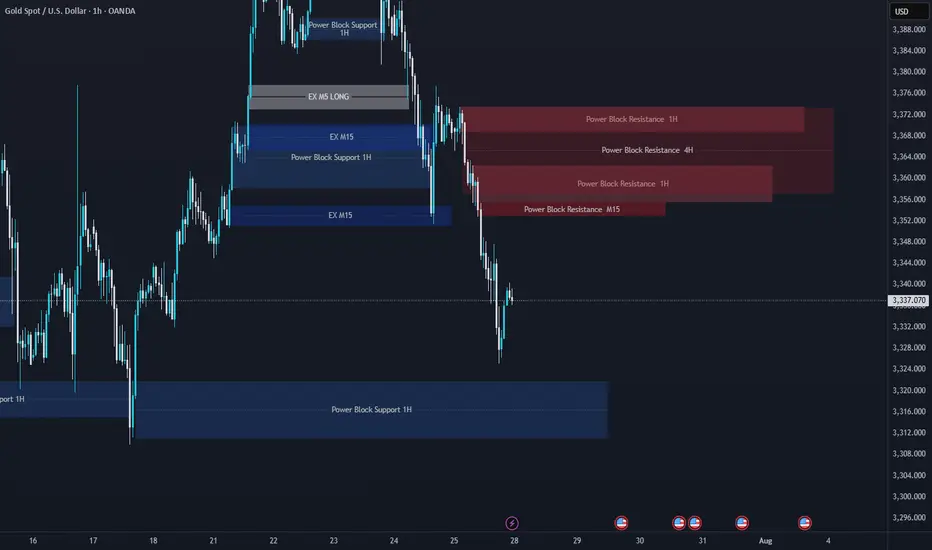
XAUUSD Support & Resistance Levels🚀 Here are some key zones I've identified on the H1/M15/M5 timeframe.
These zones are based on real-time data analysis performed by a custom software I personally developed.
The tool is designed to scan the market continuously and highlight potential areas of interest based on price action behavior and volume dynamics.
Your feedback is welcome!
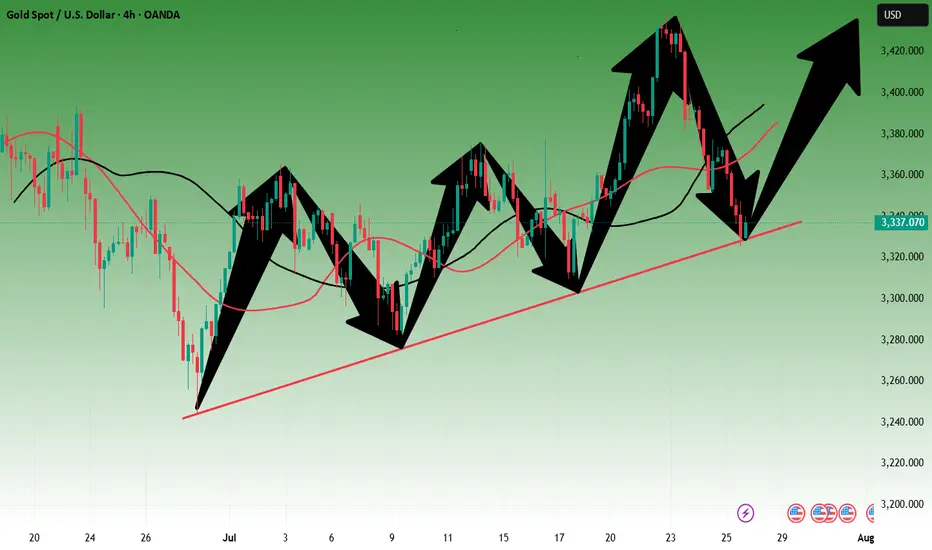
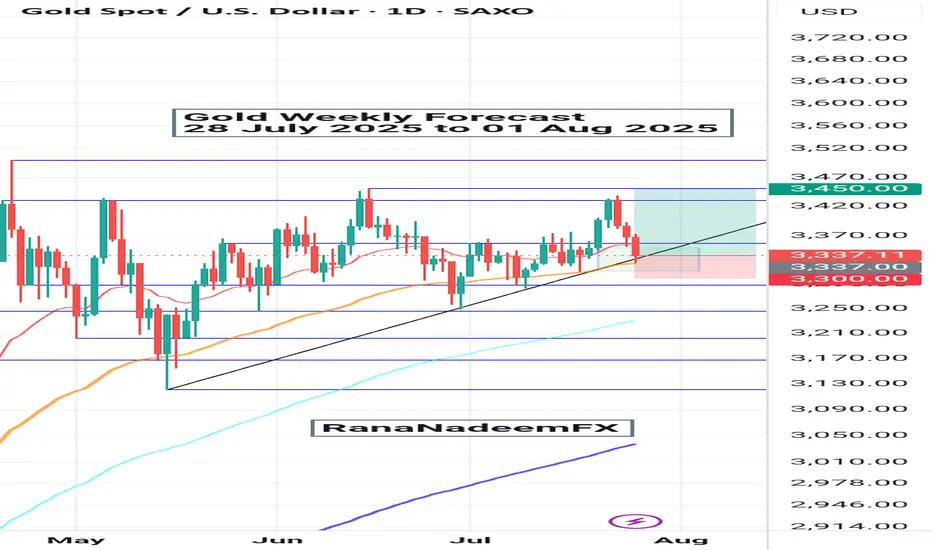
Gold Weekly Forecast (28 July – 01 Aug 2025)📈 Gold Weekly Forecast (28 July – 01 Aug 2025)
By: RanaNadeemFX
🔍 Technical Overview:
Gold (XAUUSD) is currently trading around $3,337, showing rejection near the previous resistance zone of $3,430–$3,450. The market has recently pulled back after testing this resistance and is now approaching a confluence support area formed by:
Dynamic trendline support (ascending black line)
Horizontal support zone around $3,300–$3,320
50-day EMA providing additional support
This zone is critical and likely to act as a bullish demand area, provided no major fundamental risk-off event occurs.
📌 Key Levels to Watch:
Support Zones: $3,300 / $3,270
Resistance Zones: $3,430 / $3,450
📊 Trade Setup Highlighted on Chart:
A buy opportunity is marked from current price levels with a potential bounce back towards $3,430–$3,450.
Entry Zone: Around $3,330 to 37
Target: $3,450
Stop Loss: Below $3,300
This setup offers a favorable risk-reward ratio, assuming price respects the support and resumes the upward trend.
🧠 Bias: Bullish (as long as price stays above $3,300 support zone)
⚠️ Note: Keep an eye on upcoming US economic data releases and geopolitical developments which could add volatility to gold prices.
📌 Follow for more: @RanaNadeemFX
#GoldAnalysis #XAUUSD #WeeklyForecast #TechnicalAnalysis #TradingView #ForexTrader #PriceAction #GoldOutlook #SmartMoneyConcepts
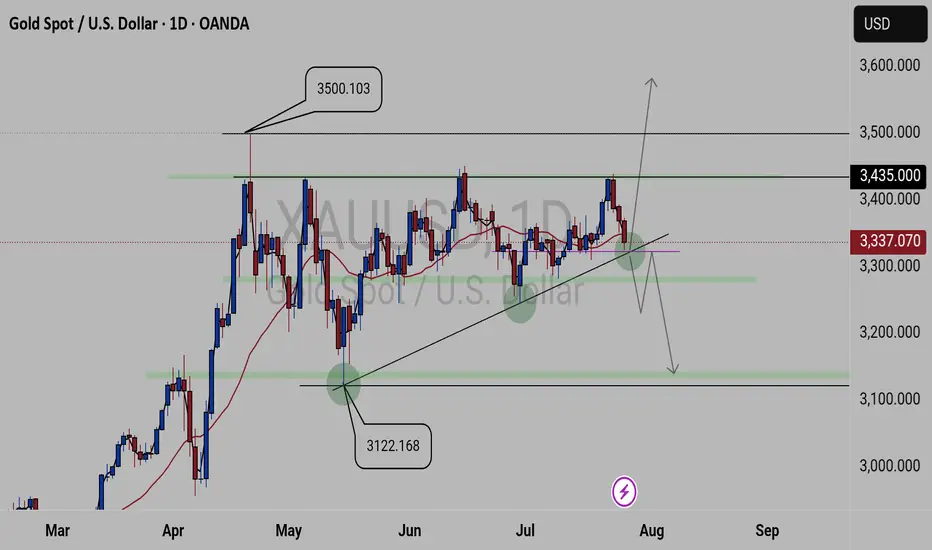
XAUUSD FORECASTThis is what we currently see on
GOLD.
We have 3500.103 key level as our current high zone and 3122.168 key level as our low zone. And Gold is been attempting to break 3435.00 key level resulting in selling, but been creating lower highs failing to break the created lows. Currently we a trading above the 3337.070 key level which is a critical key level, as it will determine the next coming movement.
Update will be given
Gold Trade SetupI will risk!!!
It seems we are near at the end of correction wave...
The first target R/R is 2 and the second is 4...
