GOLD/USD Bullish Breakout ConfirmationGOLD/USD Bullish Breakout Confirmation 🚀📈
📊 Technical Analysis Overview:
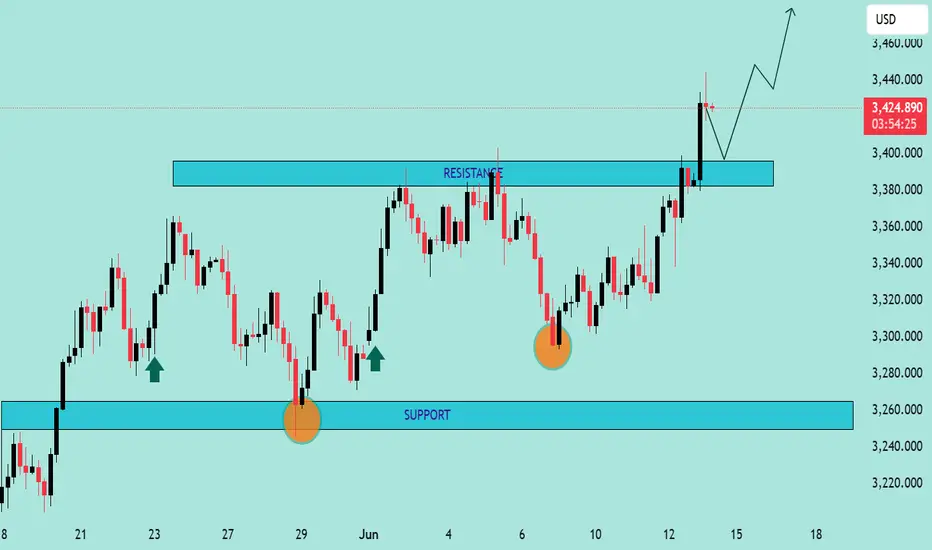
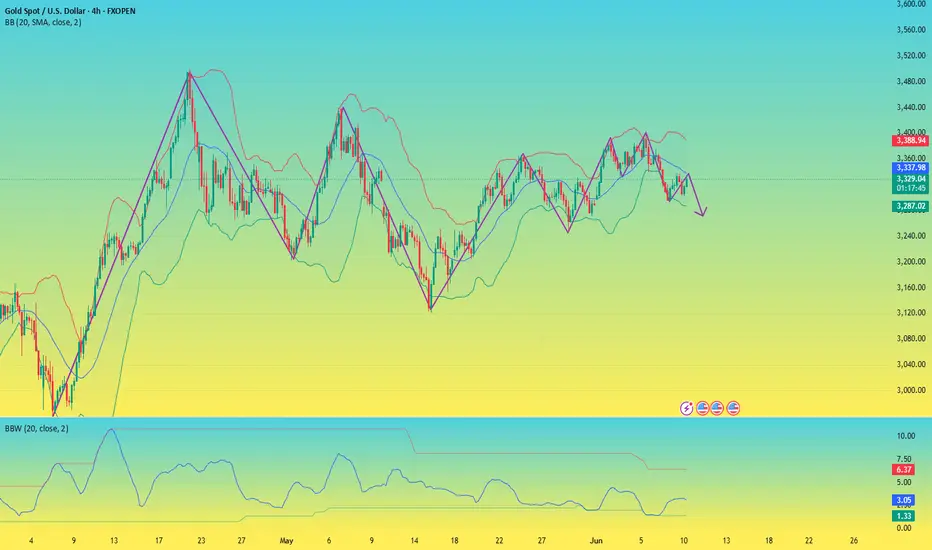
The chart illustrates a bullish breakout above a well-defined resistance zone around $3,390–$3,400. Price action has decisively closed above this resistance, suggesting strong bullish momentum.
🔍 Key Observations:
🟦 Support Zone:
Marked clearly between $3,250–$3,280, this level has held firm multiple times (highlighted with green arrows and orange circles), confirming buyer interest and market structure.
🟦 Resistance Turned Support:
The previous resistance zone around $3,390–$3,400 has now potentially turned into a new support. Price retesting this zone and holding would further validate the breakout.
📈 Future Projections:
The chart anticipates a retest-pullback-continuation scenario:
Pullback to new support 📉
Bullish continuation toward $3,460+ 🎯 if support holds.
✅ Bias:
Bullish as long as price remains above the $3,390 zone. Break and hold below would invalidate the bullish setup.
📌 Strategy Tip:
Look for confirmation on the lower timeframes (e.g., bullish engulfing or pin bar) on the retest before entering long.
Goldpreis
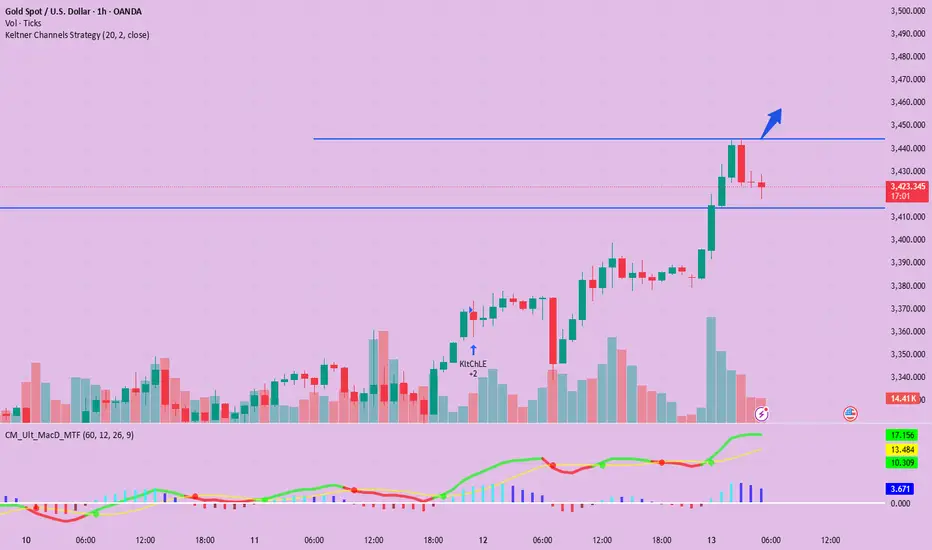
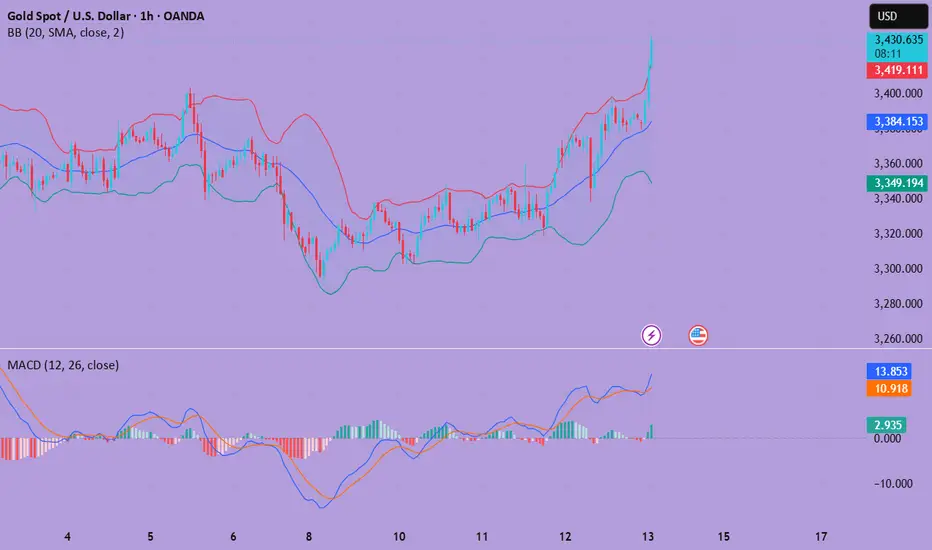
Spot gold is expected to test the $3,450 resistance levelSpot gold continued to rise in the Asian session on Friday (June 13), reaching a high of $3,443.18 per ounce, an increase of about 1.57%.
Reuters technical analysts pointed out that spot gold is expected to test the resistance level of $3,450 per ounce, breaking through which it may rise to the range of $3,473 to $3,488.
The c wave that opened at $3,294 briefly broke through the 86.4% forecast level of $3,429. Currently, the wave is moving towards the 100% forecast level of $3,450. The current rise is classified as a continuation of the previous upward trend that started at $3,245.
The support level is at $3,413, and a break below this level may cause gold prices to fall to the range of $3,372 to $3,391. The daily chart shows that gold prices are expected to return to the high of $3,500 on April 22.
Depending on how deep the decline is from this high, gold prices could eventually rise to $3,800.
FOREXCOM:XAUUSD VELOCITY:GOLD FOREXCOM:XAUUSD CMCMARKETS:GOLDQ2025 OANDA:XAUUSD
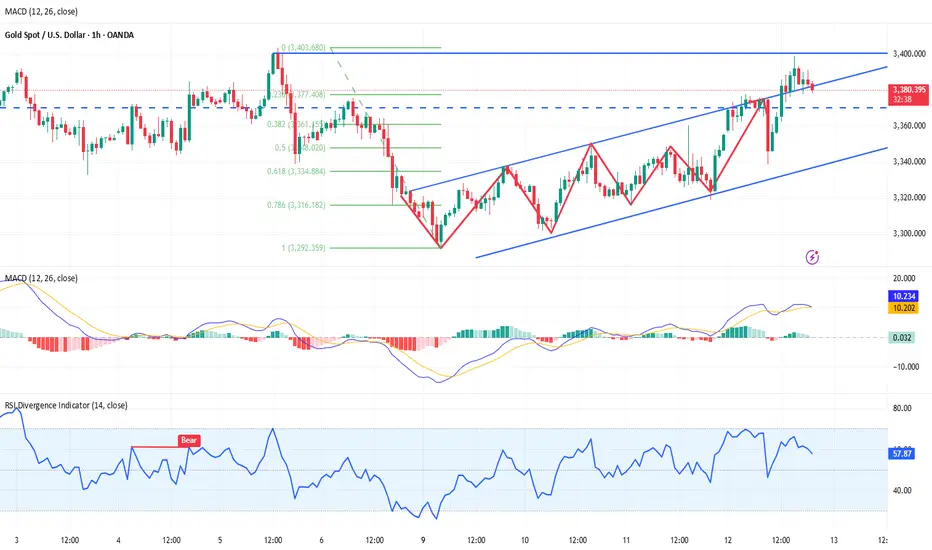
Gold prices soared again!Market news:
Spot gold continued to be strong in the early Asian session on Friday (June 13), and is currently trading around $3,423 per ounce. London gold prices have risen for three consecutive days, fueled by geopolitical tensions in the Middle East and the Federal Reserve's interest rate cut bets caused by the cooling of US economic data. The global financial market is in a complex environment with multiple factors intertwined, and the attractiveness of international gold as a safe-haven asset has once again become prominent.Tensions in the Middle East have become an important catalyst for the rise in gold prices. The supporting role of geopolitical risks on gold prices cannot be underestimated. Historically, whenever there is a major conflict or escalation of tensions in the Middle East, gold has often become a safe haven for funds. At present, the confrontation between Iran and the United States and the potential conflict risks of regional military bases have provided solid momentum for gold prices to rise.In the short term, gold still has strong upside potential, especially driven by geopolitical risks and expectations of interest rate cuts. However, investors need to be wary of the risk of a correction that may be brought about by inflationary pressures and uncertainty in trade policies. For long-term investors, the value of gold as a safe-haven asset in a diversified investment portfolio cannot be ignored.
Technical review:
Technically, gold maintains a strong positive structure, and yesterday's sharp rise approached the 3400 mark. The daily chart still remains above the MA10/5-day moving average, and the RSI indicator is at the 50-value axis and turns upward, and the price is in the upper track of the Bollinger band. The short-term four-hour chart moving average system maintains a golden cross opening upward, and the price gradually moves up along the MA10-day moving average, and the price is running in the upper track of the Bollinger band channel. The technical side of gold continues to fluctuate upward, with low-multiple layout as the main idea and high-altitude auxiliary. The current market is strong. If it breaks through the high on Thursday, there will be a second chance of rising on Friday. In terms of operation, keep the idea of buying on pullback. Pay attention to the support near 3407 below in the short term, and pay attention to the resistance near 3438 above. It may fall back after a strong pressure of 3450;
Today's analysis:
The situation in the Middle East has escalated. Gold has risen again due to risk aversion, directly breaking through 3400. The risk aversion sentiment of gold has heated up, and there are signs of easing for the time being. Then the risk aversion sentiment of gold may increase, and gold is expected to continue to rise. Gold bulls have begun to take the lead again under the blessing of risk aversion. At present, gold buying is better, so continue to buy. The 1-hour moving average of gold has formed a golden cross upward buying arrangement. The buying power of gold is getting stronger and stronger, and it is unstoppable. The outbreak of risk aversion is completely an emotional catharsis. Only when the emotions are fully released, the strength of gold bulls will weaken. The decline of gold is buying. The Asian session of gold fell back to the 3400-line barrier to support low-price buying.
Operation ideas:
Buy short-term gold at 3410-3420, stop loss at 3395, target at 3430-3450;
Sell short-term gold at 3447-3450, stop loss at 3458, target at 3400-3380;
Key points:
First support level: 3407, second support level: 3392, third support level: 3378
First resistance level: 3438, second resistance level: 3450, third resistance level: 3473
XAU/USD(20250613) Today's AnalysisMarket news:
The number of initial jobless claims in the United States for the week ending June 7 was 248,000, higher than the expected 240,000, the highest since the week of October 5, 2024. The monthly rate of the core PPI in the United States in May was 0.1%, lower than the expected 0.30%. Traders once again fully priced in the Fed's two interest rate cuts this year.
Technical analysis:
Today's buying and selling boundaries:
3374
Support and resistance levels:
3434
3412
3397
3351
3337
3314
Trading strategy:
If the price breaks through 3397, consider buying in, and the first target price is 3412
If the price breaks through 3374, consider selling in, and the first target price is 3351
Gold price fluctuates again, layout in the evening📰 Impact of news:
1. Initial jobless claims data favors bulls
📈 Market analysis:
The high of 3392 in the US market fell back for the first time to test the 3377 area to stop the decline and then tried again but failed to break through the 3400 integer mark. It can be seen that this position is very suppressed. The top and bottom conversion of 3377 has become the watershed for bulls to defend in the future market. 3400 is the short-term key pressure and the closing line has a long upper shadow K. If 3377 is lost, the price will fluctuate again. In the short term, focus on the 3390-3400 resistance on the upside and the 3377-3365 support on the downside.
🏅 Trading strategies:
SELL 3385-3395
TP 3370-3360
BUY 3365-3360
TP 3390-3400
If you agree with this view, or have a better idea, please leave a message in the comment area. I look forward to hearing different voices.
TVC:GOLD FXOPEN:XAUUSD FOREXCOM:XAUUSD FX:XAUUSD OANDA:XAUUSD
Gold hits 3400. What is Wall Street betting on?On Thursday (June 12), the U.S. Department of Labor released the Producer Price Index (PPI) for May and the initial jobless claims data for the week ending June 7. The data showed that the annual rate of PPI in May was 2.6%, in line with market expectations, and the previous value was 2.4%; the core PPI monthly rate only increased by 0.1%, lower than the expected 0.3%, and the previous value was -0.4%. The number of initial jobless claims remained unchanged at 248,000, slightly higher than the market expectation of 240,000, and the four-week average rose to 240,200, while the number of continued claims increased sharply by 54,000 to 1.956 million, setting a recent high. These data reflect that the U.S. labor market continues to cool, and inflationary pressures have eased but there are still uncertainties. The market's sensitivity to the Fed's expectations of rate cuts has further increased, coupled with the economic uncertainty caused by tariff remarks, investor sentiment has become cautious.
Immediate market reaction: Risk aversion heats up, and the dollar and U.S. Treasury yields are under pressure
After the data was released, the financial market reacted quickly, and the dollar index fell 1.02% to 97.63, reflecting market concerns about slowing inflation and a weak labor market. U.S. Treasury yields continued to fall, with the 10-year Treasury yield falling 6.7 basis points to 4.343%, a daily decline of 1.63%, showing investors' cautious attitude towards the economic outlook. Short-term interest rate futures prices rose, and traders further bet on the possibility of the Federal Reserve cutting interest rates this year. The probability of a rate cut at the September 17 meeting rose from 76% before the data was released to nearly 80%.
In the stock market, S&P 500 futures fell 0.25%, continuing the previous day's 0.3% drop. Market sentiment was affected by weak labor market data and sudden events in the aviation industry. Boeing's stock price plummeted 7% due to the crash of Air India's 787 Dreamliner, dragging down the performance of the Dow Jones Index. The gold market showed safe-haven appeal. Spot gold broke through $3,390/ounce to $3,390.13/ounce, up 1.05% on the day; the main contract of COMEX gold futures rose 1.97% to $3,410.40/ounce, reflecting the market's rising demand for safe-haven against economic uncertainty. In the foreign exchange market, the pound rose to 1.3600 against the US dollar, up 0.42% on the day.
Compared with market expectations before the data was released, the mild performance of the PPI data slightly eased inflation concerns, but the high level of initial jobless claims and the significant increase in the number of continued claims intensified the market's concern about the weak labor market. Before the data was released, some institutions expected the PPI monthly rate to reach 0.2%, while the number of initial claims could fall back to 240,000. The actual data was lower than inflation expectations but higher than employment expectations, and market sentiment shifted from cautious optimism to risk aversion, and the decline in the US dollar and US Treasury yields reflected this shift.
Data interpretation: Weak labor market and inflationary pressure coexist
From the data details, the annual PPI rate of 2.6% in May was in line with expectations, slightly higher than the previous value of 2.4%, indicating a mild recovery in inflationary pressure on the production side, but the core PPI monthly rate increased by only 0.1%, lower than expected, indicating that the inflation momentum after excluding food, energy and trade was limited. This is consistent with the recent trend of the Consumer Price Index (CPI) data, suggesting that inflation has stabilized overall, but has not yet fully returned to the Fed's 2% target range. In terms of the labor market, the number of initial unemployment claims has continued to run high, with the four-week average rising to 240,200 and the number of continued claims increasing to 1.956 million, indicating that it is more difficult for the unemployed to find jobs. Although the median unemployment duration has dropped from 10.4 weeks in April to 9.5 weeks in May, there has been no large-scale layoffs in the labor market, but the growth momentum has slowed significantly.
Analysts from well-known institutions pointed out that part of the reason for the cooling of the labor market is related to the economic uncertainty caused by tariff rhetoric, and companies tend to hoard labor rather than actively expand. In addition, the White House's recent tightening of immigration restrictions has further compressed the labor supply. The Quarterly Census of Employment and Wages (QCEW) data indicate that job growth from April 2024 to May 2025 may be overestimated, and Barclays economist Jonathan Millar expects that the benchmark revision in 2025 may reduce job growth by 800,000 to 1.125 million, an average monthly decrease of 65,000 to 95,000. This forecast further reinforces market concerns about an economic slowdown.
Institutional and retail views also reflect similar sentiments. Before the data was released, retail investors expected that if the PPI increase was lower than expected and the initial claims data was higher than expected, the Fed would be under more pressure to cut interest rates. After the data was released, the PPI data was moderate and the initial claims data was high. The market's expectations for the Fed's September rate cut were further heated up, and the trend of gold and US Treasury yields has already said it all. Some retail traders believe that both the initial claims data and PPI are weak, the US dollar index fell below 98, and they are bearish on the US dollar in the short term, and gold bulls have opportunities.
Compared with the optimistic expectations before the data was released, retail sentiment turned cautious, and some investors began to pay attention to the allocation opportunities of safe-haven assets.
Expectations of Fed rate cuts and changes in market sentiment
After the data was released, the market's expectations for the Fed's monetary policy changed subtly. Before the data was released, the market's probability of a rate cut at the Fed meeting on July 30 was only 23%, and the probability of a meeting on September 17 was 76%. After the release of PPI and initial claims data, the probability of a rate cut in September rose to nearly 80%, reflecting the market's comprehensive judgment on slowing inflation and a weak labor market. Traders have fully digested the possibility of two rate cuts this year, and the rise in short-term interest rate futures further confirms this expectation. However, tariff rhetoric and potential fiscal stimulus policies (such as the Republican tax cut plan) may put upward pressure on inflation, limiting the Fed's room for rate cuts.
From the perspective of market sentiment, before the data was released, investors' expectations for PPI and initial claims data were relatively divided. Some institutions expected that inflation might exceed expectations, while labor market data might improve. The mild performance of actual data dispelled concerns about overheating inflation, but the weakness of employment data exacerbated expectations of an economic slowdown.
Outlook for future trends
Looking ahead, market trends will remain volatile under the combined influence of the Fed's monetary policy expectations, tariff rhetoric and the global macro environment. In the short term, the mild performance of PPI data provides the Fed with greater policy flexibility, but the weakness of initial and renewal data indicates that the labor market may slow down further, and the probability of a rate cut in September will remain high. However, the upward risk of inflation caused by tariff rhetoric and potential fiscal stimulus policies may limit the extent of rate cuts. The market needs to pay close attention to the July non-farm payrolls data and June CPI data to further confirm the trend.
From a historical perspective, the S&P 500 index often shows a volatile pattern against the backdrop of mild inflation data and weak employment data. The current index is 2% lower than the historical high on February 19, and may continue to be under pressure in the short term. Gold's appeal as a safe-haven asset is increasing, and a breakthrough of $3,390/ounce may indicate further upside. The weakness of the US dollar index may continue, but we need to be wary of the support for the US dollar from safe-haven demand caused by tariff policies or geopolitical risks (such as the situation between Russia and Ukraine).
In the long run, continued weakness in the labor market may prompt the Fed to adopt a more accommodative policy in the second half of 2025, but the uncertainty of inflationary pressure will keep the policy path cautious. Investors should pay attention to the guidance of subsequent economic data, especially the revision of QCEW data, to judge the true situation of the job market.

Repeated sweeps, gold trend analysis and operation layout📰 Impact of news:
1. Pay attention to the initial unemployment claims data
📈 Market analysis:
Gold price jumped higher in Asian session. The short-term upper pressure is at 3375. Once it breaks, the upward route of bulls will be opened. The RSI indicator in the 1H chart began to retreat after touching the overbought area. Last night's high of 3360 is now a breakthrough, and the previous strong suppression is at 3350. This morning's Asian session was also broken and stabilized. Then 3360-3350 has changed from a suppression position to a support position. Therefore, the next position we should pay close attention to should be around 3360-3350. If it can fall back to 3360-3350 in the future, it is possible to enter the market to do more, but at the same time, it is also necessary to defend 3345. Independent trading requires a SL.
🏅 Trading strategies:
BUY 3360-3350
TP 3370-3380-3400
If you agree with this view, or have a better idea, please leave a message in the comment area. I look forward to hearing different voices.
TVC:GOLD FXOPEN:XAUUSD FOREXCOM:XAUUSD FX:XAUUSD OANDA:XAUUSD

XAU/USD(20250612) Today's AnalysisMarket news:
① The EU hopes that the trade negotiations will be extended beyond the suspension period set by Trump. ② Bessant: As long as "sincerity" is shown in the negotiations, the Trump administration is willing to extend the current 90-day tariff suspension period beyond July 9. ③ Trump will hold multiple bilateral talks during the G7 summit. ④ The total customs revenue of the United States in May reached a record high of US$23 billion, an increase of nearly four times year-on-year. ⑤ Lutnick: One deal after another will be reached.
Technical analysis:
Today's buying and selling boundaries:
3343
Support and resistance levels:
3388
3371
3360
3326
3315
3298
Trading strategy:
If the price breaks through 3371, consider buying in, and the first target price is 3388
If the price breaks through 3360, consider selling in, and the first target price is 3343
How to arrange the gold price in the evening? Go long at 3330📰 Impact of news:
1. CPI data is profitable
2. The US CPI rose slightly in May, and Trump's tariff effect has not yet fully emerged
📈 Market analysis:
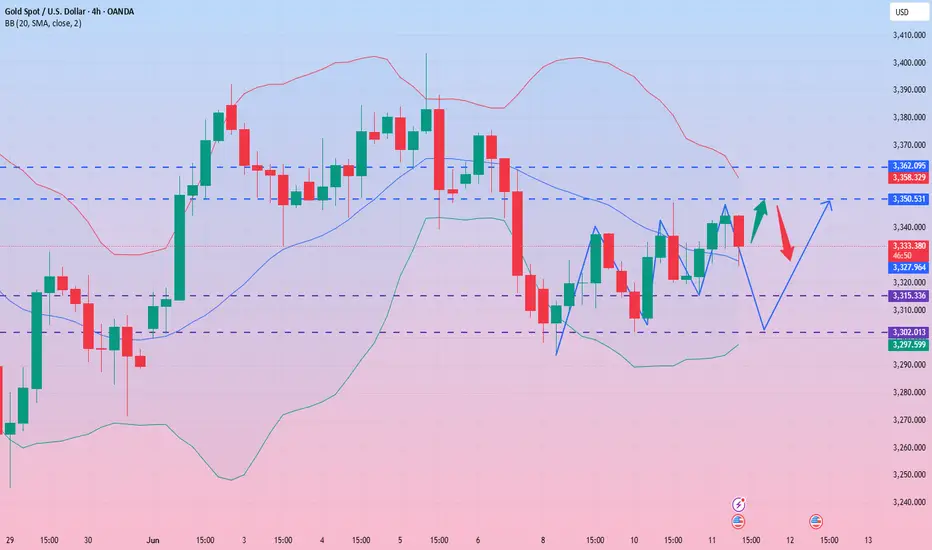
The trend line position of the 4H chart coincides and resonates with the middle track of the Bollinger Band, with 3326 as the watershed reference. This is why it is difficult to break below this point after repeated tests. Once it breaks below, the short-term trend is likely to fluctuate from strong to weak. However, the current support below is still strong at 3330-3326. The repeated rise and fall of data during the day also stopped the decline at this point. If the price does not lose here, the pattern of strong fluctuations will remain unchanged, and the bulls will gradually regain lost ground. At present, it is time for space. The operation suggestion for the future market is to continue to rely on the bullish trend above 3330, and 3330-3326 can be flexibly entered. At the same time, the RSI indicator is above 50 and there is still some space from the overbought zone. The signal is given that 3360, although the long upper shadow line K is closed, is very likely not the short-term top. After the sharp rise and fall in 1H, it went sideways and waited for the next wave of strength. If the night close is above 3326, the upper area will probably be 3350-3360. If the price can break through and stabilize this level, the upward pace will most likely accelerate to reach 3370-3380.
🏅 Trading strategies:
BUY 3330-3326
TP 3350-3360
If you agree with this view, or have a better idea, please leave a message in the comment area. I look forward to hearing different voices.
OANDA:XAUUSD FX:XAUUSD FOREXCOM:XAUUSD FXOPEN:XAUUSD TVC:GOLD
Gold rebound is still a short-selling opportunityFirst of all, let's take a look at why the market is still not reversing after a big rise, and there is a rapid rise and fall?
The data is bullish, and gold is rising rapidly, but we should pay attention to the sustainability of the rise, and secondly, the current trend direction. The overall trend of gold is still fluctuating downward recently, so even if the data is bullish, it is likely to just give an opportunity to "go high and short".
Although gold performed strongly after the data was released, it began to fall under pressure at the 3360 line, the trading concentration area of the last box shock, indicating that the bulls' volume is still not enough to break through the upper resistance. It is reasonable to rise and fall.
Since gold is currently in a market that is tempting to buy more, it means that the main trend is still bearish. The rebound is still dominated by short selling. The gold 1-hour cycle closed with a long upper shadow, indicating that the upward attack is weak, indicating that the area above 3350 is still a strong pressure area. This upward rush is just a short-term effort with the help of data benefits, which is a typical false breakthrough. Therefore, gold rebounded to the 3350-3360 area in the US market, and it is still dominated by high shorts.
This is the charm of the market - some people are always hesitant in the ups and downs, while others can always grasp the key turning points. The premise is to be able to see the trend clearly and follow the trend.
Don't be led by the market, but understand: Is the current fluctuation a trap or an opportunity?
If the direction is wrong, the effort will be in vain; if the direction is right, you will get twice the result with half the effort.
Don't make excuses for failure, just find ways to succeed. Have you found it?
All recent trading strategies and ideas have been realized, and the point predictions are accurate. If your current gold operation is not ideal, we hope to help you avoid detours in your investment. Welcome to communicate with us!
Analysis of the latest gold price trends!Market news:
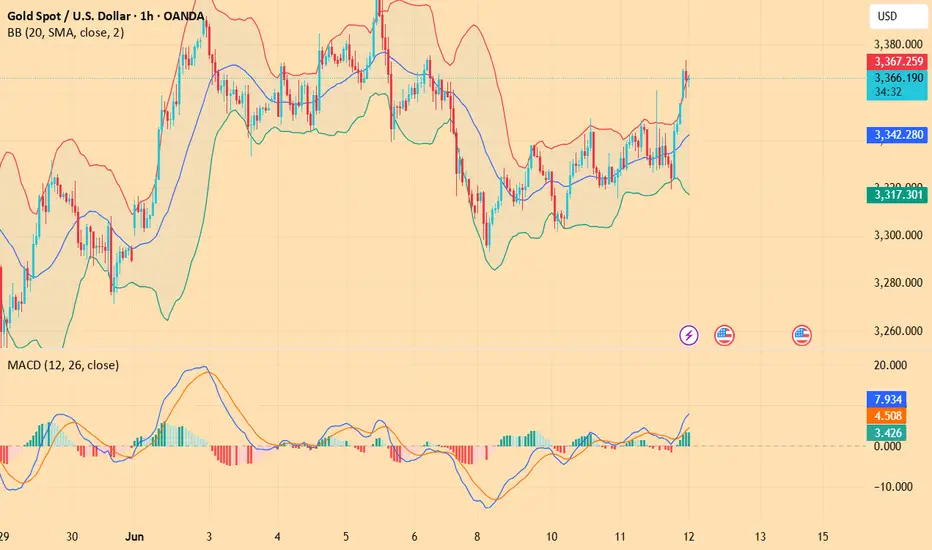
In the early Asian session on Wednesday (June 11), spot gold fluctuated in a narrow range and is currently trading at $3,330 per ounce. London gold prices rose and fell on Tuesday as the conflict between Russia and Ukraine continued and the World Bank also lowered its global economic growth forecast. Traders are closely watching the Sino-US trade negotiations, the results of which may ease trade tensions and boost the global economy, thereby reducing the demand for safe-haven assets, while the continued rise in US stocks has also suppressed the safe-haven buying demand for international gold.In the past few days, gold has fallen from its recent highs, mainly because the market has optimistic expectations for negotiations between China and the United States and Britain and Russia. If the United States and China reach a trade agreement, it will weaken the attractiveness of gold as a safe-haven asset. Gold is a hedge investment tool and usually rises during periods of geopolitical and economic uncertainty. The market is currently focusing on the upcoming US CPI data for May. Expected data show that inflation may rise slightly to 2.5%, with core CPI around 2.9%. If the data exceeds expectations, it may be bearish for gold in the short term; if inflation slows down, it will strengthen the market's expectations for the Fed to cut interest rates this year, which is bullish for gold prices.
Technical review:
Technical daily chart continues to close with alternating yin and yang cycles, the moving average is glued together, and the RSI indicator runs on the middle axis. The moving average of the four-hour chart is glued together, the price is adjusted near the middle track of the Bollinger Band, and the RSI indicator is flat. Gold rose above 3349 yesterday and fell back to 3320 in the early morning. After a sharp drop to 3315 in the Asian session, it needs to break the low point of 20 in the early morning and then quickly rise to 3331. Pay attention to the 3320 position in the Asian session. If 3320 stabilizes and moves upward, continue to look at the test of 3340/50 during the day. Otherwise, if it loses again or adjusts around 20 during the day, it will be regarded as a weak sell. Pay attention to 3306/3293 below. Gold technical aspects continue to be arranged with a shock idea. Under the premise that there is no news to stimulate the selling, gold continues to maintain low-price buying as the main technical aspect, and high-price selling as the auxiliary.
Today's analysis:
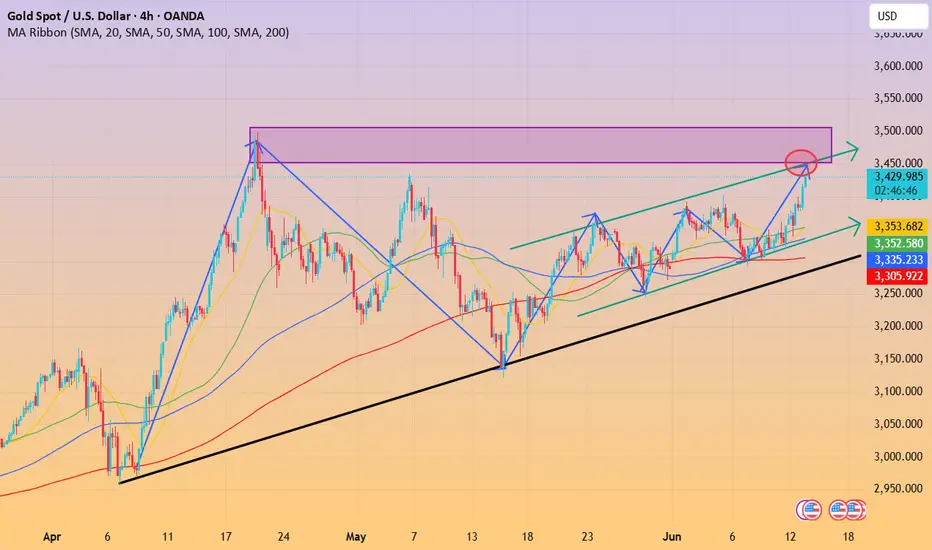
From the daily level, gold is in a high-level shock consolidation since the peak of 3500. The current highs of 3500, 3435, and 3403 are gradually moving down, and the lows of 3120, 3245, and 3293 are gradually rising. The shock range is gradually narrowing. The short-term market may continue to maintain shocks. If it breaks, it needs to wait for the direction of the breakthrough to be stimulated by major news!
So today's lock range is 3293-3360. It is recommended to sell at high prices and buy at low prices to treat shocks, mainly short-term or ultra-short-term, and do not chase ups and downs before the range is effectively broken.
Operation ideas:
Buy short-term gold at 3310-3330, stop loss at 3292, target at 3340-3360;
Sell short-term gold at 3350-3363, stop loss at 3362, target at 3300-3310;
Key points:
First support level: 3320, second support level: 3306, third support level: 3292
First resistance level: 3346, second resistance level: 3358, third resistance level: 3376
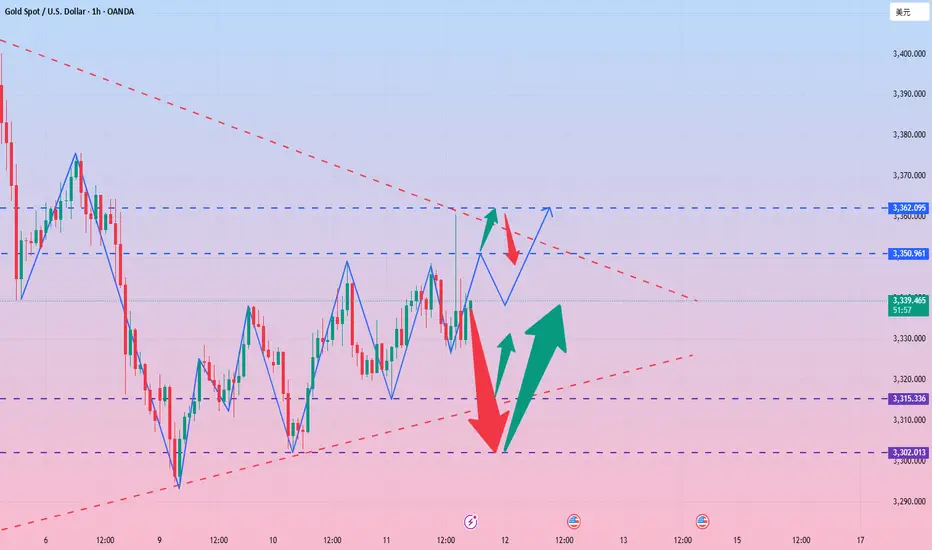
Gold fluctuates repeatedly, and opportunities emerge!Gold was under pressure for the second time during the day, and the pressure at the 3349 line fell back. It continued to be treated with a fluctuating mindset. The 4H cycle observation showed that the Bollinger Bands were closing, and the K-line repeatedly interspersed around the middle track. The short-term structure tended to fluctuate upward. Pay attention to the 3348-3350 and 3362 pressure zones above, and the support below is located in the 3315 and 3302 areas. In terms of operation, the main long and auxiliary short ideas are maintained, and the guidance of CPI data is paid special attention.
Operational suggestions: Gold retreats to the 3315-3305 area and tries to arrange long orders, with the target looking at 3338 and 3349. A strong breakthrough can look up to 3360. If the 3350-3360 pressure zone above is not broken, short orders can be tried in the short term.
All recent trading strategies and ideas have been realized, and the point predictions are accurate. If your current gold operation is not ideal, we hope to help you avoid detours in your investment. Welcome to communicate with us!
How to plan for the positive effects of CPI data?📰 Impact of news:
1. CPI data is profitable
2. The US CPI rose slightly in May, and Trump's tariff effect has not yet fully emerged
📈 Market analysis:
The CPI data is bullish. The current gold price has risen to around 3360. We took profits at the 3330 level and exited the market, which once again confirmed the forward-looking nature of our trading vision. From a technical perspective, the RSI indicator in the short-term hourly chart is close to the overbought area. In the short term, pay attention to the upper resistance line of 3360-3365. If it rebounds to the 61.8% position and encounters resistance and pressure, consider shorting at high levels. On the contrary, if it effectively breaks through and stabilizes above, it is expected to touch the 3400 line. In the short term, pay attention to the lower support line of 3340-3330.
🏅 Trading strategies:
SELL 3360-3365
TP 3340-3330
If you agree with this view, or have a better idea, please leave a message in the comment area. I look forward to hearing different voices.
TVC:GOLD FXOPEN:XAUUSD FOREXCOM:XAUUSD FX:XAUUSD OANDA:XAUUSD

CPI is coming, which direction should gold go?
True trading masters can maintain inner peace in the hustle and bustle of the market and are not confused by short-term fluctuations. They know that the short-term trend of the market is full of randomness, like ripples on the water, seemingly complicated but difficult to predict. They are like gatekeepers of the mind, with strong determination to resist the emotional interference of the market, and no matter how big the market fluctuations are, they will not let them lose their footing. When others are scared and want to sell their stocks quickly, they can keep their composure; when others are stimulated by the daily limit and want to chase high, they can hold the bottom line.
The international gold price opened at $3,325/ounce and closed at $3,322/ounce on the last trading day. The real part of the daily K-line fell by only $3/ounce and finally closed at the cross line. Yesterday, the gold price fluctuated slightly and closed down, mainly because of the market's attention to the progress of Sino-US trade negotiations. The market generally believes that if the negotiations can ease trade tensions and boost the global economy, it will weaken the demand for safe-haven assets. At the same time, the strengthening of the US dollar also brings downward pressure on gold.
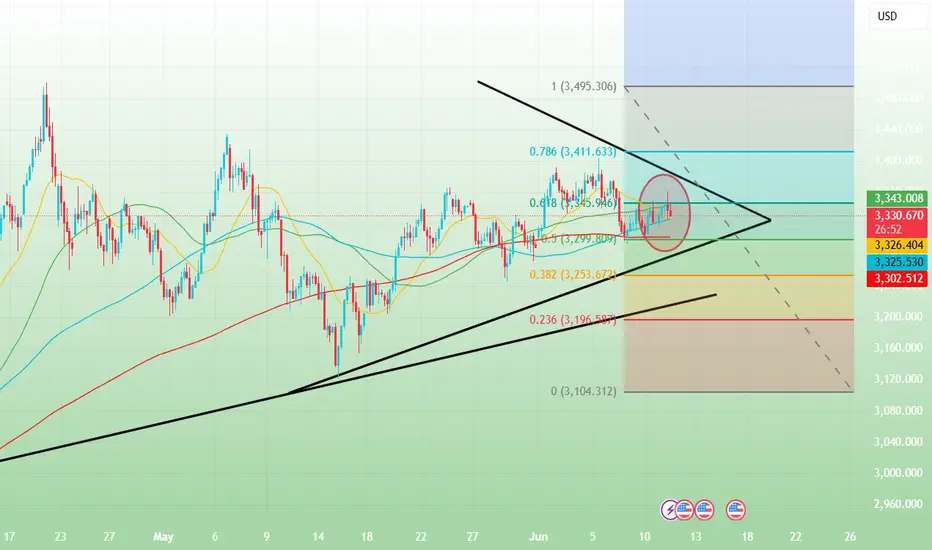
Weekly candlestick chart: running in the rising channel, long-term buy on dips
Daily candlestick chart: running in disordered oscillation structure, cautiously wait and see in the medium term
4-hour chart: running in an oscillating bullish trend, short-term buy on dips
30-minute chart: bottom structure established, short-term buy on dips above 3326
Intraday plan to continue to buy in the 3332 area, defend 3325, target 3350-60
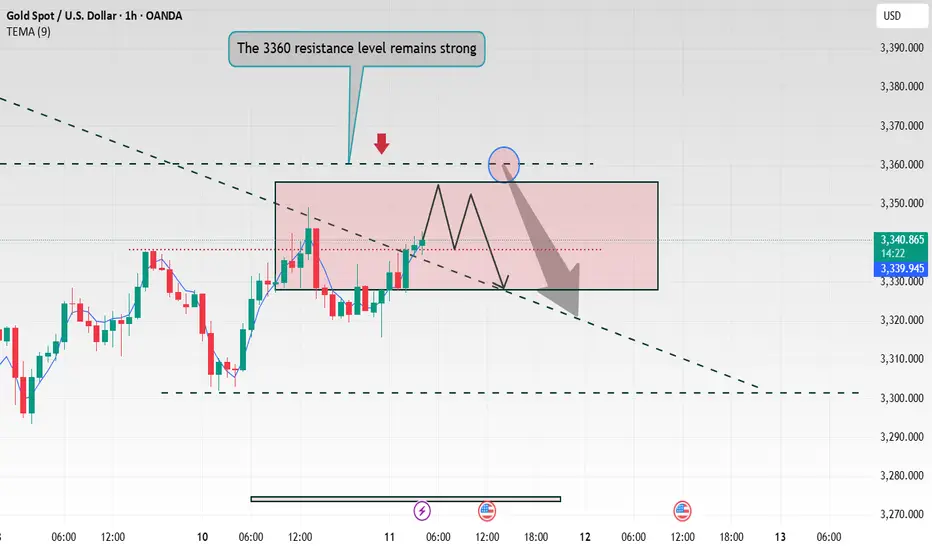
GOLD PRICE ACTION ANALYSIS – June 11, 2025 GOLD PRICE ACTION ANALYSIS – June 11, 2025 🟡
Technical Breakdown & Bearish Scenario Ahead ⚠️📉
🔍 Overview:
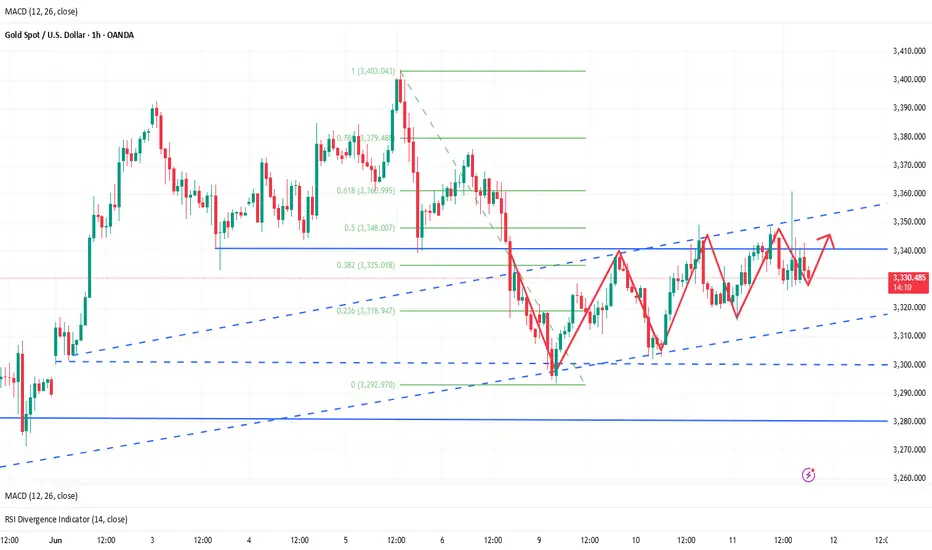
The chart presents a clear range-bound structure with strong horizontal resistance around the $3,400–$3,420 zone and support around the $3,120–$3,160 level. Price is currently trading near the upper range of the consolidation.
📊 Key Technical Levels:
🔴 Resistance Zone: $3,400 – $3,420
➤ Price has been rejected here multiple times (highlighted by red arrows and orange circles), showing strong supply pressure.
🟣 Intermediate Support: $3,260.618
➤ This level acted as a minor support and could be tested again if the current pullback deepens.
🟤 Major Support Zone: $3,120 – $3,160
➤ A key demand area where price previously bounced significantly.
📉 Bearish Setup:
A potential lower high is forming just below the resistance zone.
The projected path suggests a minor pullback to form a bearish retest, followed by a potential breakdown below $3,260.
If the $3,260 support is broken decisively, further downside toward the $3,120–$3,160 support is likely (blue arrow projection).
🔄 Bullish Scenario (Invalidation):
A breakout and strong close above $3,420 could invalidate the bearish structure.
In that case, price might attempt to target higher resistance levels beyond $3,440.
📌 Conclusion:
Gold remains in a range with a bearish bias unless the $3,420 resistance is breached.
🔽 Watch for confirmation below $3,260 for bearish continuation.
✅ For bulls, wait for a strong breakout above resistance with volume.

Analysis of gold prices on June 11
📌Gold news
🎈Economic data and policy expectations
U.S. employment data; initial jobless claims increased for two consecutive weeks, and the market focus shifted to the non-farm payroll report released this week. The data performance will affect the Fed's policy path.
Trump pressures interest rate cuts: Trump recently called on the Fed to cut interest rates by "one percentage point" again, and hinted that he would consider replacing the Fed chairman, exacerbating market expectations for loose monetary policy.
🎈Long-term support factors
Despite short-term fluctuations, global economic and geopolitical uncertainties (such as repeated trade frictions and debt risks) still provide long-term safe-haven demand for gold, especially in the context of the divergence of monetary policies between European and American central banks, the allocation value of gold is highlighted.
📊Technical analysis
Before the European session, the gold price showed a continuous positive trend. I gave a hint in my analysis that I was not in a hurry to guess the top, and followed the trend to rise to around 3340 and wait for the turning point to appear. The opening trend of the European session tended to fluctuate until it rose to around 3348 in the evening and then turned from rising to falling, but the decline was not strong. It rose again at the position of the European session. Now the gold price is trading around 3350. From the market point of view, this wave of rise was supported by the trend line at 3300. Whether it was geopolitical conflicts or various news about Sino-US trade negotiations that stimulated buying to drive gold prices up, the second rise in the US session has exceeded 3340.
The next key suppression level is around 3360, which is 618 from 3403 to 3300, which can be treated as a turning point. The initial support below focuses on the high point of yesterday's Asian session at 3338.
💰Strategy Package
Waiting for gold: short at 3355-3360, stop loss at 3365, target at 3340-3328!
⭐️ Note: Labaron hopes that traders can properly manage their funds
- Choose the number of lots that matches your funds
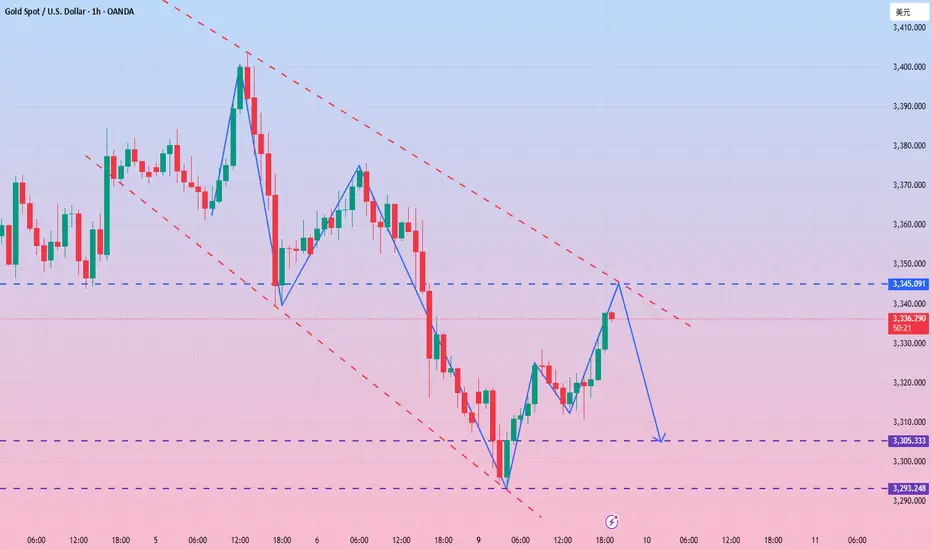
Gold V-shaped reversal still has room to rise In the morning, the market was under pressure at 3328, and two consecutive big negative lines fell to the low of 3302, breaking through the lower track of the descending flag consolidation channel, forming an effective break. 3317 was originally the confirmation point of the channel counter-pressure, and it was also the 618 split resistance at the time. Then the middle track was lost, and the trend was bearish, so it tried to rebound but continued to fall under pressure.
But the market immediately made a V-shaped reversal, breaking through the morning high of 3328, and had attacked to 3342 before the US market. The European session was volatile and strong, and with the help of a pullback before and after the U.S. session to lure short sellers, there is still hope for a second rise
The focus of the support for the retracement is on two positions: one is the 3322 line, corresponding to the middle track and 50% split support; the other is 3318, corresponding to the 618 split support. If it stabilizes after touching it, it will most likely point to the 3348 counter-pressure position.
If the pressure of 3348 cannot be broken, there is still a possibility of repeated fluctuations in the short term. It is necessary to pay attention to whether the secondary low point appears when it pulls back to further consolidate the support structure. If the market directly breaks through and stands above 3348, 3293 may have been confirmed as a short-term low.
The recent trading strategy ideas are all realized, and all the points are predicted accurately. If your current gold operation is not ideal, I hope I can help you avoid detours in your investment. Welcome to communicate with us!
Gold fluctuates repeatedly and opportunities emerge.Gold bottomed out in the Asian session and rebounded to break through the opening of the decline. The European session continued to break through yesterday's high. The US session continued to break through the key pressure position of 3335-3345, and walked out of the standard strong cycle. After the break, it is necessary to change the thinking and follow the trend to be bullish. Pay attention to the support below 3315-3325. In terms of operation, it is mainly long when it falls back. The upper side gradually looks to 3352 and 3365. If the pressure is not broken, look at the falling space!
Operation suggestion: Go long when gold falls back to 3325-3315, and look at 3338 and 3352! If the pressure above 3352 and 3365 is not broken, you can short!
The recent trading strategy ideas are all realized, and all the points are predicted accurately. If your current gold operation is not ideal, I hope I can help you avoid detours in your investment. Welcome to communicate with us!

Gold rebounds and repairs, is it a shock or a bull market?📰 Impact of news:
1. Geopolitical situation
2. Impact of the US dollar trend on gold
📈 Market analysis:
At the gold hourly level, after the pressure in the Asian session in the morning, it directly fell to the vicinity of 3302. The big Yin effectively lost the lower track of the descending flag consolidation channel. The original 3318 line was the confirmation of the channel counter-pressure point, which happened to be the 61.8% split resistance level at that time. At the same time, it lost the middle track. Therefore, we gave a trading idea of looking at the rebound under pressure and continuing to decline in the European session. As a result, the market directly took a V-shaped wash-up and once pulled up to the vicinity of 3342.
The European session fluctuated strongly and rose. Before and after the US session, it took advantage of the retracement to lure the short position, and there is still the possibility of a second pull-up space. Therefore, in the subsequent retracement support level, pay attention to two positions, one is 3322-3324, and the other is the 61.8% division support level of 3318. If it stabilizes, there is a high probability that there will be a second upward space, pointing to 3348. If the pressure here cannot be overcome, the bottom will continue to oscillate back and forth. At that time, it will fall back to see if a secondary low point can be formed to further stabilize the support. If it goes straight through and stands on it, 3293 may already be the short-term low.
On the whole, I still hold short orders before the effective breakthrough of 3345, but at the same time, as the gold price rebounds and moves upward, the short-term support level is temporarily expected to be 3325-3320.
🏅 Trading strategies:
SELL 3335-3345
TP 3325-3315
BUY 3325-3330
TP 3350-3360
If you agree with this view, or have a better idea, please leave a message in the comment area. I look forward to hearing different voices.
TVC:GOLD FXOPEN:XAUUSD FOREXCOM:XAUUSD FX:XAUUSD OANDA:XAUUSD
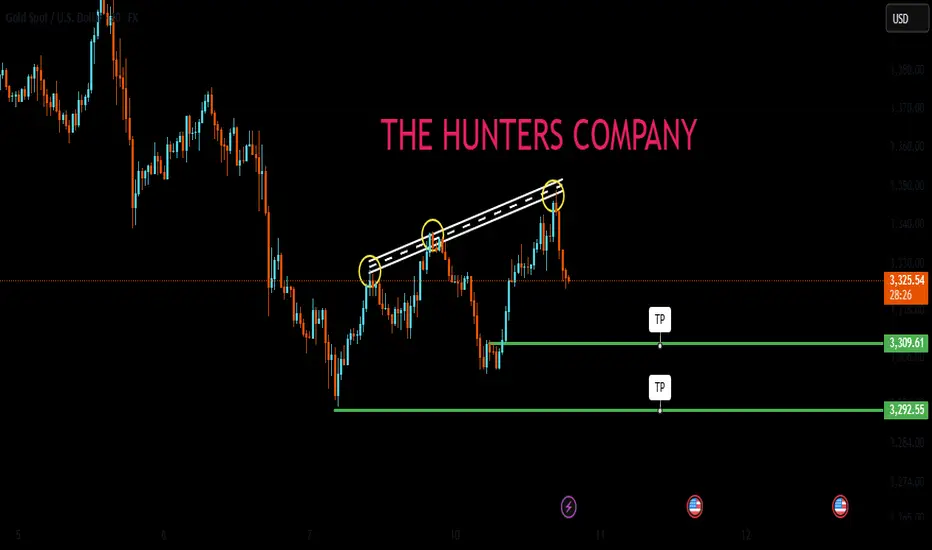
GOLD TODAYHello friends🙌
🔊Due to the weakness of buyers and the strength of sellers, the price continues to fall...
We have identified two supports for you that will not be seen if the price continues to fall, and if the selling pressure increases, we will update you.
🔥Join us for more signals🔥
*Trade safely with us*
Perfect grasp of the high altitude and low multi rhythm!The current trend of gold continues yesterday's trend, maintaining a high rebound and volatile market. But don't panic, focus on the performance of the rebound. If the rebound fails to break through the upper resistance level, continue to focus on shorting. The upper suppression area is locked at the 3335-3345 line. Although the bullish performance has been strengthened, if it cannot effectively break through this range, it is still a short-term weak signal. From the current market, the upper pressure is obvious, and the rebound can rely on this range to layout the main short, focusing on the continuation of the decline. The lower support focuses on the 3293-3300 integer mark, and the overall long and short wide range of volatile market is maintained. Before the daily level fails to effectively break through and stand firm at the 3345 mark, it is difficult to say that the bulls will turn strong, and operations need to be cautious. If the market adjusts, the strategy will be updated simultaneously.
Operation strategy suggestion: Gold rebounds to the 3335-3345 first-line area to choose the opportunity to short, target the 3295-3306 range, strictly control risks, and follow the trend.

Gold price rebounds and then falls
The current trend is similar to that of Monday. Now that the market has continued to rise, we should not rush to guess the top. The idea is to follow the trend and wait for the stagflation signal to appear before looking at the callback. At present, the turning point of this wave is roughly expected to be around 3338. After the turning point appears, I will prompt you to participate in short orders to watch the callback. The callback position is expected to be around 3312. That is, the idea of European trading is to participate in short orders near 3338, with the target near 3315; after there is a stop-loss signal near 3312 below, participate in long orders.
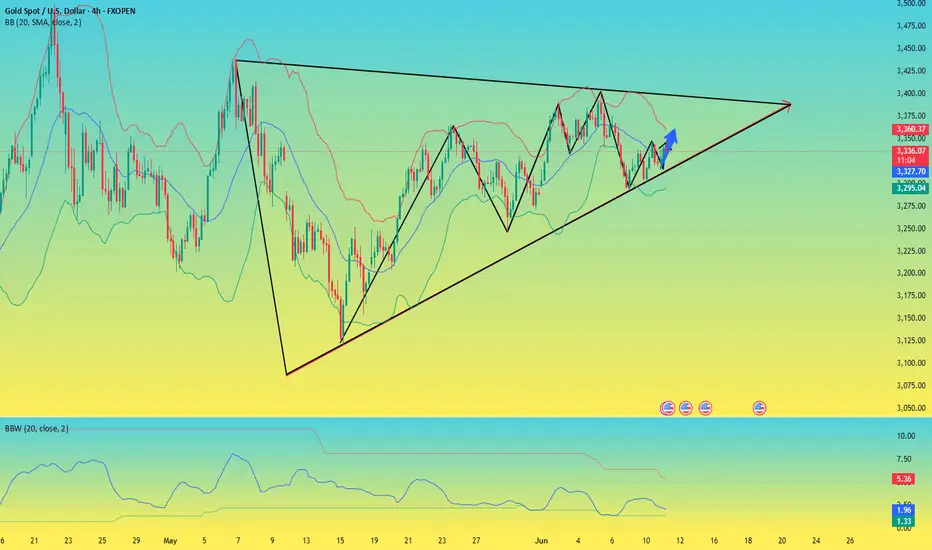
Gold fluctuates repeatedly, hiding great opportunities!After the opening of gold today, the bulls and bears played fiercely. In the early trading, it fell to 3293 and received temporary support, then stabilized and rebounded. It broke through the high point of 3320 in the Asian session and continued to rise above 3330. However, the price was under obvious pressure near 3330, and the momentum indicators (MACD, RSI) showed a top divergence at the same time, reflecting the exhaustion of bullish momentum and limited short-term upside space.
From the technical structure, gold has effectively fallen below the middle track support of the H4 cycle, and at the same time lost the upward trend line built since the low point in June. The two breakout positions are highly overlapped, constituting an obvious technical weakening signal. The current trend is trapped in the key resistance suppression area, and it is expected to enter a high-level shock and weakening stage.
The operation suggestions are as follows:
🔸Strategy direction: short-term thinking
🔸Entry area: 3335–3345 range
🔸Defense reference: stop loss above 3350
🔸Target expectation: look down to 3305, break to 3293 or even 3280 near the extension support
In terms of fundamentals, the US dollar index is under short-term pressure, mainly due to the decline in the US fiscal outlook and US Treasury yields; but the non-agricultural data boosted economic resilience, which cooled the market's expectations for a rapid rate cut this year, restricting the rebound space of gold prices. Although risk aversion has support, it has not yet become a dominant driver. The current market sentiment remains cautiously neutral.
Overall judgment: The short-term rebound of gold prices is limited, and the short-term trend is gradually released after the structural break. It is recommended to follow the trend and go high, control risks, and steadily execute trading plans.