Gold rebound fails to change the trend and is still bearish?📰 Impact of news:
1. The streets of Los Angeles are full of "gunpowder smell"! Immigration protests escalate, and Trump sends troops to suppress them
2. Geopolitical situation
3. Federal Reserve political expectations
📈 Market analysis:
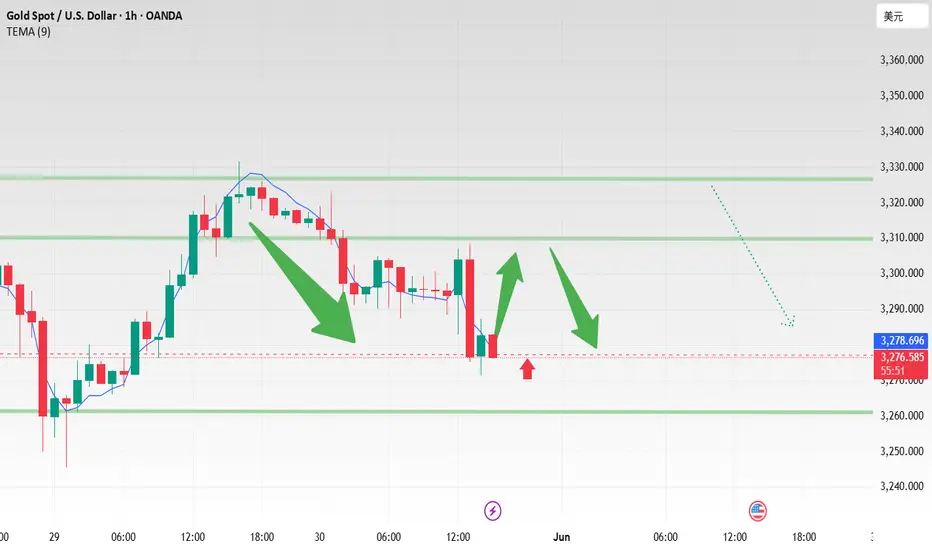
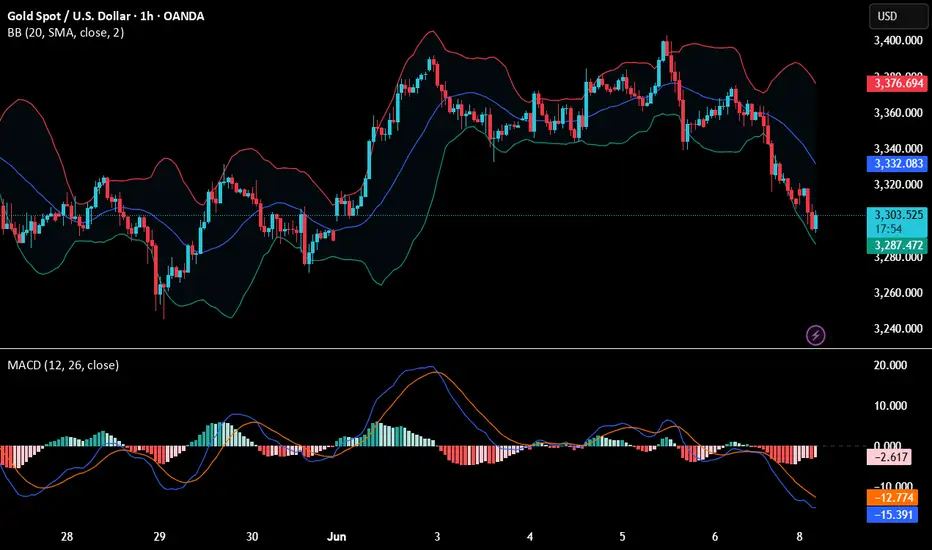
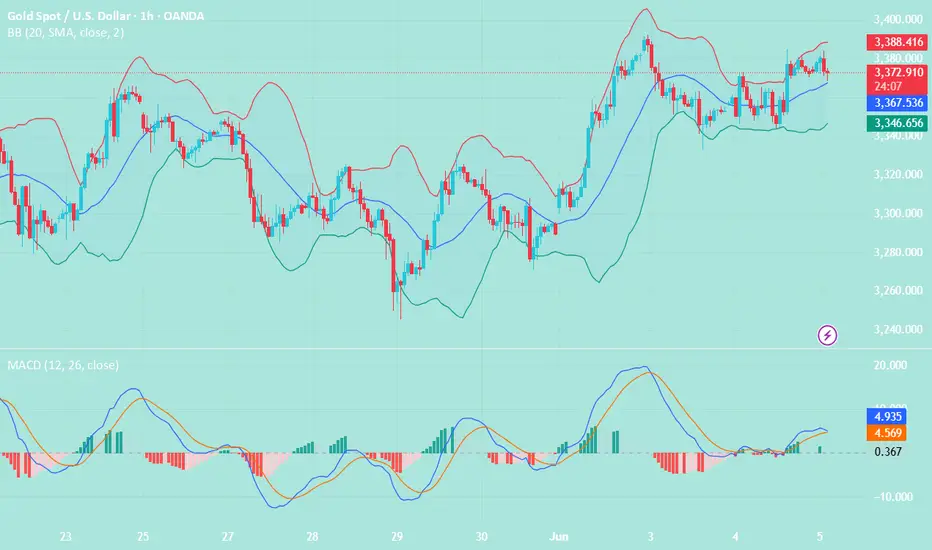
At the hourly level: the Bollinger Band opening is narrowing, the MACD technical indicator is running in a golden cross, and the RSI fluctuates frequently in the short term. There is a certain potential for short-term promotion. If the gold price stabilizes above 3315, it may trigger a rebound and touch 3330-3340 again. If the gold price continues to be below 3300 and the short position is strengthened, it may fall to a new low. Therefore, if it rebounds again to the 3330-3340 resistance line, short positions can still be considered.
🏅 Trading strategies:
BUY 3315-3318
TP 3330-3335
SELL 3330-3340
TP 3300-3290-3280
If you agree with this view, or have a better idea, please leave a message in the comment area. I look forward to hearing different voices.
OANDA:XAUUSD FX:XAUUSD FOREXCOM:XAUUSD FXOPEN:XAUUSD TVC:GOLD
Goldpreis
Perfect prediction of Monday's opening trendGold opened near 3310 today, and fell under pressure after reaching a high of 3321, which was in line with our previous prediction of the short-selling layout in the 3320-25 area. We successfully entered the short order and successfully stopped profit at 3305. Then the market was supported and stabilized near 3296. We decisively went long and also realized profit.
From the current trend, the short-term suppression during the day is still focused on the 3320-3325 line, and the key suppression area is around 3338-3345. Gold closed in an inverted hammer shape last week. From a technical point of view, the rebound is still mainly short-selling. If you are not in a good rhythm in gold trading recently, welcome to communicate and reduce unnecessary trial and error.
【Short-term technical analysis】
The upper short-term pressure focuses on the 3320-3325 area. If it rebounds to this point, it will be short first and look for a decline. If it rises strongly to the 3338-3345 range, it will still be the focus of short positions. The lower support focuses on the 3295-3285 area. The overall strategy of "high-short-low-long" is maintained. It is not recommended to frequently chase orders in the middle position. Be patient and wait for key point signals. I will remind you of the specific entry and exit plan during the session. It is recommended to pay attention in time.
【Gold operation strategy】
1. Go short first at the rebound 3320-3325 line. If it touches the 3338-3345 area, you can cover your position and go short. The target is 3306-3295. If it breaks, continue to hold and look down.
How will gold perform in the future?Market news:
In the early Asian session on Monday (June 9), spot gold opened high and fell, currently trading around $3,305/ounce. The large-scale riots in Los Angeles, the United States, attracted some safe-haven buying to support the London gold price. The stronger-than-expected US employment report hit the Federal Reserve's hopes of cutting interest rates this year, and silver once surged to its highest level since 2012. Data from the US Department of Labor showed that employers added 139,000 jobs in May, less than 147,000 in April, but more than the 130,000 increase predicted by a survey of economists. After the data was released, the financial market bet that the Federal Reserve would not cut interest rates until September, and the probability of a rate cut in September dropped from 88% to 60%. There will be two rate cuts in 2025, reducing bets on a possible third rate cut.In the next week, the market will usher in major trade negotiations and heavyweight US CPI data, which investors need to pay close attention to. In addition, US federal law enforcement officers continued to search for illegal immigrants in many places in Los Angeles County on the 7th, and had serious conflicts with local community residents for the second consecutive day. Investors also need to pay attention to the impact of market sentiment.
Technical Review:
Technically, gold plunged sharply after midnight on Friday, and the weekly line closed with a long upper shadow line and a small positive. The 3400 mark encountered resistance and fell sharply and fell into another adjustment cycle. The daily line closed with a continuous negative structure, and the New York closing price once again lost the MA10-day moving average of 3330. The price returned to the middle track of the Bollinger band at 3310, and the RSI indicator's central axis 50 value flattened! The short-term four-hour chart MA10/7-day moving average opened downward, the RSI indicator's central axis 50 value ran below, and the Bollinger band opened downward and the price ran along the middle and lower tracks. At the beginning of the week, trading focused on the rebound strength after the oversold. The main idea was to sell at a high price on the rebound, and to buy at a low price as an auxiliary.
Today's analysis:
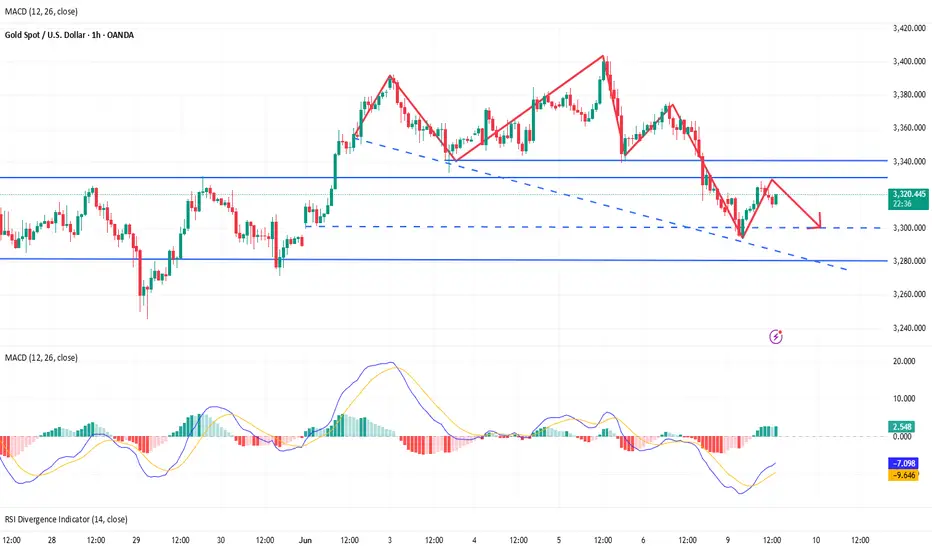
At the daily level, the price of gold has maintained a volatile pattern in recent times. The Bollinger band opening narrowed, indicating that the buying and selling forces were stalemate. MACD fast and slow lines are above the zero axis, the spacing is narrowing and there is a golden cross trend, the red kinetic energy column is beginning to appear, the buying power is slowly gathering, the RSI indicator is around 55, and the buying and selling game is fierce! From the hourly line, the Bollinger Bands open downward, and selling is temporarily dominant.MACD dead cross operation, the green kinetic energy column continues to increase, the 5-day moving average crosses the 10-day moving average, and the short-term downward trend is obvious. However, the current support near 3300 is strong, and it rebounded after multiple dips. In the future, we need to pay attention to the breakthrough of key positions to grasp the trading opportunity.
Operation ideas:
Short-term gold 3283-3286 buy, stop loss 3275, target 3310-3330;
Short-term gold 3330-3333 sell, stop loss 3342, target 3290-3270;
Key points:
First support level: 3293, second support level: 3271, third support level: 3253
First resistance level: 3330, second resistance level: 3356, third resistance level: 3378
XAU/USD(20250609) Today's AnalysisMarket news:
Fed Harker: Amid uncertainty, the Fed may still cut interest rates later this year. Musallem: There is a 50% chance that the trade war will lead to a sustained inflation outbreak. Tariffs may push up inflation within one or two quarters. The ECB cut three key interest rates by 25 basis points. Lagarde hinted that the rate cut cycle will end, and the market is no longer fully pricing in another 25 basis point rate cut this year.
Technical analysis:
Today's buying and selling boundaries:
3330
Support and resistance levels:
3398
3373
3356
3304
3288
3262
Trading strategy:
If the price breaks through 3330, consider buying in, with the first target price of 3356
If the price breaks through 3304, consider selling in, with the first target price of 3288
Gold on Monday depends on this wave of operationsBefore the non-agricultural data on Friday, gold maintained an overall oscillating pattern, opening at 3354, briefly rising to around 3375 and then falling under pressure, entering an overall oscillating downward mode. We also caught the rhythm of long orders many times and successfully exited the market with profits. Although the non-agricultural data was bearish, gold did not dive quickly, but rebounded to around 3363 after short-term fluctuations, and then fell under pressure again, and finally closed in an inverted head shape, with obvious technical bearish signals.
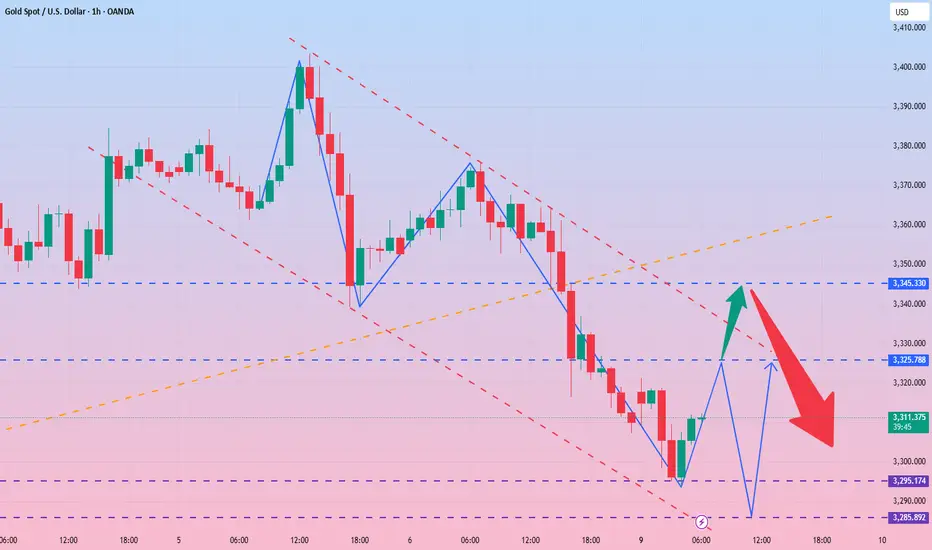
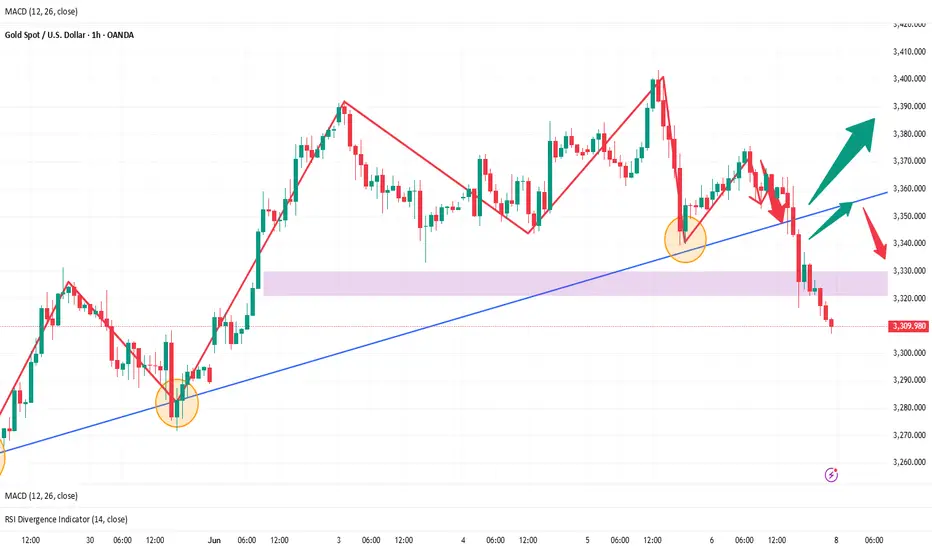
From the perspective of form, gold is expected to continue to rebound high and high next week. Focus on the support of this week's low point of 3296. Once it falls below, it is possible to further explore the 3270-3260 area. However, if this position remains stable and unbroken, the market still has room for rebound and repair.
From a specific technical perspective, the obstructed decline of the 3375 line on Friday is more critical, with the lowest intraday drop to 3307, and the bearish momentum is still strong. It is recommended to be prudent in operation and do not blindly chase orders.
🔸Operation ideas for gold next week:
1️⃣ If it rebounds to 3320-3325, you can try to arrange short orders. If it rebounds further to 3338-3345, it is recommended to cover short positions.
2️⃣ The first target is the 3295-3306 area. If it effectively falls below, continue to hold and look for a lower position.
3️⃣ The support below is focused on the 3295-3285 area, and the pressure above is still mainly 3335-3345. The market is mainly oscillating in the middle of the range. It is recommended to watch more and act less, and wait for key point signals before intervening.
If you are currently having trouble with gold operations, welcome to communicate with me. I will update the strategy as soon as possible according to the intraday market and try my best to make your investment less detours.

Analysis of gold price trend next week!Market news:
This week (June 2 to June 6), the spot gold market has become more volatile due to the interweaving of multiple factors. Spot gold prices fell more than 1% on Friday due to the impact of strong US employment data, but still recorded a 0.8% increase for the whole week, showing the game between safe-haven demand and the strengthening of the US dollar. The trade uncertainty caused by Trump's tariff policy, the continued increase in international gold holdings by global central banks, and the tense geopolitical situation provide support for London gold prices, while the solid US employment data pushed up US Treasury yields, weakened the Fed's expectations of rate cuts, and put pressure on international gold prices. The market continues to pay attention to geopolitical risks and trade uncertainties. Silver performed even better, hitting its highest level since 2012, and platinum and palladium also recorded weekly gains. The precious metals market as a whole was driven by speculative funds. The market's uncertainty about the Trump administration's steel and aluminum tariffs and fiscal policies has driven global central banks to increase their gold holdings. And the cautious attitude of Federal Reserve officials towards rate cuts is beneficial to long-term demand for gold. Next week, the US CPI data and the progress of trade negotiations will become the focus of the market. If inflationary pressure rises, it may further push up US bond yields and put pressure on gold prices; if the data is soft, it may rekindle expectations of interest rate cuts, which is good for gold. In addition, the progress of trade negotiations and geopolitical risks such as the conflict between Russia and Ukraine will continue to affect market sentiment.
Technical Review:
From the perspective of this week's market, the high-rise and fall-down trend continued, and the low point was refreshed. The signal that gold is heading towards an extremely weak pattern is getting stronger and stronger, and selling has the capital to pierce 3300. From a technical perspective, on the weekly chart, this week's high-rise and fall closed with an inverted head, and the MACD indicator showed signs of a dead cross downward at a high level. The current pattern is conducive to continued selling! On the daily chart, two consecutive negative lines on the daily chart caused the price to run below the short-term moving average, and led to a downward trend near the 10-day moving average of 3330. The 5-day moving average also followed closely at around 3355. In addition, the upward momentum of other periodic indicators weakened, and the MACD indicator showed a dead cross downward pattern, so the daily chart should tend to be short. However, one thing is worth noting, that is, after the gold price rebounded at 3307 on Friday, the middle track of the Bollinger Band has moved up, which means that the buying defense has been strengthened. Therefore, while the daily line is biased towards selling, we must also pay attention to the strength of the bulls' counterattack.
Next week's analysis:
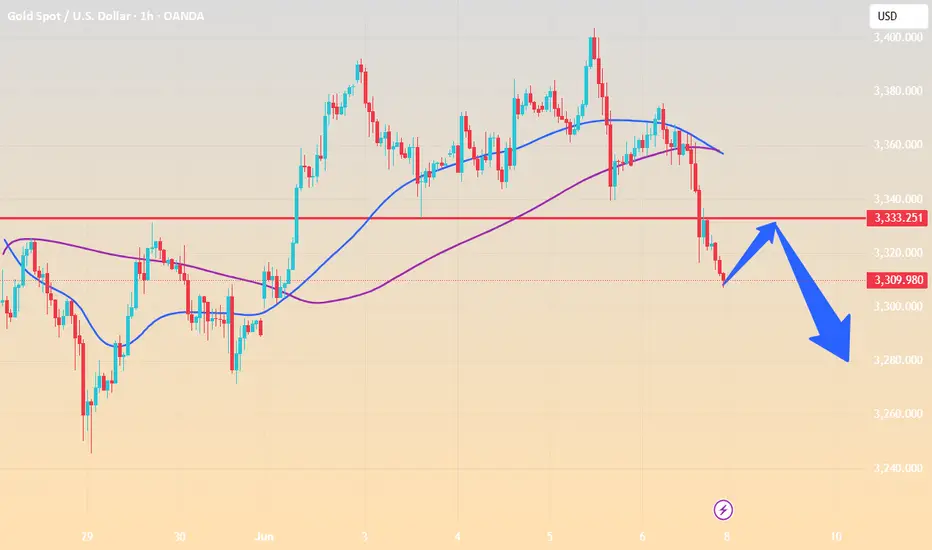
Next week's operation suggestion is to maintain the idea of selling as the main idea, supplemented by buying at low prices. For the upper resistance, pay attention to the 3328-3330 area first, and then pay attention to the 3345-3350 area. The former is regarded as the key to selling and exploring the low point, or even breaking the middle track of the Bollinger Band at 3295, which is also the low point of this week. The latter is a strong defense for selling in the short-term shock trend! In other words, selling below 3330 can complete the touch of the low point or new low next week in the short term, while selling below 3350 is still expected to test the new low, but the time period will be extended. As for the support below, focus on 3280. It is expected that it will be close to or touched at the beginning of next week, but whether it can break directly needs to be judged according to the actual trend, so it is best to wait for it to touch or break once before taking more. The 1-hour moving average of gold has formed a dead cross downward, so gold still has downward momentum. After the 1-hour high box of gold oscillated, gold finally broke through the box downward, indicating that gold is better sold. Then the bottom of the gold box has now formed resistance, and the short-term 3333 line of gold has formed resistance to gold. If gold is under pressure at 3333 at the beginning of next week, then gold can continue to be sold.
Operation ideas:
Buy short-term gold at 3277-3280, stop loss at 3268, target at 3310-3330;
Sell short-term gold at 3330-3333, stop loss at 3342, target at 3300-3280;
Key points:
First support level: 3300, second support level: 3280, third support level: 3261
First resistance level: 3330, second resistance level: 3348, third resistance level: 3375
Accurately grasp the gold trend analysis next week📰 Impact of news:
1. The geopolitical situation is gradually deteriorating
2. Trump again calls on the Federal Reserve to cut interest rates
📈 Market analysis:
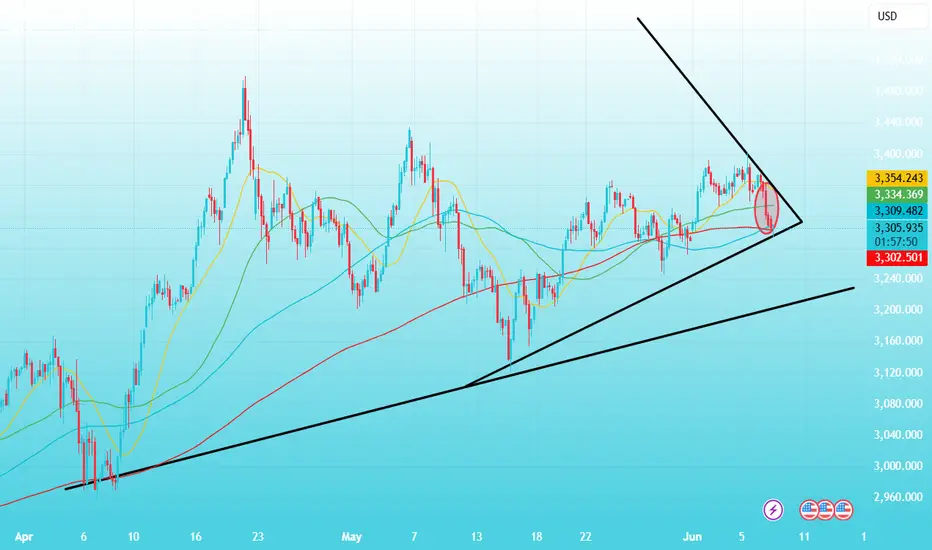
The current weekly moving average support for gold prices is roughly 3250-3260. If 3250-60 can be maintained, then gold may continue to maintain consolidation and wait for an opportunity to choose a trend. If it falls below 3250, then it can directly see the 3200 mark. If 3200 falls below again, then it will see 3100. In the short term, the first focus of the gold price below is 3315. As long as it stays above 3315, gold is still in a bullish trend. Secondly, pay attention to the 3280 line below. If it falls below 3280, the gold price will further test the support of 3260-3250. It is possible that gold will form a head and shoulders top structure on the daily chart next week. It may fall to 3250-60 at the beginning of the week to lure shorts into the market, and then stretch and rebound to around 3350 to form a shoulder position, and finally directly dive down to around 3150.
If you agree with this view, or have a better idea, please leave a message in the comment area. I look forward to hearing different voices.
OANDA:XAUUSD FX:XAUUSD FOREXCOM:XAUUSD FXOPEN:XAUUSD TVC:GOLD
With bulls and bears in a stalemate, where will gold go?Gold fell under pressure around 3384 in the early trading on Thursday, and then rebounded after falling to 3361. The highest in the European session reached around 3403, and then fell back due to resistance. The US session accelerated its decline, reaching a minimum of 3339, and then rebounded in the late trading, closing in the negative on the daily line. The daily trend continued to fluctuate in a positive and negative cycle. On Thursday, it rose and fell, closed in the negative and fell below the 5-day moving average.
Today, we will focus on the resistance position of 3405. Whether it can break through will determine the strength of the bulls in the future market. The risk of continuous negative daily lines cannot be ruled out. The support below is the key points of 3330 and 3300. The 4-hour fluctuation range is locked at 3385-3335. The fluctuation space in the Asian and European sessions is limited. It is recommended to sell high and buy low. For stable trading, it is recommended to go long in the 3340-3350 area. The overall bullish trend has not changed, and the impact of non-agricultural data is limited. It is expected that gold will most likely rise and fall. Remember not to chase the rise and sell the fall, and wait patiently for opportunities.
Steady trading, precise attack!

XAU/USD(20250606) Today's AnalysisMarket news:
The European Central Bank cut three key interest rates by 25 basis points. Lagarde hinted that the rate cut cycle will end, and the market is no longer fully pricing in another 25 basis point rate cut this year.
Technical analysis:
Today's buying and selling boundaries:
3365
Support and resistance levels
3428
3404
3389
3340
3325
3301
Trading strategy:
If the price breaks through 3365, consider buying, the first target price is 3389
If the price breaks through 3340, consider selling, the first target price is 3325

Double top pressure appears Gold short-term bearishThe current price shows a sign of hesitation after experiencing a sharp rise. The bulls hit a high of 3384 twice and then pulled back. The high point and yesterday's high point formed a double top suppression. Two attempts to test Monday's high of 3392 failed, indicating that the bullish momentum has weakened. The short-term high-altitude strategy for gold is mainly used. Pay attention to the key support of 3340-3345 below. If it is effectively broken, it may fall to the 3325 trend line conversion support level below. In terms of operation, it is recommended to rely on the double top pressure of 3384-3392 to arrange short orders at highs. Market volatility may intensify before the release of non-agricultural data.
Gold operation suggestions: short gold near 3384-3392, target 3370-3360.
XAU/USD(20250605) Today's AnalysisMarket news:
U.S. economic data-① ADP employment increased by 37,000 in May, far below the expected 110,000 and the previous value of 62,000. ② The U.S. ISM non-manufacturing index in May fell to 49.9, shrinking for the first time in nearly a year, and the expected increase was from 51.6 to 52.
Technical analysis:
Today's buying and selling boundaries:
3366
Support and resistance levels:
3407
3392
3382
3351
3341
3326
Trading strategy:
If the price breaks through 3382, consider buying in, and the first target price is 3392
If the price breaks through 3366, consider selling in, and the first target price is 3351
Bull market returns? Aiming at 3400?📰 Impact of news:
1. New uncertainty in Russia-Ukraine negotiations
📈 Market analysis:
The current trend of gold prices is erratic and discontinuous, and only swing trading can be adopted during the day. In the short term, there is a certain pressure at 3385-3395 above. If this resistance area is broken, the gold price is expected to continue to rise. The short-term support below FOREXCOM:XAUUSD is at 3350-3340. At present, the news has a greater impact on the gold price, coupled with the support of market risk aversion, so in the short term, attention should be paid to the break of the upper resistance.
🏅 Trading strategies:
BUY 3370-3365
TP 3385-3395-3400
SELL 3395-3400
TP 3380-3370
BUY 3350-3340
TP 3370-3380
If you agree with this view, or have a better idea, please leave a message in the comment area. I look forward to hearing different voices.
OANDA:XAUUSD FX:XAUUSD FXOPEN:XAUUSD TVC:GOLD
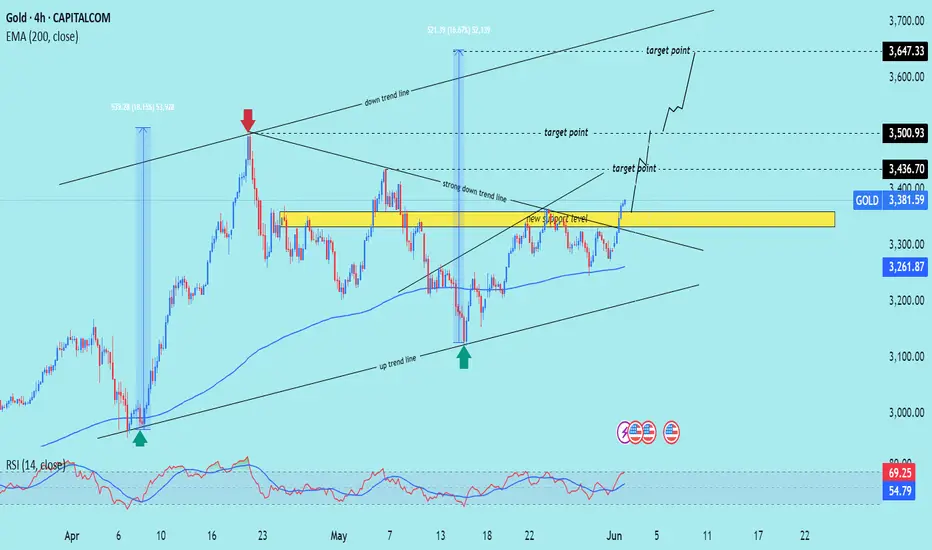
XAU/USD) Breakout strong bullish trend Read The captionSMC Trading point update
Technical analysis chart of gold (XAUUSD) on the 4-hour timeframe. Here’s a breakdown of the key ideas presented in the chart:
---
Key Support/Resistance Zone
A yellow rectangular zone marks a significant support/resistance level.
This level was previously a resistance and has now been flipped into support ("new support level").
---
Trend Analysis
Uptrend line (lower diagonal line): Shows support and higher lows forming a bullish structure.
Downtrend lines (upper diagonals): Show past resistance levels being tested.
Strong downtrend line has now been broken, which is bullish.
---
Target Points
Three bullish targets are marked:
1. $3,436.70
2. $3,500.93
3. $3,647.33
These targets seem to be based on:
Breakout above the resistance zone.
Measured move projections from previous impulsive rallies.
---
Technical Indicators
200 EMA (Exponential Moving Average): Currently at $3,261.87, acting as dynamic support.
RSI (Relative Strength Index):
Current RSI is 54.80, indicating neutral momentum.
Previously touched overbought zone (~69), indicating strong recent bullish momentum.
---
Arrows
Green arrows mark strong bullish bounce points.
Red arrow marks a rejection from the downtrend line (previous resistance).
Mr SMC Trading point
---
Conclusion (Idea Summary)
Price has broken out of consolidation and downtrend resistance.
If the price holds above the yellow support zone and 200 EMA, a bullish continuation is likely.
Targets: $3,436 → $3,501 → $3,647.
Confirmation of breakout and momentum depends on volume and RSI behavior in coming candles.
---
pelas support boost 🚀 analysis follow)
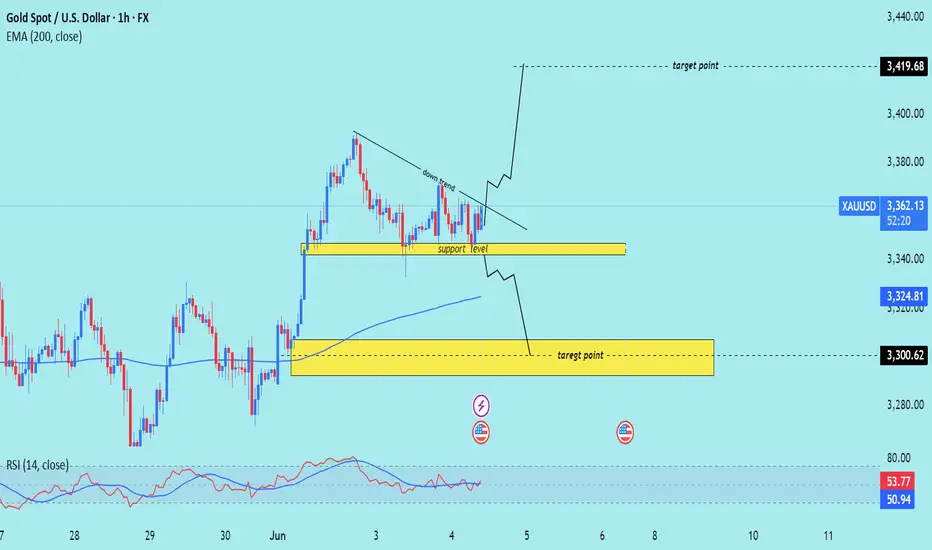
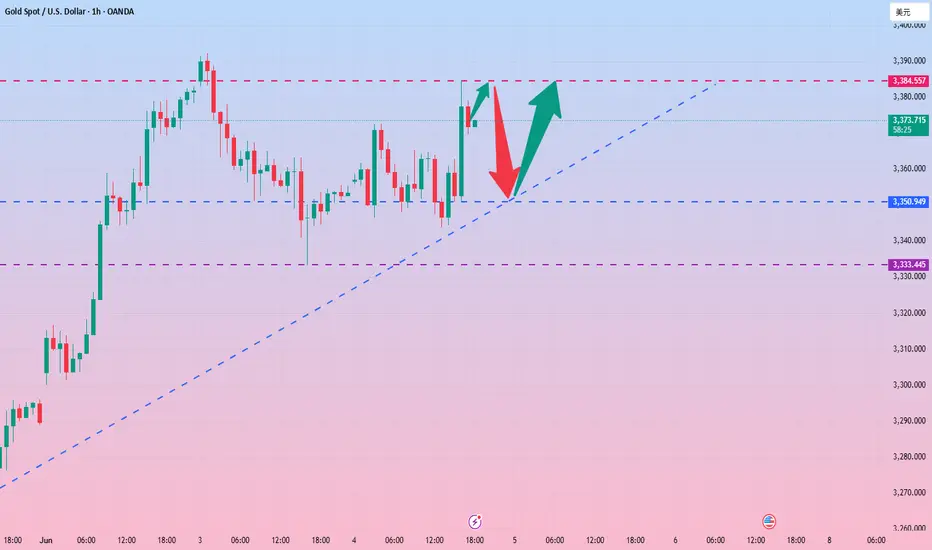
XAU/USD) Technical analysis Read The captionSMC trading point update
Technical analysis of Gold (XAUUSD) on the 1-hour timeframe. Here's a breakdown of the key ideas in the analysis:
---
Chart Elements:
Support Level (Yellow Zone at ~3,340–3,350):
This area has been highlighted as a key support zone where price has bounced previously.
Price is currently hovering just above this level.
Downtrend Line:
A descending trendline is drawn, indicating a short-term bearish trend.
A breakout above this line could trigger bullish momentum.
Two Scenarios Outlined:
Bullish Scenario:
If price breaks the downtrend and holds above support, it may rally towards the upper target point at 3,419.68.
Bearish Scenario:
If price breaks below the support, the next target point is marked lower around 3,300.62, a previous consolidation area and close to the 200 EMA (blue line).
200 EMA (~3,324.72):
Acts as dynamic support. If price moves below it, bearish sentiment may increase.
RSI (Relative Strength Index):
RSI is neutral (~50.54), not showing overbought or oversold signals, leaving room for movement in either direction.
---
Key Takeaways:
Neutral-Biased Setup: The price is consolidating between a clear support level and downtrend resistance.
Confirmation Needed: A breakout from either direction is necessary to confirm the next move.
Bullish Breakout: May lead to a retest of highs at 3,419.68.
Bearish Breakdown: Could push the price toward 3,300.62, aligned with past support and the 200 EMA.
Mr SMC Trading point
---
Trading Ideas (based on this analysis):
Long Entry: On breakout above the downtrend line + confirmation above 3,360.
Short Entry: On breakdown below 3,340 with strong volume.
Stop-Loss: Just outside the consolidation zone depending on trade direction.
Risk Management: Be cautious around economic news (calendar icons shown suggest upcoming events).
Please support boost this analysis )
Although the market fluctuates, the rhythm is not chaotic.Today's public strategy suggested shorting gold at 3365, and accurately predicted the retracement of the resistance level again. The brothers who followed up again reaped good rewards. Then arranged long orders in the 3344-3345 range, and exited the market at 3360 after the market fell and rebounded; then arranged short orders at 3360-3361, and fell again under pressure, and successfully took profits at the target of 3350. Although the short-term fluctuations were large, we finally managed to grasp the rhythm steadily and reaped ideal profits.
Judging from the current trend, as long as the short-term gold market is above 3330, gold will still be in a strong bullish trend. On the contrary, if it falls below the closing line near 3330, it will break the trend line, and the subsequent market will most likely form a weak shock pattern. Therefore, the current operation is actually very simple. As long as the 3330 position is not broken, you can rely on the 3330 area to enter the market and do more. Pay attention to the support near yesterday's low point of 3333 below, and pay attention to the resistance near 3380-3390 above.
Gold operation suggestions: It is recommended to short gold with a light position near 3380-3385, with a target of 3370-3360, and go long near 3345-3350 when gold falls back, with a target of 3360-3370.
Gold trend analysis and layout before ADP data release📰 Impact of news:
1. May ADP data
2. The geopolitical situation worsens
📈 Market analysis:
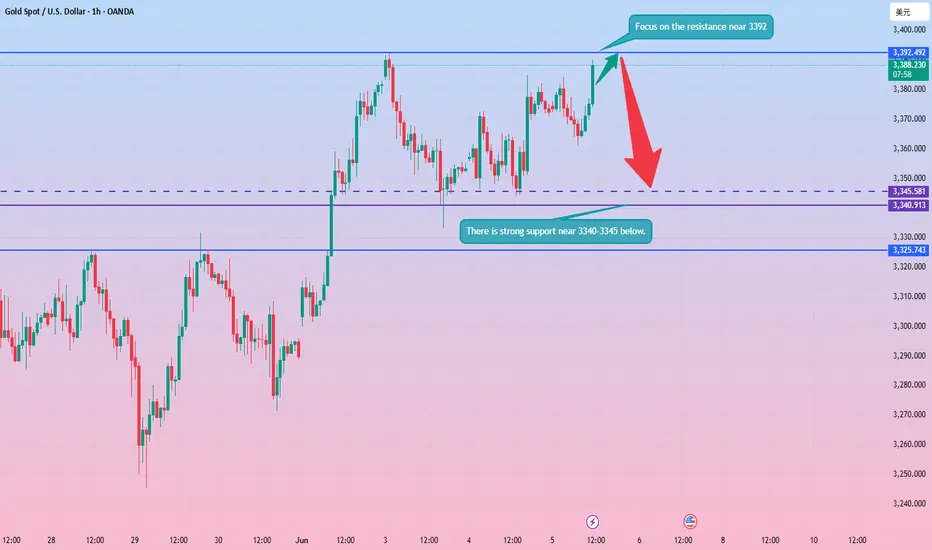
Today, the gold price in the Asian session hit the 3370 line and then began to fall. Before the release of the ADP data, the gold price is likely to fall into a volatile pattern. The upper short-term resistance is 3370-3380. Pay attention to whether it can break through 3392, which will determine whether the short-term gold price can reach 3400. Pay attention to the support below 3350-3345, and focus on the 3330 line support. Once it falls below 3330, the gold price may reach 3317. If the ADP data is released and stabilizes near 3317, and then quickly closes the long lower shadow. Then you can rely on the 3317 to enter the market and do more. As long as it rebounds to above 3330 again, then the high point near 3390 above will definitely not be maintained. On the contrary, if gold falls below the 3330 and 3317 levels during the US trading session, don't go long easily. Participate in the high-altitude and low-multiple cycle during the European session. If it retreats to 3355-3345, consider going long with a light position and look at 3360-3370. If it touches 3375-3390 and is under pressure, consider shorting. Focus on ADP data!!
🏅 Trading strategies:
BUY 3355-3345
TP 3360-3370
SELL 3375-3390
TP 3350-3340
If you agree with this view, or have a better idea, please leave a message in the comment area. I look forward to hearing different voices.
OANDA:XAUUSD FX:XAUUSD FOREXCOM:XAUUSD FXOPEN:XAUUSD TVC:GOLD
Gold is taking a break, the next wave will be even stronger.Gold opened at 3382 today and rebounded to 3392 for a technical decline adjustment. So far, gold has hit a low of 3351. Currently, gold continues to fluctuate around 3360. We will pay attention to the support situation at 3345-50 below. If it does not break through, we will look for opportunities to go long.
Judging from the current trend of gold prices, the overall bullish trend remains, and there is still the possibility of further upward movement in the short term. The support below focuses on the 3345-3350 area, which is an important defensive position for short-term bulls. If it falls back to this area and stabilizes during the day, you can continue to rely on this position to arrange long orders, and the bullish thinking remains unchanged. Pay attention to the 3395-3400 first-line pressure above. If this range is effectively broken, the gold price is expected to hit the previous high and further open up the upward space. From the daily level, the market is still in the "low-long" rhythm of the trend, and it is expected to maintain a volatile upward trend in the short term. The recent market fluctuations are large. In terms of operation, it is necessary to strictly control the position and pay attention to risk prevention.
Gold operation strategy recommendation: Go long when gold falls back to 3345-3355, target: 3380-3390.

Evening gold analysis and trading point layout📰 Impact of news:
1. Fed's Goolsbee: Despite the unresolved tariff issue, it is still believed that interest rates are expected to fall in the next 12 to 18 months
2. May PMI data is positive
3. Russian media: Russia lists the full withdrawal of Ukrainian troops from Russian territory as one of the ceasefire options
📈 Market analysis:
Judging from the 4H chart, gold is currently fluctuating around the 3370 line, and the bulls are still relatively strong. We should pay attention to the short-term support at 3365-3355 below, and the short-term suppression at 3385-3395 above. If it breaks through the upper suppression, we will pay attention to the 3400 line suppression position. The recent market fluctuations have been relatively large, so bros must set take-profit and stop-loss when trading independently!
🏅 Trading strategies:
BUY 3365-3355
TP 3370-3380-3400
If you agree with this view, or have a better idea, please leave a message in the comment area. I look forward to hearing different voices.
TVC:GOLD FXOPEN:XAUUSD FOREXCOM:XAUUSD FX:XAUUSD OANDA:XAUUSD

GOLD...Hello friends
Due to the entry of buyers and the strong breakdown of the indicated resistance, the price is expected to move to the indicated targets.
*Trade safely with us*
Short position opportunity at 3366 suppression pointAt present, the focus of gold is on the previous high point of 3360-3366. If the rebound fails to effectively break through this range, you can consider entering a short position. Although gold is in a high-level oscillation stage, you should not blindly chase more. If the upper suppression continues to be effective, there is a risk of a technical correction. If you encounter confusion in operation, please feel free to communicate at any time; if the current gold operation is not ideal, I hope to help you avoid risks and reduce investment detours. I look forward to your contact.
From the perspective of the 4-hour cycle, the upper resistance focuses on the 3360-3366 line, and the short-term support below focuses on the 3320-3325 area. It is recommended to keep operating in line with the trend and follow the main trend unchanged.
Operation strategy: When gold rebounds to the 3360-3366 line and fails to break through, arrange short positions, and target the 3320-3325 range.

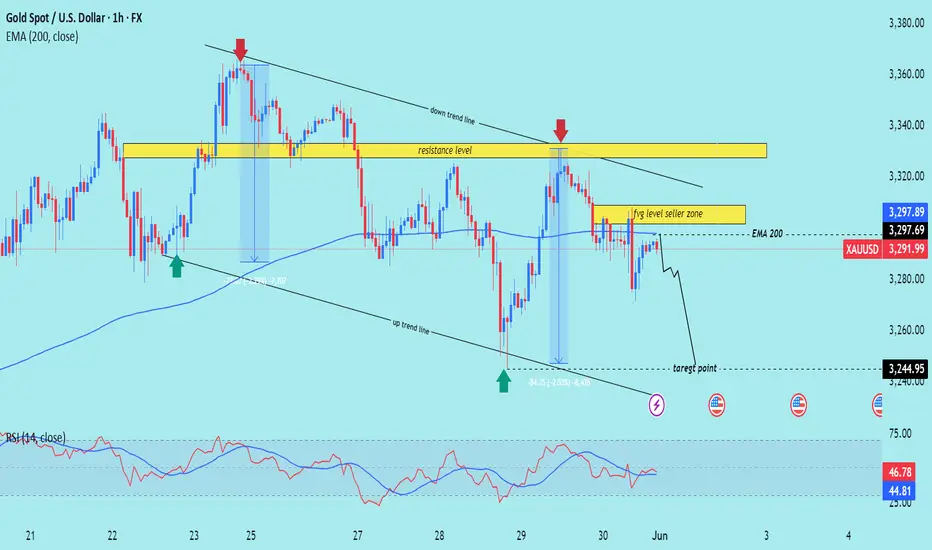
XAU/USD) Bearish trand analysis Read The ChaptianSMC trading point update
Technical analysis of XAU/USD (Gold Spot) on the 1-hour timeframe, based on Smart Money Concepts (SMC). Here's a breakdown of the idea and trading scenario:
---
Overall Idea: Bearish Continuation
---
Market Context
Current Price: $3,291.99
EMA 200: $3,297.69 (acting as dynamic resistance)
Trend: Price is within a descending channel, respecting both downtrend and uptrend lines
Directional Bias: Bearish unless a breakout occurs
---
Key Zones
1. Resistance Level (Sell Zone)
Around $3,320–$3,340
Price rejected this level multiple times → strong supply zone
2. FVG Level (Fair Value Gap)
Around $3,305–$3,315
Price tapped this area and showed rejection
Identified as a "seller zone" – price likely filled imbalance and now resuming trend
---
Projected Move
Price is expected to:
1. Reject EMA and FVG zone
2. Continue downward movement
3. Target support around $3,244.95
---
Indicators
EMA 200: Above price → bearish pressure
RSI (14): ~46.78 → no extreme reading, but leans bearish; room for further downside
---
Trade Idea Summary
Bias: Bearish
Sell Entry: ~$3,300–$3,310 (already triggered)
Stop Loss: Above $3,320
Target: $3,244.95 (demand zone / previous low)
Risk/Reward: Favorable (~1:2+)
Mr SMC Trading point
---
Warnings
Multiple economic event icons are marked (bottom of chart) → potential high volatility, especially around NFP/FOMC-related news
---
pales support boost 🚀 analysis follow)
The volatility is an illusion, and gold is brewing major changesGold fluctuated downward in the Asian session on Friday, while it remained in the range of 3287-3303 in the European session. Although it tried to break through the short-term pressure level of 3300-3306 many times, it has never been able to stand firmly. I arranged to go long at 3288-3289 in advance, notified to enter the market at the point, and finally reached the target of 3303 perfectly, earning 15 points of profit! Quick, accurate and ruthless, with the right idea, profit-taking is as easy as drinking water! Therefore, it is recommended that we continue to pay attention to the short-term support of 3290-3285 below. If the price fails to break through the support range like in the early trading, you can consider trying to enter the long position.
Given that today is Friday, the market volatility may be "demon-like", so you need to be extra cautious in operation and pay close attention to the changes in the market. At the same time, you must keep in mind the principle of "taking profits for safety"-lock in profits in time when you can see them, and don't easily bet on trends that you don't understand. If your current gold operation effect is not ideal, I hope my analysis can help you avoid some detours. Welcome to communicate at any time!
Today, the monthly, weekly and daily lines closed simultaneously. At the same time, the PCE data will be released during the US trading session, and the market volatility may intensify.
From a technical point of view, 3285 is also the key to long and short today. If gold does not break 3285 today, the strength of gold bulls is expected to continue, and there is still room for gold to move upward. If gold continues to fall and falls below 3285, then gold may begin to fluctuate in a large range. The upper resistance is in the 3320-3330 area, and the focus is on the 3335-3340 line of suppression. Pay attention to the 3290-3285 line of support below, and the key position below is in the 3280 area. If it breaks below the 3280 area during the day, the market is expected to fall again to the 3265-3250-3240 area.

Gold rebounds in the US market and continues to be short!
📊Comment analysis
Gold rose yesterday under the stimulus of risk aversion, so gold did not continue to rise today, which means that the risk aversion sentiment of gold has been digested, and the 1-hour moving average of gold has also begun to turn downward and has not crossed upward, so the momentum of gold shorts has begun to increase, and gold rebounds and continues to be short. After gold surged, it has been under pressure at the 3310 line and cannot break through. Therefore, gold rebounds in the US market and continues to be short at highs under pressure at 3310.
💰Strategy Package
US trading operation ideas:
Gold 3304-3310 short, stop loss 3315, target 3280-3270-3260;
⭐️ Note: Labaron hopes that traders can properly manage their funds
- Choose the number of lots that matches your funds
- Profit is 4-7% of the capital account
- Stop loss is 1-3% of the capital account