The market is closed today. How to arrange gold in the evening?📰 Impact of news:
1. The interest rate remains unchanged and leads to new lows in the short term
2. Geopolitical tensions provide support for risk aversion
📈 Market analysis:
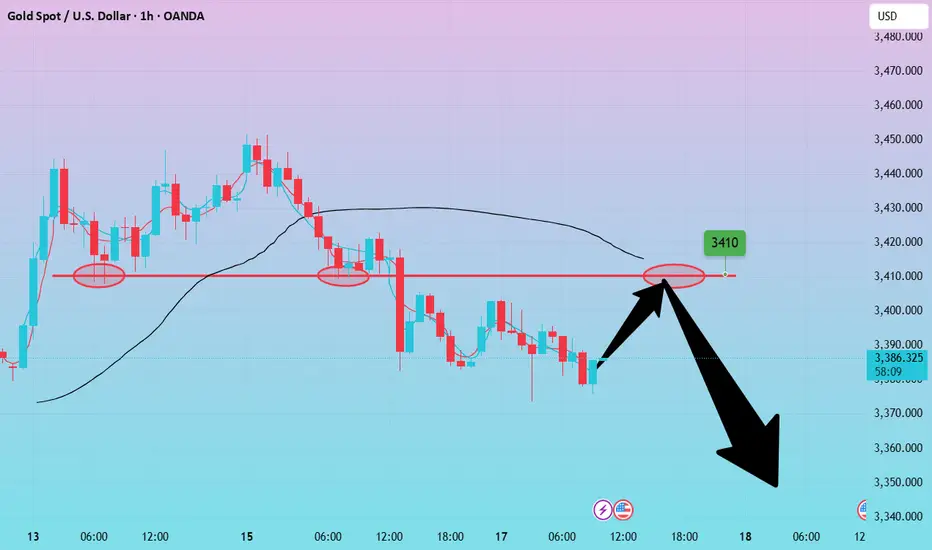
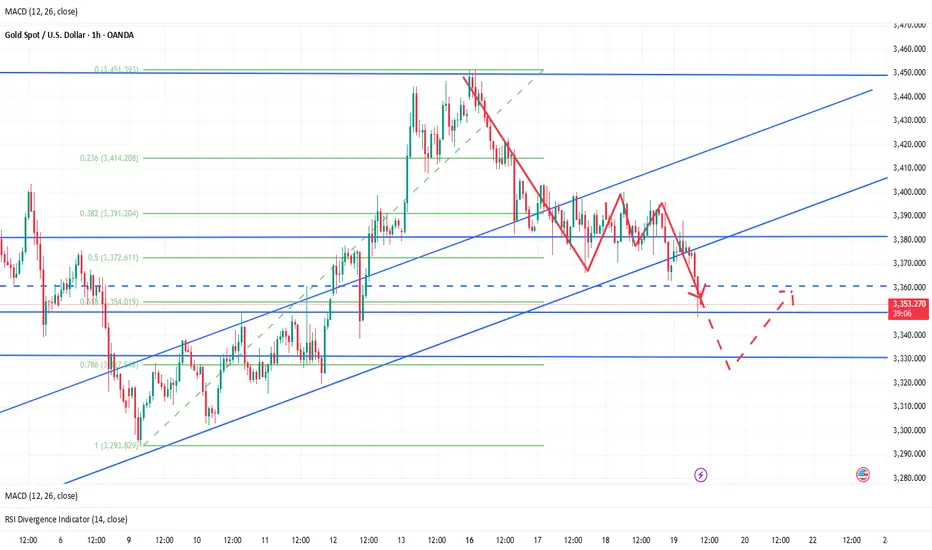
The market is expected to not fluctuate much today. Generally speaking, it is difficult to stand on one foot to form a short-term bottom. There should be a second wave of bottom exploration, a secondary low point, and then the bottom is explored and pulled up to break through the previous high point. Only then can the turning point be officially established and the decline end. Moreover, the 1H moving average is spreading downward. Therefore, in the short term, we still pay attention to the 3375-3385 line of resistance and the 3360-3355 line of support below.
🏅 Trading strategies:
SELL 3375-3385
TP 3365-3360-3355
BUY 3360-3355
TP 3370-3380-3405-3420
If you agree with this view, or have a better idea, please leave a message in the comment area. I look forward to hearing different voices.
TVC:GOLD FXOPEN:XAUUSD FOREXCOM:XAUUSD FX:XAUUSD OANDA:XAUUSD
Goldprice
The reason why gold was suddenly sold off
💡Message Strategy
Market dehydration news:
1. On Wednesday, the Federal Open Market Committee (FOMC) maintained a stable stance on interest rates, maintaining them in the target range of 4.25% to 4.5%. The Fed expects to implement two rate cuts this year, but policymakers expect inflation to rise. They also lowered their outlook for gross domestic product (GDP).
2. After the Fed's decision was released, the spot gold price fell sharply from the level near $3,396 per ounce; during Powell's speech, the gold price accelerated its decline, once falling to around $3,362 per ounce.
3. Powell said that the current policy stance is ready for flexible response, "At present, we are in a good position to wait for more information about the possible direction of the economy before considering adjusting policies."
4. Powell pointed out that the Fed needs to further understand the current situation before considering adjusting monetary policy. He said that given the continued changes in trade, fiscal and regulatory policies, the Fed needs more time to assess their impact on the economy.
📊Technical aspects
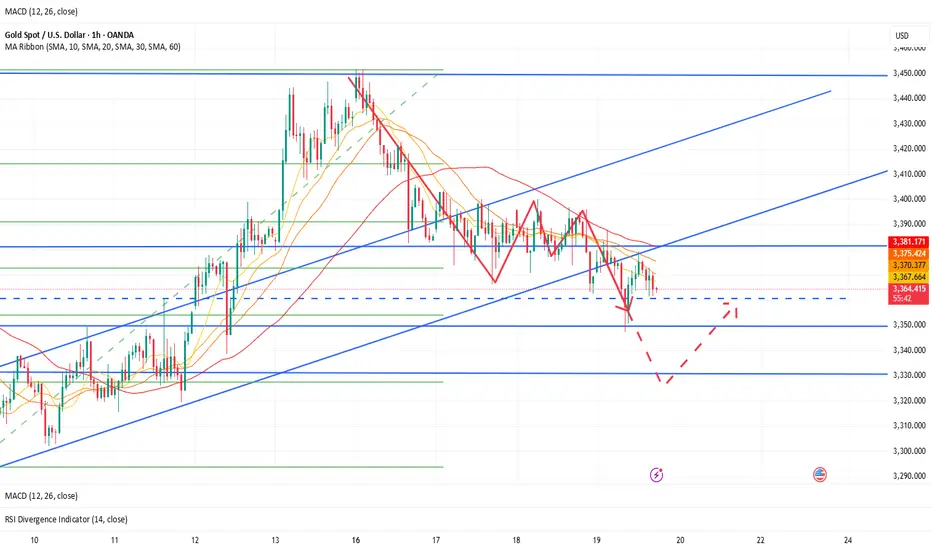
On the 1H chart of gold, gold fell back from a two-month high, hitting a new low in a week, and the short-term trend is biased towards adjustment.
For the upper pressure of gold, pay attention to the intraday high point of gold price rebound at 3380-90 US dollars, which is also near the 5-day moving average of the daily line. Secondly, pay attention to the integer position of 3400 US dollars, which is also the high point of gold price rebound on Wednesday. For further strength, pay attention to the upper track of the daily Bollinger band at 3425 US dollars;
For the lower support of gold, pay attention to the intraday low of 3355-60 US dollars, which is the middle track position of the daily Bollinger band and near the weekly MA5 moving average. The 5-day moving average golden cross turns down, the MACD indicator is close to forming a slight dead cross, the KDJ indicator dead cross slows down, and the RSI indicator dead cross turns up. The short-term technical aspect shows that there is a risk of correction in gold prices.
💰Strategy Package
Short Position:3390-3400,SL:3410,Target: 3370-3360
Long Position:3355-3365,SL:3345,Target: 3380-3390
XAU/USD) Back Bullish trand Read The captionSMC Trading point update
Technical analysis of Gold (XAU/USD) on the 3-hour timeframe based on a price action setup within a rising channel and a key support zone. Here's a breakdown of the analysis:
---
Technical Overview:
Trend Structure:
The price is moving within a rising channel (marked by the black trendlines). Recent touches on both the top and bottom of the channel suggest that it is being respected.
Key Support Zone (Yellow Box):
Price recently tested a strong support zone around $3,338 – $3,350, which aligns with:
Historical price reaction area.
The 200 EMA (blue line).
An uptrend line support.
A bullish reaction (green arrow) confirming demand.
Bear Trap Breakout:
There’s a false breakout below the support followed by a sharp reversal (green arrow), which could indicate a bear trap, often followed by a bullish rally.
Price Projection:
The projected move suggests a bullish rally toward $3,478.89, offering a potential 3.97% gain (~133 points).
The path includes a possible consolidation before a breakout (illustrated by the wavy arrow).
RSI Indicator:
RSI is recovering from the oversold zone (~45), indicating increasing bullish momentum.
Mr SMC Trading point
---
Trade Idea Summary:
Bias: Bullish
Entry Zone: Around $3,350–$3,370 (post-retest of support)
Target: $3,478.89
Confirmation: Bullish price action at support, 200 EMA bounce, RSI reversal
---
Please support boost 🚀 this analysis)

XAU/USD) Back support level Read The captionSMC trading point update
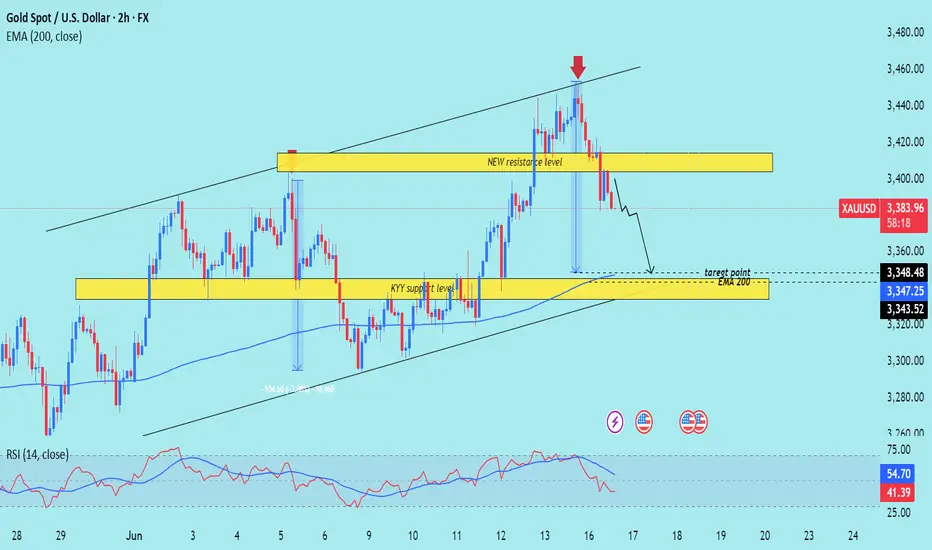
Technical analysis of XAU/USD (Gold Spot vs U.S. Dollar) – 2H Timeframe:
---
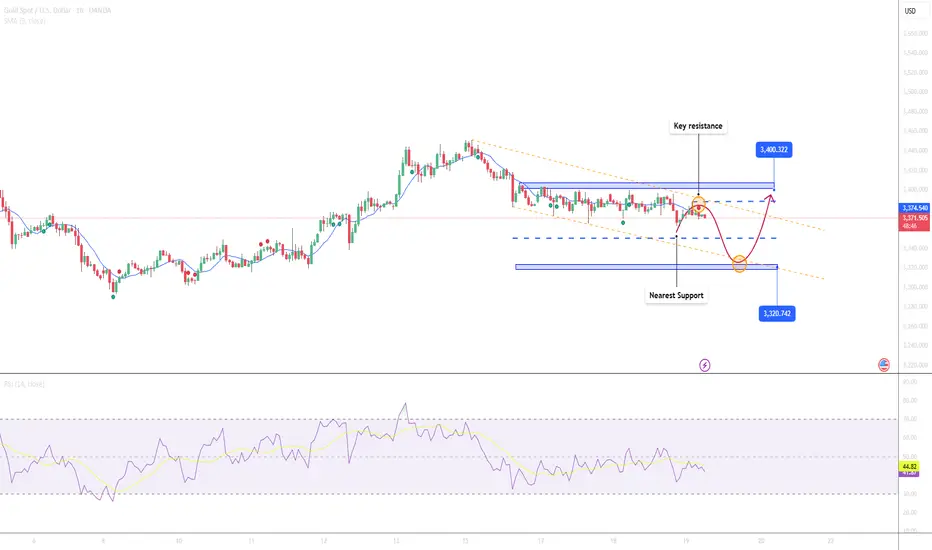
XAU/USD Bearish Rejection from Resistance – Short-Term Sell Setup
Key Observations:
1. Rejection from Upper Channel & Resistance Zone:
Price was rejected sharply after touching the upper boundary of the ascending channel and the newly established resistance zone (~3400–3420).
A strong bearish candle confirms selling pressure at the top.
2. Support Retest in Progress:
The price is currently descending toward the EMA 200 and the KYY support zone (approximately 3343–3348).
The previous bounce originated from this level, making it a significant retest zone.
3. EMA 200 as Confluence:
The 200 EMA (currently at 3346.92) aligns with the support zone, increasing the likelihood of a bounce or at least temporary pause in bearish momentum.
4. RSI Bearish Signal:
RSI has dropped below 50, confirming a momentum shift toward the downside.
Still above oversold territory, suggesting more downside room.
---
Trade Idea:
Bias: Bearish (Short-Term)
Entry Zone: Around 3390–3400 (confirmed rejection area)
Target Zone: 3348 – 3343 (KYY support + EMA 200)
Stop Loss: Above 3425 (just above resistance zone)
Mr SMC Trading point
---
Summary:
Gold has faced a clear rejection at a key resistance zone within an ascending channel, and is now targeting the EMA 200 and previous structural support. Short opportunities could be considered toward the 3343–3348 zone, with RSI and price action supporting the move.
Please support boost 🚀 this analysis)
Accurately grasp the interest rate trend, today's gold layout📰 Impact of news:
1. The interest rate remains unchanged and leads to new lows in the short term
2. Geopolitical tensions provide support for risk aversion
📈 Market analysis:
I told you yesterday that 3363 is not the recent low. Today's lowest point has reached around 3347. The current day's K-line closed with a medium-sized negative line with balanced upper and lower shadows. The shape shows that gold will fluctuate in the short term and be bearish. Therefore, it is not suitable to blindly guess the bottom in the short term. As geopolitical tensions still exist, it is expected that the lowest level may reach 3330. During the day, focus on the upper resistance range of 3380-3390. If the rebound is blocked, try to intervene with short orders. The lower support is at the key level of 3330-3320. Pay attention to the defense of the support area.
🏅 Trading strategies:
BUY 3335-3325
TP 3360-3380-3390-3400
SELL 3375-3385
TP 3365-3355-3345-3300
OANDA:XAUUSD FX:XAUUSD FOREXCOM:XAUUSD FXOPEN:XAUUSD TVC:GOLD
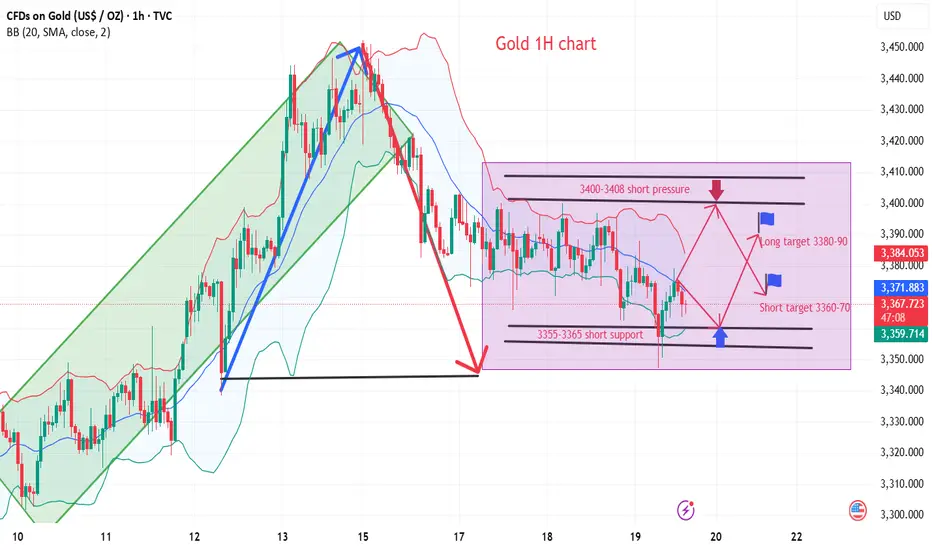
GOLD SHORT-TERM CORRECTION AFTER 3,360 – Consolidation likely📊 Market Summary:
Gold pulled back to around 3,363 USD, currently trading near 3,373 USD USD strength post-Fed comments and overbought conditions are prompting a short-term correction, while geopolitical tensions provide mild underlying support .
📉 Technical Points:
• Resistance: ~3,387–3,388, then 3,400 .
• Support: ~3,363, with secondary support 3,352–3,355 .
• EMA/SMA: Above EMA50, below 20 SMA (~3,347), indicating range-bound behavior
• Momentum: RSI & MACD neutral, Stochastic ~58%—suggesting sideways movement .
📌 Outlook:
Expect continued consolidation between 3,352–3,388. Breach above may lead to breakout, breach below possibly triggers pullback toward 3,320.
💡 Trading Plan:
SELL XAU/USD: 3,380–3,385
• 🎯 TP: ~3,360
• ❌ SL: ~3,395
BUY XAU/USD: 3,363–3,365
• 🎯 TP: ~3,380–3,387
• ❌ SL: ~3,350
Is 2025 the right time to make plans?Market news:
On Thursday (June 19) in the early Asian session, spot gold fluctuated in a narrow range and is currently trading around $3,380/ounce. As an important safe-haven asset in the global financial market, the price fluctuations of international gold are often affected by macroeconomic policies, geopolitical situations and market sentiment. Recently, the gold market has shown a complex and eye-catching trend under the dual influence of the Federal Reserve's interest rate decision and geopolitical tensions in the Middle East.The Federal Reserve decided to keep the benchmark overnight interest rate unchanged at 4.25%-4.50% at its meeting on June 18. This decision was in line with market expectations, but its subsequent statement brought new uncertainty to the London gold price market. This cautious stance weakened the market's expectations for the Federal Reserve's rapid easing, causing gold prices to fall 0.57% on Wednesday to close at $3,369/ounce.The current gold market is in a complex environment with multiple factors intertwined. The Federal Reserve's cautious monetary policy stance and inflation expectations caused by tariffs have brought short-term pressure on gold prices, but geopolitical tensions and signs of economic slowdown have provided potential upward momentum for gold prices. Pay attention to the dynamic changes in the global economy and geopolitics to seize investment opportunities in the gold market.
Technical Review:
Gold fell to the MA10-day moving average of 3662 in the early morning and counterattacked 3380 in the Asian session. The Asian session will continue to look at the rebound strength. The gold price will continue to fluctuate and adjust. The large range is 3408/3343, and the small range is 3390/3360. The daily chart fell back to the 10-day moving average at 3362, and the MA5/7-day moving average was suppressed at 3385/90. The RSI indicator continued to flatten the middle axis. The short-term four-hour chart price is running in the middle and lower tracks of the Bollinger Band!
This week, gold rose sharply to 3450 at the opening, and gradually fell slowly to 3365, with a strength of 100 US dollars. Although the main strength in the first two trading days was a decline, the buying trend remained unchanged. In an uncertain environment, there is still a chance of a big rise in the future. So this week's idea continues to maintain short-term selling and long-term buying.
Today's analysis:
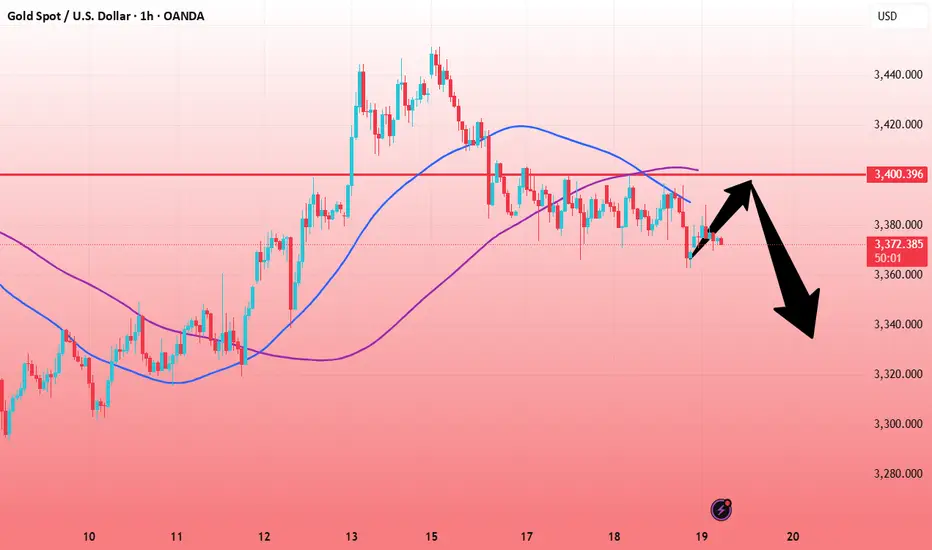
After the Fed's interest rate decision, the Fed kept the interest rate unchanged as expected, which was in line with market expectations. Gold continued to fluctuate and fall in the short term, and there was no obvious upward momentum for buying. Even if it was a risk aversion, it might be careful of the trend of rising and falling. Since gold was under pressure at 3400, it continued to sell at high prices when it rebounded under pressure at 3400 during the day.The gold 1-hour moving average continued to sell downward dead cross patterns, and the gold buying rebound was weak. It was under pressure at 3400 for many times in the past two days and began to fall. The short-term 3400 line of gold has become a strong resistance. If gold buying cannot break through 3400 strongly, then gold buying will be difficult to improve. It is likely that it will still be the main venue for gold selling. Gold rebounded at 3400 during the day and continued to sell at high prices.
Operation ideas:
Short-term gold 3365-3368 buy, stop loss 3356, target 3390-3440;
Short-term gold 3395-3398 sell, stop loss 3407, target 3370-3350;
Key points:
First support level: 3368, second support level: 3354, third support level: 3333
First resistance level: 3396, second resistance level: 3408, third resistance level: 3420
Data is stable. Will the price go down?Information summary:
The Fed kept the benchmark interest rate unchanged at 4.25%-4.50%, and did not make a rate cut decision for four consecutive meetings, which was in line with market expectations. The Fed said that uncertainty about the outlook has eased, but it is still at a high level. The Fed lowered its GDP forecast for 2025 to 1.4%, while raising its inflation forecast to 3%.
The Fed kept interest rates unchanged, which may suggest that the pace of future rate cuts will slow down.
Market analysis:
From the current 4-hour chart:
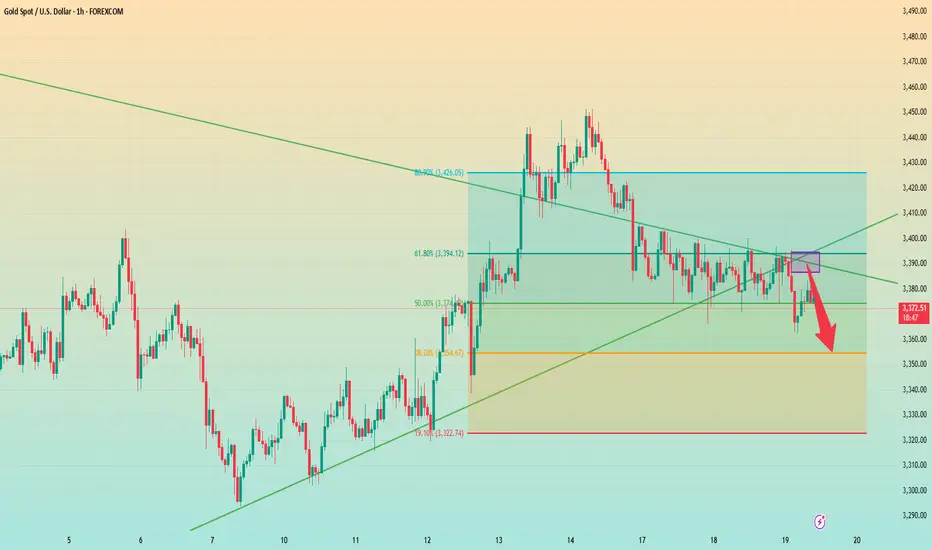
The price has fallen below the key support level of 3380. If it returns to below 3370 again, it is very likely to reach today's low. The low point of the downward trend is at the extreme position of 3350-3330.
From the hourly chart, the downward range has also been broken. The early rebound in the Asian market also failed to stabilize above the support level. Then from the hourly Fibonacci, the 0.382 position below is around 3350.
Therefore, if it goes down, the first target is also around 3350.
Operation strategy:
Short around 3380, stop loss at 3390, profit range 3350-3330.
Thoughts before the Golden Decision
💡Message Strategy
Gold prices continued to fluctuate at high levels this week, lacking a clear direction. The Federal Reserve is about to announce its June interest rate decision. Although the market generally expects that the interest rate will remain unchanged this time, the key focus lies in the update of the dot plot and Powell's wording in the press conference. The market is currently betting that a rate cut cycle may begin in September, mainly based on a series of weak US economic data released recently. US retail sales fell 0.9% month-on-month in May, significantly lower than the market's expectation of -0.7%, while industrial output also unexpectedly shrank by 0.2%, indicating that the US economic momentum has slowed down.
At the same time, the US CPI data in May cooled down across the board, with both the annual rate and the core annual rate lower than expected, which further strengthened the market's expectations for a rate cut in September. Against this background, the US dollar fell from its high on Tuesday, boosting the short-term decline in gold prices.
In terms of geopolitical situation, according to Reuters, the six-day conflict between Israel and Iran showed no signs of cooling down. US President Trump publicly put pressure on Iran and released remarks that he would impose tariffs on the pharmaceutical industry. Coupled with the uncertainty of the trade outlook, the market's risk aversion sentiment has been strengthened, which will help gold maintain a high level.
📊Technical aspects
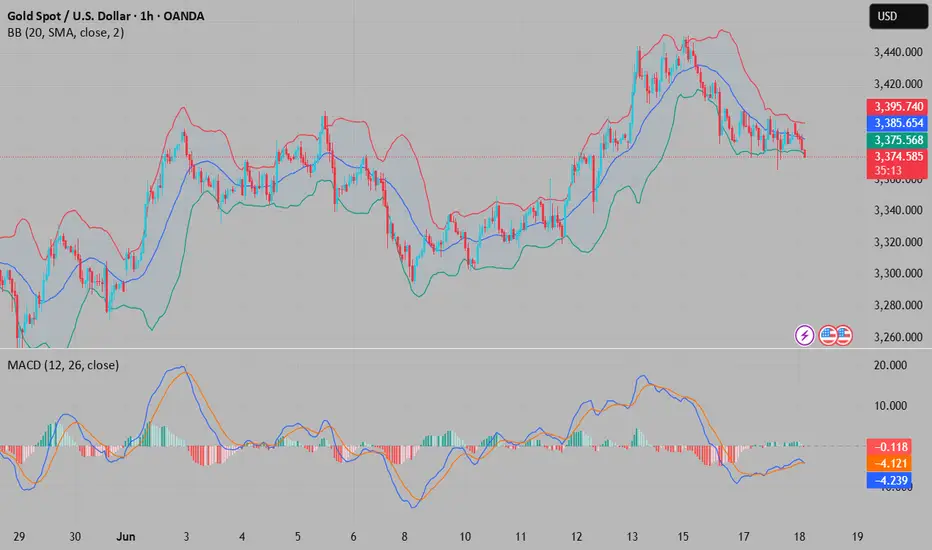
From the daily chart, the gold price has been running between the middle and upper tracks of the Bollinger Bands since late May. The Bollinger Bands have gradually converged, suggesting that volatility has decreased and the market is on the eve of a change.
The current gold price is hovering between the middle track of the Bollinger Bands at $3,322.96 and the upper track at $3,446.14, in a typical oscillating pattern.
In terms of MACD indicators, the current bar chart is close to the zero axis, and the DIFF line and the DEA line are in a state of convergence, and no effective golden cross or dead cross is formed, reflecting that the current situation is a typical consolidation market. RSI remains near 56, indicating that the market is not obviously overbought or oversold, and the short-term momentum is neutral.
Based on the above judgment and analysis, it is believed that gold is currently at a critical node. If it breaks through the 3400-line resistance band and is accompanied by a large volume, it will be expected to challenge the high of $3450. On the contrary, if it falls below the $3360 support, it may trigger a short-term adjustment, with the target pointing to the lower track of the Bollinger band at $3200.
At present, the overall adjustment of gold is supported by the expectation of the Fed's interest rate cut, and the bulls are relatively strong. Long positions are deployed before the decision.
💰 Strategy Package
Long Position:3380-3385,SL:3370
First target: 3400, second target: 3450

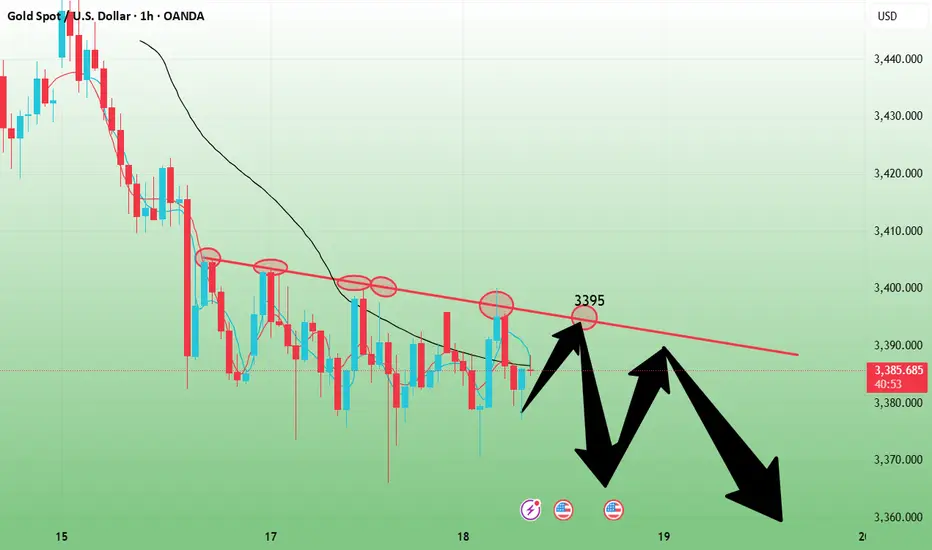
Gold-----sell near 3393, target 3380-3366Gold market analysis:
Yesterday, gold was basically a repeated shock, the K line was repaired at one position, and buying and selling were back and forth around the M side of the suppression platform 3405. Yesterday, our analysis was completely in line with our expectations. Yesterday, we also repeatedly arranged 5 sell orders, arranging 3382 break sell, 3387 sell, 3393 sell, 3382 sell, 3377 sell. Today's idea is to continue selling. The daily line cannot determine the bottom of this wave of decline. There are data in European and American time today. I think we can rely on the 3405 platform to be bearish before the data. If 3405 breaks, we adjust our thinking to be bullish. Otherwise, we can sell repeatedly. Gold is oscillating in the short term. Try not to chase it and wait for it to rebound and suppress the position to sell. In addition, the daily moving average suppression position of the moving average is 3396-3363, which is also the main reason for its repeated game at this position. The weekly buying momentum is not dead yet. Be cautious of its rocket in the second half of the week.
In today's Asian session, we will first focus on the suppression of 3395. The risk of taking more is relatively large. The low point below is not stable. The Asian session fell to 3370 and rebounded quickly. From the perspective of the pattern, 3372-3366 is the support. The suppression position of the 1H hourly moving average is near 3395. Yesterday's US session rebounded at around 3396, and the hourly K suppression position was 3400. All the above are suppressed. In addition, the opening position today is also near 3393.
Pressure 3393, 3400, 3405, support 3382, 3370, and the watershed of strength and weakness in the market is 3382.
Fundamental analysis:
In the previous fundamentals, we have been paying attention to geopolitical factors. The situation in the Middle East has indeed changed the way gold and crude oil are traded. Today we focus on the monetary policy of the Federal Reserve, and there is also a speech by Chairman Powell during the US session.
Operation suggestions:
Gold-----sell near 3393, target 3380-3366
Today, the Federal Reserve is the key to breaking the deadlock!
📌 Core driving events
Yesterday, as the market believed that the possibility of direct U.S. involvement in the conflict had increased, tensions intensified again, and the market was once worried about possible attacks during the Asian session. Although it did not happen in the end, it is said that the next 24 to 48 hours will be a critical period. This wave of tension triggered widespread "risk aversion" operations in the market, but interestingly, gold did not react strongly. The market remained cautious before the Fed's interest rate decision was released, and the slight increase in risk appetite in the stock market also put pressure on gold prices.
📊Comment analysis
At present, the technical side of gold has been showing a bearish trend, but as of now, the market has not fallen below yesterday's closing low of 3364, and the upper side has been under pressure from the resistance of 3405. Long and short positions are wandering in this range, and the breakthrough market will either break through at the end of the day, and the current trend uses sideways trading to exchange time and space, and has not fallen below the support below, so there is a high probability that it will go up.
In the current tense market, it is more necessary to open a position near the high and low points to make a better game. At the same time, from historical experience, the impact of the Middle East geopolitical crisis on gold has three stages and has entered the second stage. The uncertainty of the global economy, the intensification of trade frictions and the rise in inflation expectations may provide structural support for gold. Therefore, if it does not break near 3364 today, it will be bullish first!
💰Strategy Package
Gold: More near 3368-70, defend the 3364 line, and look up to the 3397-3405 line. If it breaks 3405 upward, it will further impact 3422 and even the previous high, but if it breaks below 3364, the long single position will be adjusted out and it will no longer be bullish for the time being!
⭐️ Note: Labaron hopes that traders can properly manage their funds
- Choose the number of lots that matches your funds

The interest rate remains volatile,and the gold operation layout📰 Impact of news:
1. Initial jobless claims data
2. US-Iran conflict continues
3. Pay attention to the Fed's decision
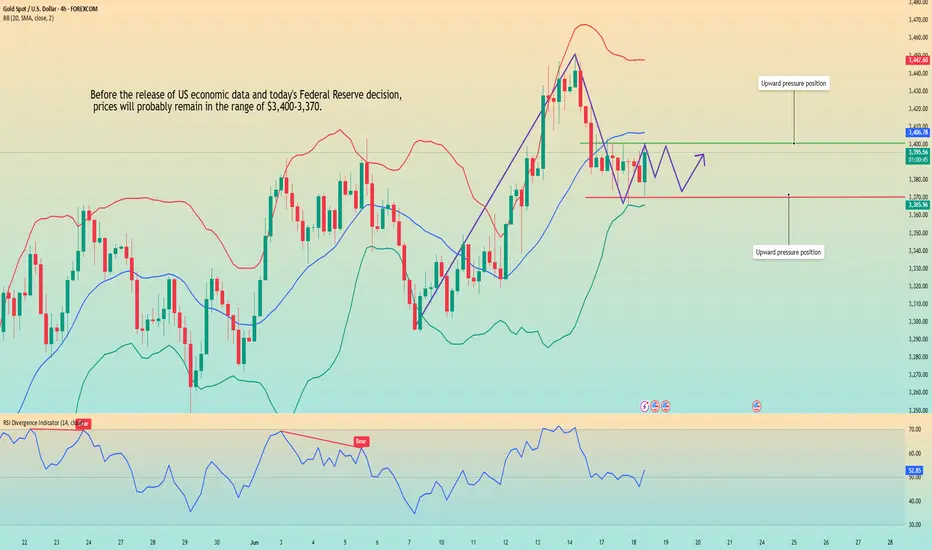
📈 Market analysis:
Gold has been trading sideways recently. It is expected that there will not be much fluctuation before today's Fed interest rate information and Powell's speech. It is expected to continue to fluctuate in the range of 3405-3365. At the same time, the escalation of geopolitical conflicts in the short term is also a point we need to pay attention to.
🏅 Trading strategies:
BUY 3380-3375-3365-3355
TP 3395-3400-3405
SELL 3405-3395
TP 3380-3375-3360
If you agree with this view, or have a better idea, please leave a message in the comment area. I look forward to hearing different voices.
TVC:GOLD FXOPEN:XAUUSD FOREXCOM:XAUUSD FX:XAUUSD OANDA:XAUUSD

Wide range fluctuations continue, the latest layout of gold📰 Impact of news:
1. Initial jobless claims data
2. US-Iran conflict continues
3. Pay attention to the Fed's decision
📈 Market analysis:
At present, the gold price is testing the 3380 line again, and the strong support below is 3365-3355. As long as it does not fall below this key support, the bulls will remain strong. At the same time, the two key points of 3405 and 3420 above are still short-term resistance. Breaking through may directly test 3450. In the short term, gold fluctuates repeatedly at the 3405-3365 level, temporarily maintaining a high-altitude low-multiple cycle. There is also initial jobless claims data released today. At the same time, the geopolitical situation in the short term is severe, so we need to be cautious. In addition, the New York Stock Exchange will be closed tomorrow. The focus this week is mainly on Friday, especially when it is superimposed with the Fed's interest rate decision, we need to be vigilant about the transmission effect of sudden changes in liquidity on the market.
🏅 Trading strategies:
BUY 3380-3365-3355
TP 33395-3400-3405
SELL 3405-3390
TP 3380-3360
If you agree with this view, or have a better idea, please leave a message in the comment area. I look forward to hearing different voices.
OANDA:XAUUSD FX:XAUUSD FOREXCOM:XAUUSD FXOPEN:XAUUSD TVC:GOLD

XAU/USD(20250618) Today's AnalysisMarket news:
World Gold Council: 95% of central banks expect gold reserves to rise in the next 12 months.
Technical analysis:
Today's buying and selling boundaries:
3385
Support and resistance levels:
3422
3408
3400
3371
3362
3349
Trading strategy:
If the price breaks through 3400, consider buying, the first target price is 3408
If the price breaks through 3385, consider selling, the first target price is 3360
Golden investment opportunity emerges!Market news:
In the early Asian session on Wednesday (June 18), spot gold fluctuated in a narrow range and is currently trading around $3,380 per ounce. As the "safe haven king" in the global financial market, international gold has shown resilience in bottoming out and rebounding under the dual drive of recent geopolitical and economic uncertainties. The rise in London gold prices is inseparable from the fueling of tensions in the Middle East. The conflict between Iran and Israel has entered its fifth day, and geopolitical risks continue to heat up, injecting strong momentum into safe-haven assets.Although geopolitical risks have pushed up the safe-haven demand for gold, the strong performance of the US dollar has significantly suppressed gold prices. Against the backdrop of escalating conflicts in the Middle East, the dollar's renewed support and the Federal Reserve's cautious attitude have become important factors limiting the upward trend of international gold prices. Investors need to pay close attention to the Fed's policy guidance, the trend of the US dollar and the latest developments in the Middle East. In addition, the initial value of the annualized total number of US building permits in May and the annualized total number of US new home starts in May will also be released on this trading day, and investors also need to pay attention.
Technical Review:
Gold bottomed out and rebounded, and adjusted widely and fluctuated fiercely. The daily chart closed with a positive cross line, and the RSI indicator's central axis 50 value flattened. The price dropped to the MA10 daily average line of 3366 and rebounded sharply, reaching 3396 in the Asian session. The short-term four-hour chart moving average is glued together, and the RSI indicator's central axis is adjusted. The hourly chart Bollinger Bands are closed, and the moving averages are glued together. Technically, gold maintains a wide range of fluctuations and short-term participation.The intraday trend and the weekly chart's high point gradually move downward, which shows that the control of selling in the market is gradually increasing. Although the gold price failed to continue the buying trend at the beginning of the week, it does not mean that buying is completely dominant, especially before the announcement of the Federal Reserve's interest rate decision on Thursday this week, the market still has strong uncertainty about the future trend!
Today's analysis:
After gold bottomed out, it began to fluctuate again, but the overall trend is still selling. The gold rebound is still under pressure at 3400 and began to fall back. In the short term, gold 3400 is still an important resistance. Gold continues to sell at high prices before it effectively breaks through 3400. Today’s market is once again blocked when it hits a high point. The current intraday high is around 3396. The market has been operating under the pressure of 3400 in the past two days, and there is no sign of the market standing above 3400. Therefore, the 3400 barrier is still an effective pressure point. As long as it does not break through and stabilize at 3400 today, the rebound is an opportunity for us to sell!
Operation ideas:
Short-term gold 3365-3370 buy, stop loss 3356, target 3390-3440;
Short-term gold 3390-3400 sell, stop loss 3408, target 3370-3350;
Key points:
First support level: 3363, second support level: 3346, third support level: 3333
First resistance level: 3400, second resistance level: 3408, third resistance level: 3420
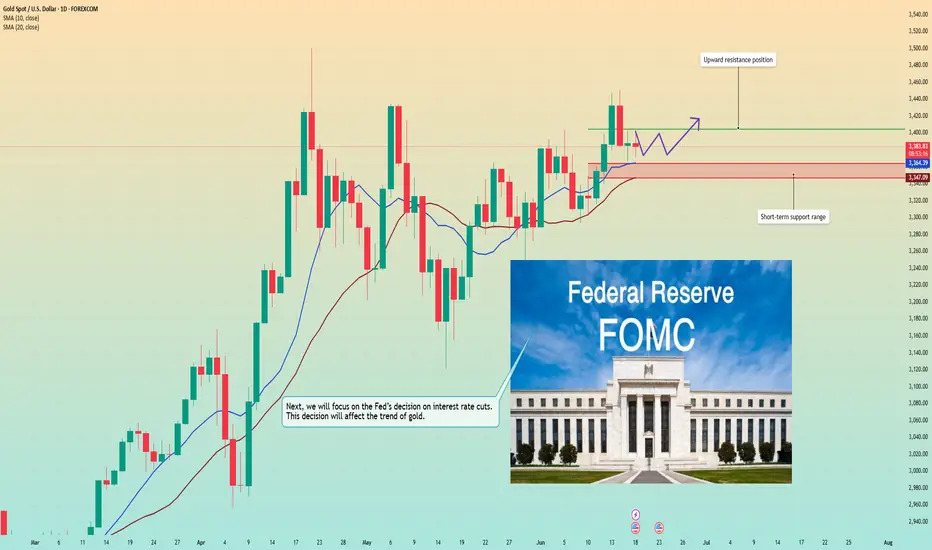
Data is about to be released. Will it affect the trend of gold?Information summary:
The Federal Reserve is about to announce the latest interest rate decision, and the market generally expects it to maintain the policy interest rate range of 4.25%-4.50% unchanged. Trump recently asked the Federal Reserve to cut interest rates by one percentage point immediately. However, the market reacted cautiously to this, believing that a sharp interest rate cut may increase inflation risks, especially in the context of Middle East conflicts pushing up oil prices.
Fed Chairman Powell's statement at the press conference will become the focus of market attention. The market expects the Fed to maintain a "cautious and patient" tone, and the guidance on the interest rate outlook may be vague.
Market analysis:
Technical indicators, from the daily chart, the support level is near the 10-day moving average and the 20-day moving average, and the 3365-3345 range forms an important support. In terms of resistance, yesterday's high near 3405 constitutes a key resistance above. If the price wants to reverse the current weak pattern, it needs to break through this resistance level strongly to open up the upward space.
From the 1-hour chart, the price started to fall after reaching a high point, and maintained stability in the upper and lower ranges; it is now close to the low point in the early trading, and the trend is relatively slow.
In the absence of an upward or downward breakthrough, we still follow the strategy of selling high and buying low.
Short around 3400, stop loss 3410, profit range 3380-3365;
Long around 3365 when the price falls back, stop loss 3355, profit range 3380-3400.
Gold May Dip Slightly Before Rebounding📊 Market Dynamics
• Gold is supported by ongoing Israel–Iran tensions and a weaker USD, despite a slight pullback as some investors take profits.
• Citi has revised its short-term outlook for gold to around $3,300, citing potential for deeper correction in the mid-to-long term if investment demand weakens.
📉 Technical Analysis
• Key Resistance: $3,440 – $3,450 (recent highs)
• $3,420 – minor resistance (psychological mid-level)
• Nearest Support: $3,374 – $3,380 (accumulation zone)
•$3,365 – deeper support, in case $3,374 is breached
• EMA 09: Price remains above both EMA09 and EMA20, signaling that short-term bullish momentum is still intact.
• Candle/Volume/Momentum:
RSI (H1): Currently at 46.8, indicating weakening momentum and potential for further pullback unless a rebound occurs soon. This is a neutral zone – neither overbought nor oversold.
📌 Outlook
With RSI below 50 and buying momentum fading, gold may undergo a mild correction toward the $3,374–3,380 zone before a clearer trend emerges. A break below $3,365 would likely trigger a short-term bearish shift. Conversely, if support holds and RSI climbs above 50, a bullish reversal could follow.
💡 Suggested Scalping Setup
• SELL XAU/USD at: $3,440–3,445
🎯 TP: $3,420
❌ SL: $3,451
• BUY XAU/USD at: $3,374–3,380
🎯 TP: $3,395
❌ SL: $3,365

XAU/USD 18 June 2025 Intraday AnalysisH4 Analysis:
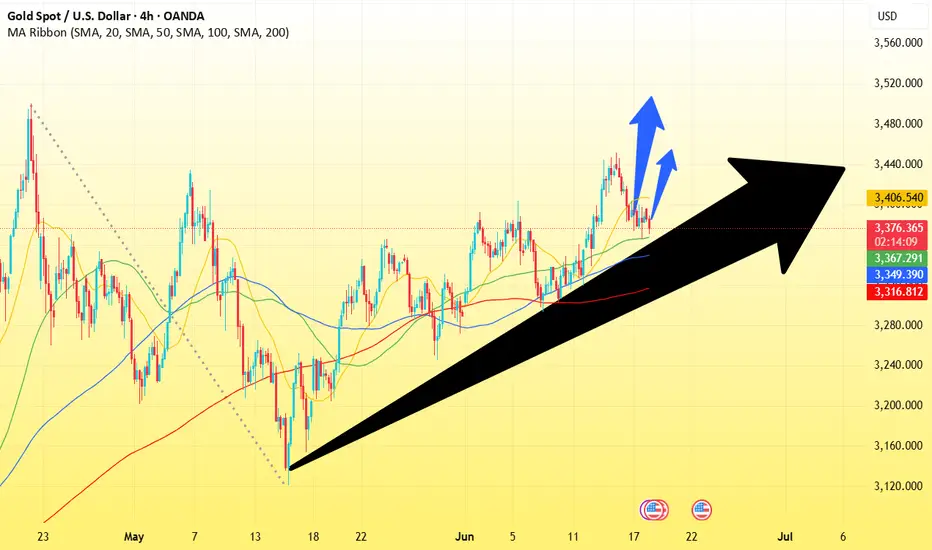
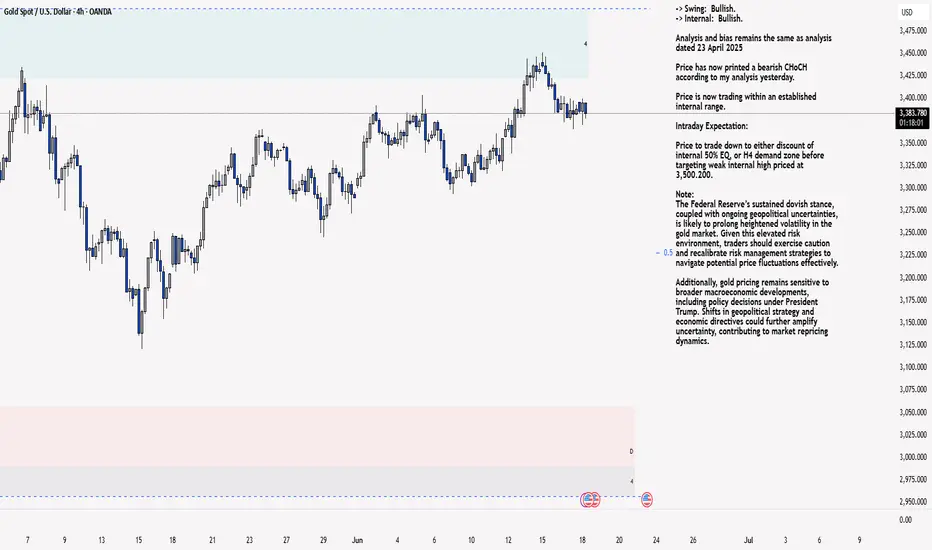
-> Swing: Bullish.
-> Internal: Bullish.
Analysis and bias remains the same as analysis dated 23 April 2025
Price has now printed a bearish CHoCH according to my analysis yesterday.
Price is now trading within an established internal range.
Intraday Expectation:
Price to trade down to either discount of internal 50% EQ, or H4 demand zone before targeting weak internal high priced at 3,500.200.
Note:
The Federal Reserve’s sustained dovish stance, coupled with ongoing geopolitical uncertainties, is likely to prolong heightened volatility in the gold market. Given this elevated risk environment, traders should exercise caution and recalibrate risk management strategies to navigate potential price fluctuations effectively.
Additionally, gold pricing remains sensitive to broader macroeconomic developments, including policy decisions under President Trump. Shifts in geopolitical strategy and economic directives could further amplify uncertainty, contributing to market repricing dynamics.
H4 Chart:
M15 Analysis:
-> Swing: Bullish.
-> Internal: Bullish.
Following previous high, and printing of bearish CHoCH, price has pulled back to an M15 supply zone, where we are currently seeing a reaction. Therefore, I shall now confirm internal high.
Price is now trading within an established internal range.
The remainder of my analysis shall remain the same as analysis dated 13 June 2025, apart from target price.
As per my analysis dated 22 May 2025 whereby I mentioned price can be seen to be reacting at discount of 50% EQ on H4 timeframe, therefore, it is a viable alternative that price could potentially print a bullish iBOS on M15 timeframe despite internal structure being bearish.
Price has printed a bullish iBOS followed by a bearish CHoCH, which indicates, but does not confirm, bearish pullback phase initiation. I will however continue to monitor, with respect to depth of pullback.
Intraday Expectation:
Price to continue bearish, react at either M15 supply zone, or discount of 50% internal EQ before targeting weak internal high priced at 3,451.375.
Note:
Gold remains highly volatile amid the Federal Reserve's continued dovish stance, persistent and escalating geopolitical uncertainties. Traders should implement robust risk management strategies and remain vigilant, as price swings may become more pronounced in this elevated volatility environment.
Additionally, President Trump’s recent tariff announcements are expected to further amplify market turbulence, potentially triggering sharp price fluctuations and whipsaws.
M15 Chart:
Gold is currently range-bound, dancing between a 4H FVG!🚨 GOLD TRADE SETUP INSIGHT 🚨
Gold is currently range-bound, dancing between a 4H Inverse Fair Value Gap (FVG) and a Daily Bullish FVG—two powerful zones that are shaping price action right now. 🟡📈
Recently, price dipped into the lower Daily Bullish FVG, grabbing liquidity from previous lows — classic move. 🧠💧
Right after that, the market gave us a clean Market Structure Shift (MSS) and formed a solid Breaker Block (BPR) 🔥
📍 Price has tapped into this BPR zone, and all signs point toward a potential bullish move from here. Eyes on the prize — the swing highs above look ripe for targeting. 🎯📊
💡 This setup is packed with confluence, but as always...
DYOR – Do Your Own Research.
Don’t trade blindly. Trade smart. ✅

Gold fluctuates under pressure. Can it break out?Information summary:
The conflict between Iran and Israel has entered the fifth day, Tel Aviv air raid alarms are frequent, and the fire of oil tankers in the Strait of Hormuz has exacerbated the panic of energy transportation, and safe-haven buying supports gold prices;
Trump's contradictory statement of "peace talks + toughness" has exacerbated the market's differences on the direction of the conflict, and risk aversion has fluctuated repeatedly.
In the early Asian session, spot gold fluctuated narrowly at $3,375, continuing the stalemate under the geopolitical conflict and the game of the US dollar. As the "king of safe havens", gold has recently bottomed out and rebounded based on the tension in the Middle East, and the current price fluctuates around 3,395.
Market analysis:
The four-hour chart shows that the moving average is sticking to wait for a breakthrough in the direction, and the short-term moving average is sticking to $3,380. The RSI indicator fluctuates around 50, suggesting that a breakthrough will be ushered in after a narrow consolidation; the lower rail support of the rising channel moves up to $3,370, and if it fails, it may test $3,350.
At present, the price is repeatedly testing the resistance position of 3400. If the price stands above this position, it may continue to rise to around 3430. If it breaks the support of 3370 US dollars, it will look to 3360 US dollars.
Operation strategy:
Short near 3400, stop loss 3410, profit range 3370-3365.
If the price falls back to around 3370, you can try to go long, and the profit point is around 3390.
Gold may usher in new opportunities
Key fundamental drivers
- Middle East tensions and nuclear negotiations Despite the ongoing tensions, Iran's signal of restarting nuclear talks has reduced risk aversion, triggering an intraday sell-off in gold, and the market has digested the reduced possibility of escalation of the conflict. The turbulent situation in the Middle East remains a trigger for market volatility, and any downgrade/escalation signals may trigger sharp fluctuations in gold prices.
- Fed policy and rate cut bets The Fed kept interest rates unchanged this week, but Powell's "data-dependent" stance has raised market expectations for a September rate cut to 60%. A dovish meeting statement could push gold prices above $3,400, while a delayed rate cut signal could drag gold prices to $3,350.
Short-term outlook
In the short term, gold prices may fluctuate between $3,350 and $3,450, and a breakthrough depends on:
- Upside catalyst: Escalating tensions in the Middle East + weak retail sales data may push gold prices to $3,450.
- Downside risks: Fed hawkish signals + fading geopolitical risks could push prices to $3,300.
Key event risks
- June 19: Fed policy meeting (expected to be dovish)
- June 21: US CPI data (inflation indicator to measure the timing of rate cuts)
- Middle East situation: progress in nuclear negotiations and conflict dynamics
💰Strategy Package
Set gold price:
🔥Sell gold area: 3390-33396 SL 3400
TP1: 3380 US dollars
TP2: 3375 US dollars
🔥Buy gold area: $3374-$3366 SL $3360
TP1: 3390 US dollars
TP2: 3400 US dollars
Gold is under pressure! What is the key to breaking the deadlock
📌 Core driving events
The conflict between Iran and Israel has entered the fifth day. Air raid alerts in Tel Aviv are frequent. The fire on a cruise ship in the Strait of Hormuz has exacerbated the panic of energy transportation. Safe-haven buying supports gold prices;
Trump's contradictory statement of "peace talks + tough" (may send executives to meet but demand "unconditional surrender") has exacerbated the market's disagreement on the direction of the conflict, and risk aversion has fluctuated repeatedly.
The Federal Reserve will announce its interest rate decision today. The market expects it to remain unchanged at 4.25%-4.50%, but Powell's statement on rate cuts will affect the trend of the US dollar (Trump continues to pressure for a 1 percentage point rate cut).
📊Comment Analysis
1-hour chart: 3396 becomes the intraday strength and weakness watershed
The Asian morning session hit a high of 3396 US dollars and fell back. This point is the previous high pressure point. If the intraday rebound does not break through this position, the bearish thinking will be maintained;
💰Strategy Package
Set gold price:
🔥Sell gold area: 3390-33396 SL 3402
TP1: 3380 US dollars
TP2: 3375 US dollars
🔥Buy gold area: $3374-$3368 SL $3362
TP1: 3390 US dollars
TP2: 3400 US dollars
⭐️ Note: Labaron hopes that traders can properly manage their funds
- Choose the number of lots that matches your funds

Gold-----Sell near 3405, target 3390-3360Gold market analysis:
Yesterday's daily line closed with a big negative line, which was basically a day to kill the buying. Today's idea is to sell in the short term. The daily and weekly trends have not yet turned to selling. Although the daily line closed with a big negative line yesterday, its shape and indicators have not completely turned to selling. There is still motivation to buy in the later stage. In addition, Iran and Israel are still fighting. It is still difficult to see a deep decline in the short term. We estimate that today's Asian session will rebound slightly and then fall. If today's daily line continues to fall again, it may enter a new short-term selling mode. We are just a follower. We follow the short-term. If the short-term trend is bearish, we will rebound and sell. The daily line closes the negative Asian session and waits for the opportunity to sell.
In the Asian session, we pay attention to the suppression of the 3410 position. It is the suppression position of the shape, the suppression position of the 1-hour moving average, the central axis position of yesterday's big drop, and the suppression position of the daily line. If the Asian session stands on 3410, it may bring a new technical rise in buying. After all, the shape of the daily line is still buying. Secondly, if it breaks 3382, it can continue to sell it with a small rebound. 3405 is also a suppression, and it is also considered to sell when it is close.
Pressure 3405 and 3410, support 3282, the strength and weakness dividing line 3400.
Fundamental analysis:
Yesterday, Iran and Israel started bombing each other again, and the situation began to escalate.
Operation suggestion
Gold-----Sell near 3405, target 3390-3360