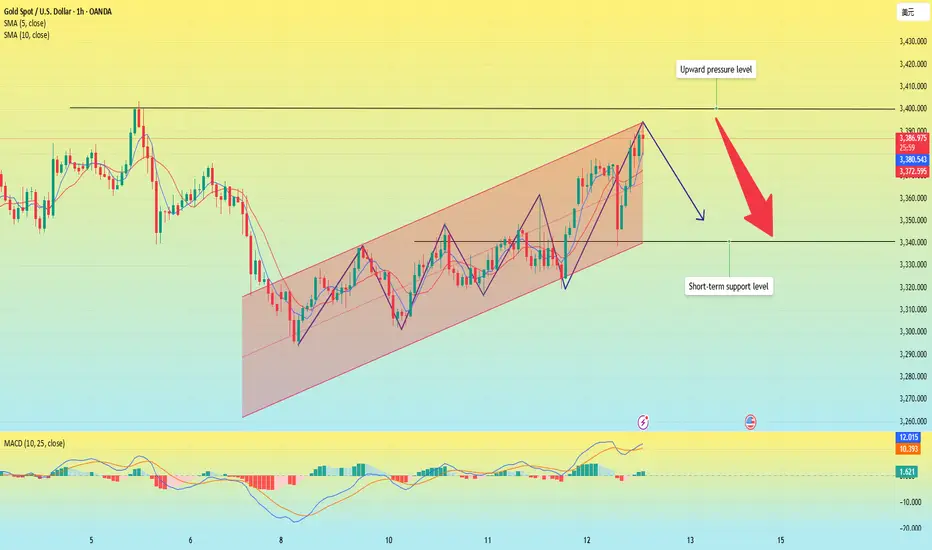
Gold is under pressure!OANDA:XAUUSD
My analysis is very faster working like rocket!
Now the resistance target is 3402
Length: 178
Direction: up
Quality: good
Pattern price: 3365
A potential uptick in the US CPI is not enough to rescue the dollar, with XAUUSD prices poised for a rally towards 3,400 USD.
Note: Today market is volatile for 4 extreme upcoming news, 1 from gbp, 3 from usd, So we will stop here and watching for next perfect buy entry. Thanks all
Goldprice

Israel attacks Iran, gold soars
⭐️Gold information:
Israel attacks Iran's capital Tehran! Gold and crude oil soar rapidly!
The Middle East bully attacks Iran, and the risk aversion sentiment affects the early trading of gold at 3380. 30 US dollars
⭐️Personal comments:
Due to the escalation of geopolitical tensions in the Middle East, market risk sentiment has slightly rebounded, and investors are more inclined to buy traditional safe-haven assets-gold
Moving towards 3480
⭐️Set gold price:
🔥Sell gold area: 3478-3480 SL 3485
TP1: $3462
TP2: $3450
TP3: $3435
🔥Buy gold area: $3375-$3377 SL $3370
TP1: $3389
TP2: $3400
TP3: $3412
Geopolitical tensions, gold prices may reach 3480 points⭐️Personal comments:
Due to the escalation of geopolitical tensions in the Middle East, market risk sentiment has slightly rebounded, and investors are more inclined to buy traditional safe-haven assets-gold
Moving towards 3480
⭐️Set gold price:
🔥Sell gold area: 3478-3480 SL 3485
TP1: $3462
TP2: $3450
TP3: $3435
🔥Buy gold area: $3375-$3377 SL $3370
TP1: $3389
TP2: $3400
TP3: $3412

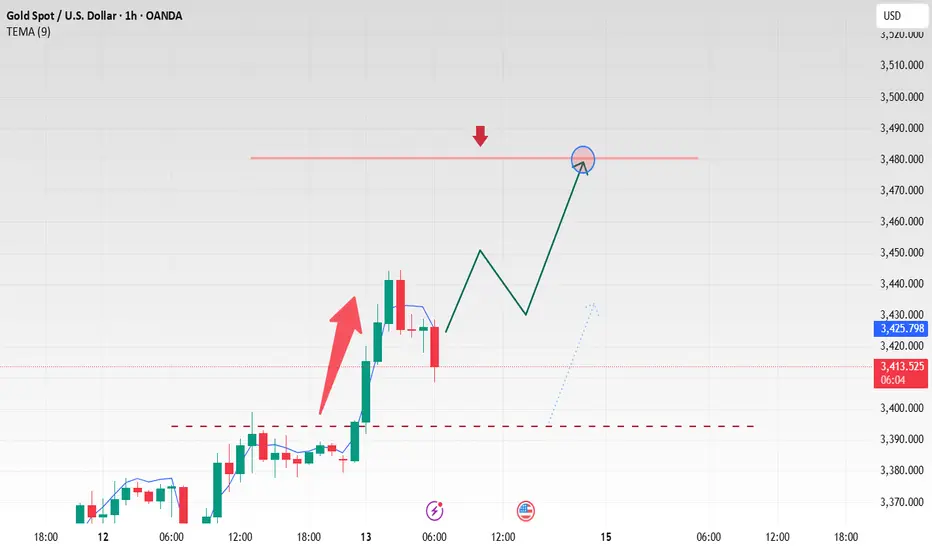
Can Gold Fall from Here? Let’s Watch the $3435 Level Closely!
If today's daily candle closes below the $3435 level, the market could move down further. But if it closes above this level, there's a chance for more upside.
However, keep in mind — most of the upside liquidity has already been taken. Now, there's significant sell-side liquidity resting below.
This makes $3435 a key level to watch. So, keep an eye on where today’s daily candle closes.
Let’s watch the market together and see what it does!
📌 DYOR – This is not financial advice.
Israel attacks Iran, gold price correction can be long gold
📣Gold news
Today, Israel launched an attack on Iran, and the gold price reached a high of $3,433/ounce, the highest level since May 6, and the weekly increase exceeded 3.6%, the highest level since the week of May 19.
Spot gold continued to rise during the US trading session on Thursday, reaching a weekly high of $3,398.55/ounce. However, in the afternoon of the same day, the Chinese Ministry of Commerce stated that China and the United States reached a principled agreement on implementing the consensus of the heads of state call and consolidating the results of the Geneva talks, and made new progress in resolving each other's economic and trade concerns. Affected by the easing of the Sino-US trade situation, the safe-haven demand for gold dropped sharply, and the price fell rapidly by $30 from the high, reaching a low of $3,338/ounce. The market risk appetite has rebounded significantly, and the risk aversion sentiment has cooled significantly. Combined with the fact that the monthly and annual rates of the US CPI released in the evening were both lower than expected, indicating that inflationary pressure has not intensified. After the data was released, the market's expectations for the Fed to cut interest rates by 50 basis points before the end of the year have further increased.
📊Technical analysis:
Technically, the upper track of the daily line is still in a flat state. The current market has reached a high of around 3444. After the rise on Thursday, it is expected that there will be little room above. Since the market is in a volatile rise, it is not suitable to directly chase the rise. The 4-hour Bollinger band continues to diverge upward, and the moving average is arranged in a bullish pattern, indicating that the current market is in a strong position. If it breaks high on Thursday, there will be a chance of rising on Friday. In terms of operation, keep the idea of calling back and going long. If it falls below 3367 again, there will be repeated fluctuations.
Today's operation strategy💰
If the gold price falls back to around 3375, go long. If it is around 3370 and 3365, add more. Stop loss at 3360. Target 3420-3430
Sell short near 3430. Add shorts in batches near 3430 and 3435. Stop loss at 3440. Target 3380-3374
(If you have just entered the market, the gold market is confusing. The operation direction is always reversed. The entry price is not sure. The position is trapped. You can contact Labaron to get the gold price trend analysis And online guidance for unwinding! )
There is no unsuccessful investment, only unsuccessful operation. We have been deeply involved in the industry for more than ten years, with rich practical operation experience and unique trading concepts. We have a global and stable trading system here. We have studied gold, crude oil and other investment fields for many years, with a solid theoretical foundation and practical experience. We are good at combining technical and news operations, focusing on fund management and risk control, and have a stable and decisive operation style. We are recognized by the majority of investment friends for our easy-going and responsible personality and sharp and decisive operations. The analysis article only describes the possible future of the market and expresses opinions. It is not used as a basis for investment decisions. Investment is risky. Trading may not pay attention to reasonable position allocation, fund management and risk control. Do not trade without risk control. Don't let the transaction get out of control.
The situation escalates. Will the price of gold continue to riseEvent summary:
On June 13, Israel launched an air operation codenamed "Lion Rising" against Iran. So far, five rounds of air strikes have been launched.
As the situation in the Middle East escalates, gold has risen again due to risk aversion, directly breaking through 3,400. Gold risk aversion has increased, and there is no sign of easing for the time being, so gold risk aversion continues to rise, and gold prices are expected to continue to rise. Under the blessing of risk aversion, gold bulls have begun to dominate again.
Market analysis:
The 1-hour moving average of gold has formed a golden cross and formed an upward trend. The upward momentum of gold is getting stronger and stronger. In the early Asian session, it once surged above $3,440, only $60 away from the historical high of 3,500. The outbreak of risk aversion is entirely the release of accumulated kinetic energy. Only when it is fully released can the strength of gold bulls weaken. The decline of gold means going long. If the price of gold falls back to the support level near 3,400 during the Asian session, buy on dips.
Focus position:
First support level: 3405, second support level: 3390, third support level: 3380
First resistance level: 3440, second resistance level: 3450, third resistance level: 3470
Operation strategy:
Long strategy: Buy near 3405, stop loss: 3395, profit range: 3430-3450;
Short strategy: Buy near 3455, stop loss: 3465, profit range: 3400-3380;
If you want to trade aggressively, you can buy at the current price and wait for the price to reach a high point near 3350.

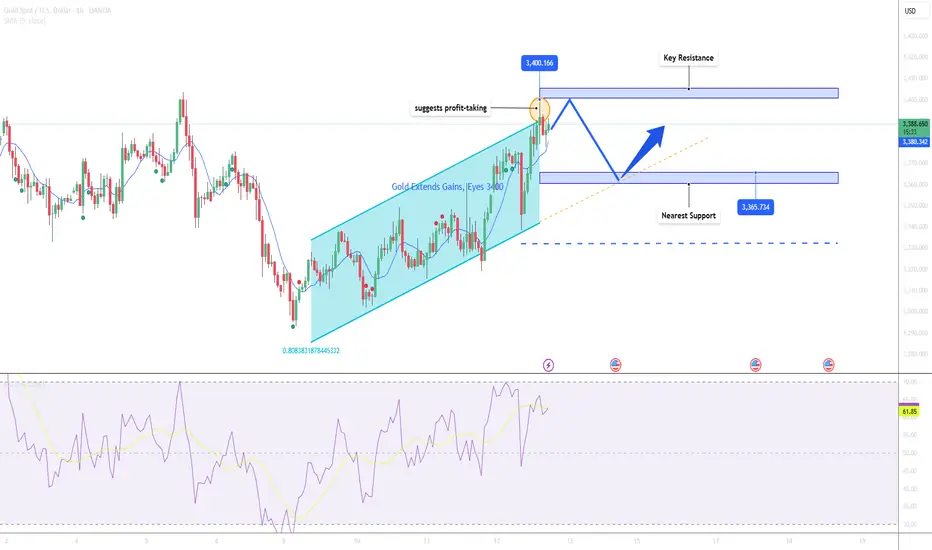
Gold May See Minor Pullback After Testing $3400📊 Market Development:
Gold surged to approach the $3,400 mark after U.S. Unemployment Claims came in higher than expected. The weak labor data increased speculation of an earlier rate cut by the Fed, pressuring the USD and bond yields, which in turn supported gold prices.
📉 Technical Analysis:
• Key Resistance: $3,400
• Nearest Support: $3,365
• EMA: Price remains above EMA 09 → bullish bias intact
• Candle/Volume/Momentum: Long upper wick on H1 suggests profit-taking near $3,400; declining volume may signal weakening momentum.
📌 Outlook:
Gold may experience a short-term pullback if it fails to break above $3,400 and the USD strengthens in the New York session.
💡 Suggested Trade Setup:
🔻 SELL XAU/USD at: $3,395–$3,400
🎯 TP: $3,375
❌ SL: $3,406
🔺 BUY XAU/USD at: $3,365–$3,370
🎯 TP: $3,390
❌ SL: $3,355
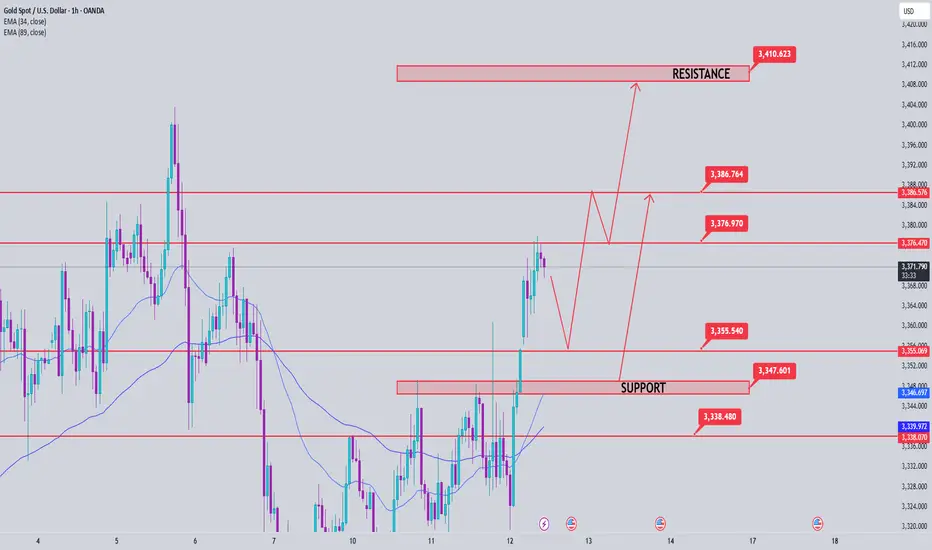
Gold Price Analysis June 12Yesterday's D1 daily frame bounced and closed above 3348. That led to a price gap today.
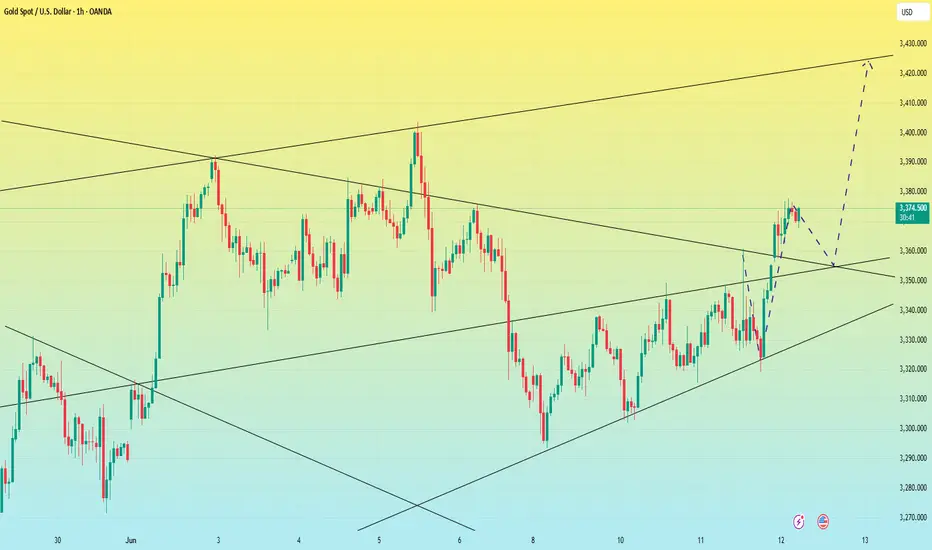
3375 is a resistance zone that is showing price reaction in the Asian session. If it cannot be broken at the end of the session, it is possible to set up a sell at 3355 for BUY strategies in the GAP zone.
Any price decrease today is considered a good opportunity for buying Gold to aim for 3411.
Pay attention to the 3355-3347-3338 zone for BUY signals today. Target is still 3411 but there is still 3386 which may have a reaction.
Gold prices soared again!Market news:
Spot gold continued to be strong in the early Asian session on Friday (June 13), and is currently trading around $3,423 per ounce. London gold prices have risen for three consecutive days, fueled by geopolitical tensions in the Middle East and the Federal Reserve's interest rate cut bets caused by the cooling of US economic data. The global financial market is in a complex environment with multiple factors intertwined, and the attractiveness of international gold as a safe-haven asset has once again become prominent.Tensions in the Middle East have become an important catalyst for the rise in gold prices. The supporting role of geopolitical risks on gold prices cannot be underestimated. Historically, whenever there is a major conflict or escalation of tensions in the Middle East, gold has often become a safe haven for funds. At present, the confrontation between Iran and the United States and the potential conflict risks of regional military bases have provided solid momentum for gold prices to rise.In the short term, gold still has strong upside potential, especially driven by geopolitical risks and expectations of interest rate cuts. However, investors need to be wary of the risk of a correction that may be brought about by inflationary pressures and uncertainty in trade policies. For long-term investors, the value of gold as a safe-haven asset in a diversified investment portfolio cannot be ignored.
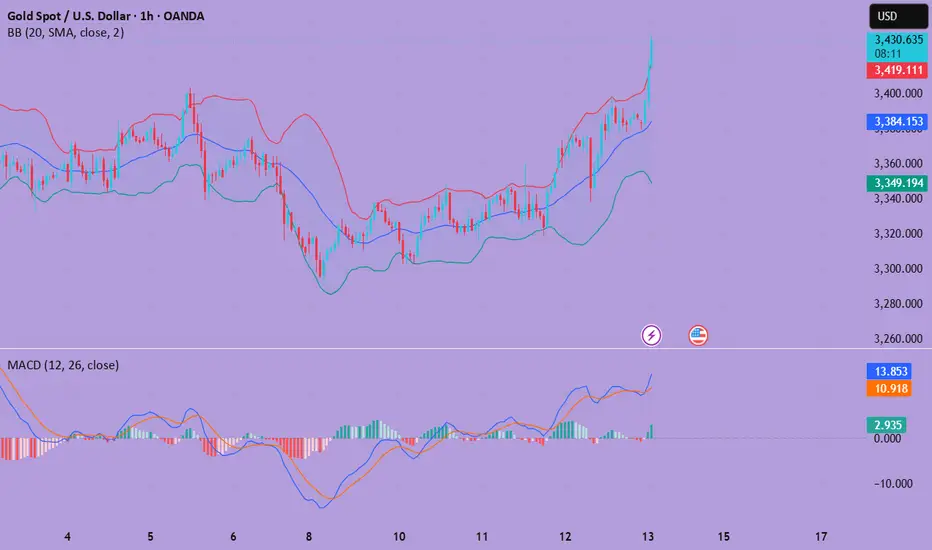
Technical review:
Technically, gold maintains a strong positive structure, and yesterday's sharp rise approached the 3400 mark. The daily chart still remains above the MA10/5-day moving average, and the RSI indicator is at the 50-value axis and turns upward, and the price is in the upper track of the Bollinger band. The short-term four-hour chart moving average system maintains a golden cross opening upward, and the price gradually moves up along the MA10-day moving average, and the price is running in the upper track of the Bollinger band channel. The technical side of gold continues to fluctuate upward, with low-multiple layout as the main idea and high-altitude auxiliary. The current market is strong. If it breaks through the high on Thursday, there will be a second chance of rising on Friday. In terms of operation, keep the idea of buying on pullback. Pay attention to the support near 3407 below in the short term, and pay attention to the resistance near 3438 above. It may fall back after a strong pressure of 3450;
Today's analysis:
The situation in the Middle East has escalated. Gold has risen again due to risk aversion, directly breaking through 3400. The risk aversion sentiment of gold has heated up, and there are signs of easing for the time being. Then the risk aversion sentiment of gold may increase, and gold is expected to continue to rise. Gold bulls have begun to take the lead again under the blessing of risk aversion. At present, gold buying is better, so continue to buy. The 1-hour moving average of gold has formed a golden cross upward buying arrangement. The buying power of gold is getting stronger and stronger, and it is unstoppable. The outbreak of risk aversion is completely an emotional catharsis. Only when the emotions are fully released, the strength of gold bulls will weaken. The decline of gold is buying. The Asian session of gold fell back to the 3400-line barrier to support low-price buying.
Operation ideas:
Buy short-term gold at 3410-3420, stop loss at 3395, target at 3430-3450;
Sell short-term gold at 3447-3450, stop loss at 3458, target at 3400-3380;
Key points:
First support level: 3407, second support level: 3392, third support level: 3378
First resistance level: 3438, second resistance level: 3450, third resistance level: 3473
XAU/USD(20250613) Today's AnalysisMarket news:
The number of initial jobless claims in the United States for the week ending June 7 was 248,000, higher than the expected 240,000, the highest since the week of October 5, 2024. The monthly rate of the core PPI in the United States in May was 0.1%, lower than the expected 0.30%. Traders once again fully priced in the Fed's two interest rate cuts this year.
Technical analysis:
Today's buying and selling boundaries:
3374
Support and resistance levels:
3434
3412
3397
3351
3337
3314
Trading strategy:
If the price breaks through 3397, consider buying in, and the first target price is 3412
If the price breaks through 3374, consider selling in, and the first target price is 3351
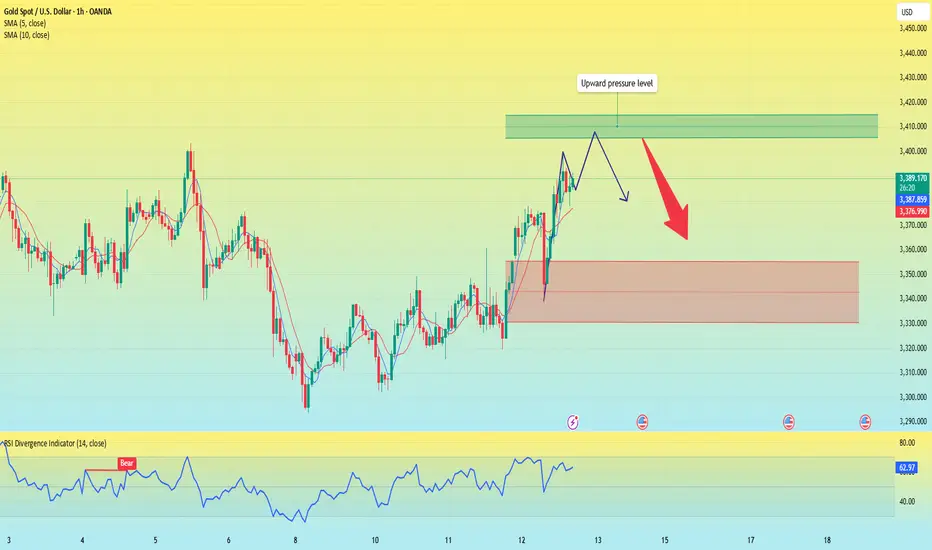
Gold is rising, will there be a new intraday high?Yesterday, gold closed with an engulfing positive line, and the closing line stood above the 5-day and 10-day moving averages.
From the analysis of gold in 1 hour, the current price is still in a fluctuating upward channel. Based on this technical pattern feature, if the subsequent economic data is positive and pushes the gold price to further strengthen, it may form a trading opportunity for shorting at a staged high. Although the gold price showed a rapid upward trend after the data was released, there has been obvious resistance in the historical trading concentration range of 3400-3410. The current bullish momentum has no technical conditions to break through this position, and the technical correction after the price surge is in line with the price behavior logic.
The current price has reached a high of around 3398. After today's rise, there is not much room for upward movement; since the market is rising in a volatile manner this week, it is not suitable to chase the rise directly. Although the 4-hour Bollinger Band opening continues to diverge upward and the moving average is arranged in a bullish pattern, the upward momentum is slightly insufficient and may be under pressure to move downward near 3410. I suggest that all traders short at high levels.
Operation strategy:
Short around 3410, stop loss at 3420, profit range 3360-3355. If it breaks through 3355, it may hit the intraday low below 3340.
Gold rose as expected, how to operate after the bulls hit 3400
📌 Gold News
Spot gold prices rose sharply. Analysts pointed out that the US CPI was lower than expected across the board, which hit the US dollar and US bond yields. In addition, tensions in the Middle East escalated, which triggered safe-haven buying of gold
📊Comment Analysis
Middle East issues, and information about high tariffs on countries without trade agreements. Gold prices have rebounded, but there is no long-term stability.
💰Strategy Package
🔥Sell Gold Zone: 3428-3430 SL 3435
TP1: $3410
TP2: $3395
TP3: $3387
🔥Buy Gold Zone: $3345-$3343 SL $3338
TP1: $3365
TP2: $3377
TP3: $3390
⭐️ Note: Labaron hopes that traders can properly manage their funds
- Choose the number of lots that matches your funds

Gold Trading Strategy June 12Yesterday's D1 daily frame bounced and closed above 3347. That led to a price gap today.
3375 is a resistance zone that is showing a price reaction in the European session. If it cannot be broken by mid-European session, it is possible to set up a sell at 3355. The 3355 zone for BUY strategies is in the price gap created at the beginning of today's trading session.
Any price decrease today is considered a good opportunity for buying Gold to aim for 3432
Pay attention to the 3355-3347-3321 zone for today's BUY signals. Target is still 3432 but you need to pay attention to the 3397 zone where there may be a reaction from the Sellers.
Support: 3355-3347-3321
Resistance: 3397-3432

Gold is rising, beware of a pullback.Since last Friday, the daily line has shown an alternating trend of yin and yang. In the three trading days this week, the lows and highs have been rising continuously, which shows that the short-term trend is strong. Today's intraday trend also illustrates this point. At present, gold has risen directly to the 3388 line, directly refreshing the intraday high again.
From the hourly chart, we must be careful of the possibility of gold diving. From the previous rules, each rise is about 45 US dollars. This time it also started from 3340-3345, and the increase was close to 45 US dollars. Moreover, each time the rise is completed, the dive callback is 35 US dollars. Therefore, once it starts to fall from 3385-3390, it is very likely to reach 3350-3355.
In terms of short-term resistance, pay attention to the 3400 pressure level above; the support level is around 3340. the support level pays attention to the vicinity of 3340.
Operation strategy:
Short at 3385, stop loss at 3395, and profit range is 3360-3350.
Will gold definitely rise if the news is good?
📊Technical aspects
1. The daily line pattern continues to close. The previous three days relied on the lifeline to lift the space. Now the lifeline position is in the 3317 area, which is close to the early morning low point 3319 and becomes the support range
The upper rail resistance position 3405 coincides with the previous high point 3403.5 area
Comprehensive support 3317-3319, resistance 3403-3405
2. The four-hour surge of more than 50 US dollars has pulled the pattern upward, but the European session just fell sharply by 37 US dollars, and the market has been pulled back to the exit again. Pay attention to the lifeline position and the double line superposition at 3335-3330, which also coincides with the lower track of the small channel 3330-3325 area, and together become the nearest support area
The upper track overlaps with the upper track of the small channel 3370 area
Comprehensive support 3320-3330, resistance 3370-3380
Currently, under multiple favorable factors, gold has repeatedly failed to break the previous high (3403).
From the technical pattern, it can be seen that the upper resistance line is still strong. On the contrary, the sharp drop just echoes the weakness of the bulls. Gold is still dominated by shorts.
Finally, let me talk about the current international situation that is favorable to gold. If you simply trade based on news, I don’t think everyone will become a millionaire by reading the news.
💰 Strategy Package
Short Position:3370-3385

Long profit-taking,how to position gold before unemployment data📰 Impact of news:
1. Pay attention to the initial unemployment claims data
📈 Market analysis:
After being pulled down, the gold price quickly rebounded to around 3385, and the RSI showed a V-shaped reversal. It is not recommended to chase the rise at present. In the short term, pay attention to the upper resistance area of 3385-3395. If the gold price effectively breaks through this resistance area, it is expected to touch the 3400-3410 line. On the contrary, it encounters resistance and pressure at the 3385-3395 line, and may retreat to the 3370-3360 line in the short term.
🏅 Trading strategies:
SELL 3385-3395
TP 3370-3360
If you agree with this view, or have a better idea, please leave a message in the comment area. I look forward to hearing different voices.
OANDA:XAUUSD FX:XAUUSD FOREXCOM:XAUUSD FXOPEN:XAUUSD TVC:GOLD

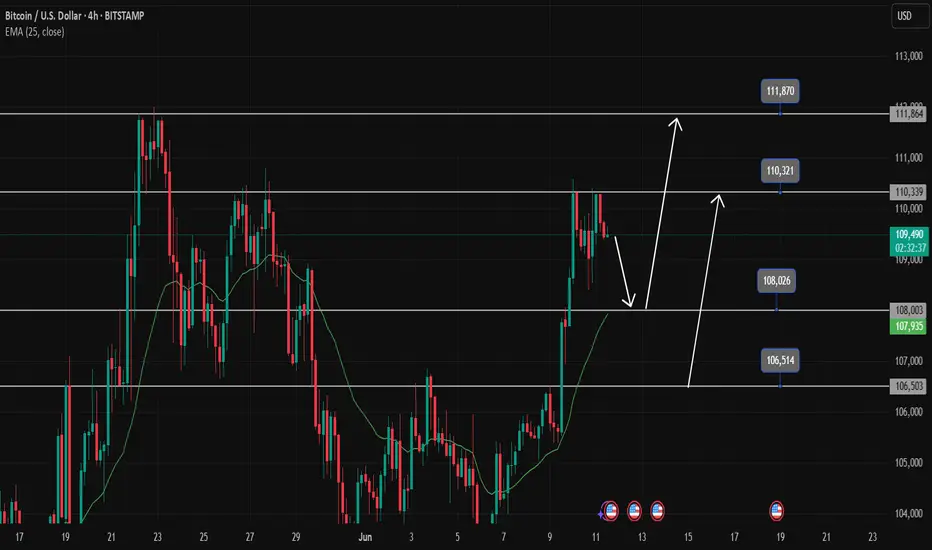
BTC is reviving for a new bull runBTCUSD is correcting to 108000 as it hits the sell zone at 101200. At 108000 it is quite clear to set up BUY signals. Another area to watch for BUY is 106500. BUY SL points are not above 700 price for BTC. Currently the uptrend is still going to continue so any pullback to support is considered a buying opportunity.
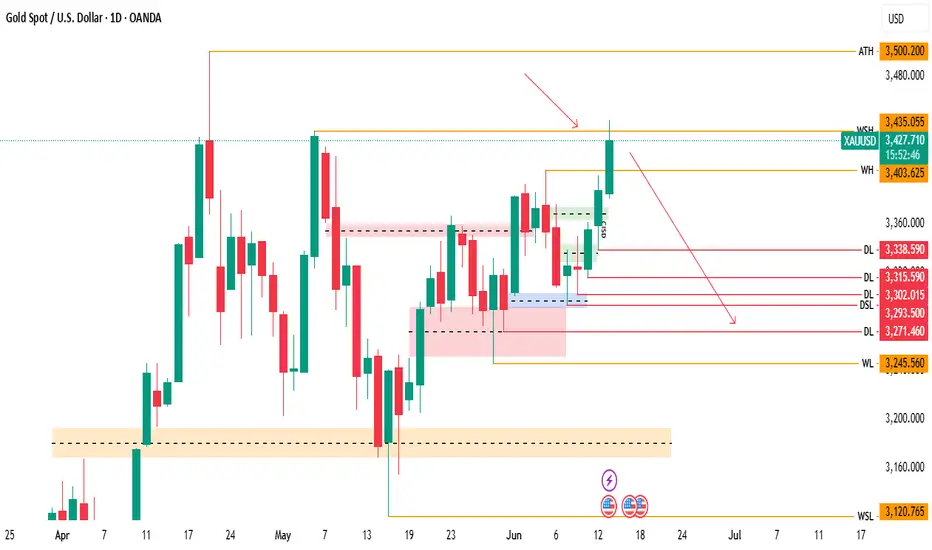
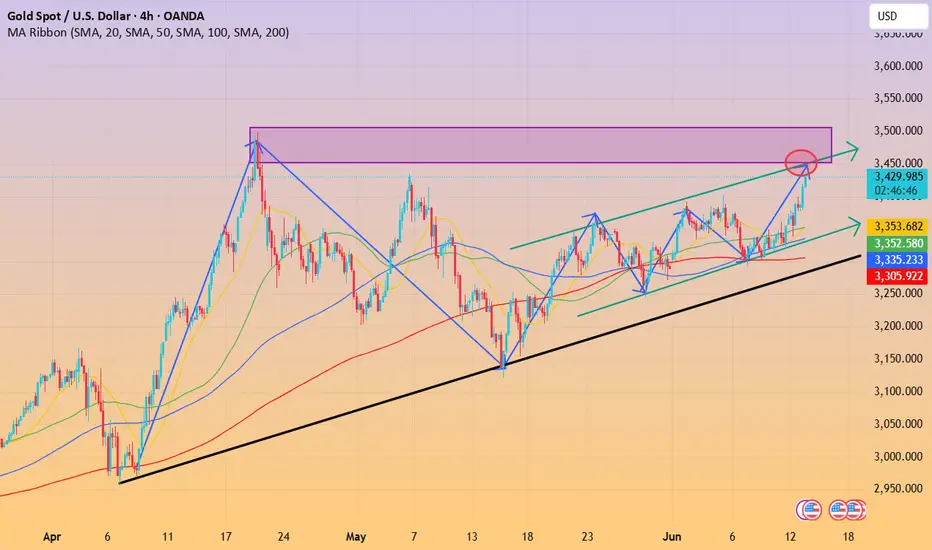
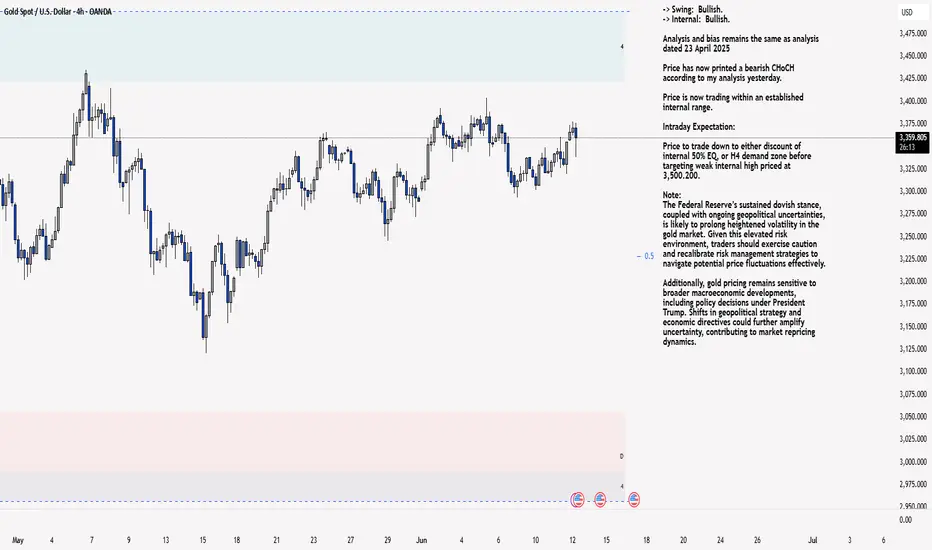
XAU/USD 12 June 2025 Intraday AnalysisH4 Analysis:
-> Swing: Bullish.
-> Internal: Bullish.
Analysis and bias remains the same as analysis dated 23 April 2025
Price has now printed a bearish CHoCH according to my analysis yesterday.
Price is now trading within an established internal range.
Intraday Expectation:
Price to trade down to either discount of internal 50% EQ, or H4 demand zone before targeting weak internal high priced at 3,500.200.
Note:
The Federal Reserve’s sustained dovish stance, coupled with ongoing geopolitical uncertainties, is likely to prolong heightened volatility in the gold market. Given this elevated risk environment, traders should exercise caution and recalibrate risk management strategies to navigate potential price fluctuations effectively.
Additionally, gold pricing remains sensitive to broader macroeconomic developments, including policy decisions under President Trump. Shifts in geopolitical strategy and economic directives could further amplify uncertainty, contributing to market repricing dynamics.
H4 Chart:
M15 Analysis:
-> Swing: Bullish.
-> Internal: Bearish.
Analysis and bias remains the same as analysis dated 22 May 2025.
In my analysis from 12 May 2025, I noted that price had yet to target the weak internal high, including on the H4 timeframe. This aligns with the ongoing corrective bearish pullback across higher timeframes, so a bearish internal Break of Structure (iBOS) was a likely outcome.
As anticipated, price targeted strong internal low, confirming a bearish iBOS.
Price has remained within the internal range for an extended period and has yet to target the weak internal low. A contributing factor could be the bullish nature of the H4 timeframe's internal range, which has reacted from a discounted level at 50% of the internal equilibrium (EQ).
Intraday Expectation:
Technically price to continue bullish, react at either premium of internal 50% EQ or M15 demand zone before targeting weak internal low priced at 3,120.765.
Alternative scenario:
Price can be seen to be reacting at discount of 50% EQ on H4 timeframe, therefore, it is a viable alternative that price could potentially print a bullish iBOS on M15 timeframe.
Note:
Gold remains highly volatile amid the Federal Reserve's continued dovish stance and persistent geopolitical uncertainties. Traders should implement robust risk management strategies and remain vigilant, as price swings may become more pronounced in this elevated volatility environment.
Additionally, President Trump’s recent tariff announcements are expected to further amplify market turbulence, potentially triggering sharp price fluctuations and whipsaws.
M15 Chart:
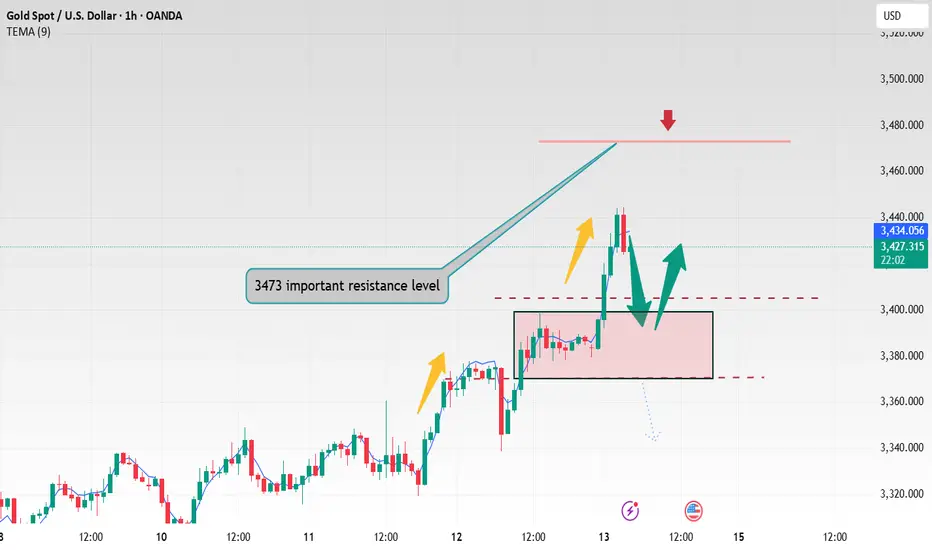
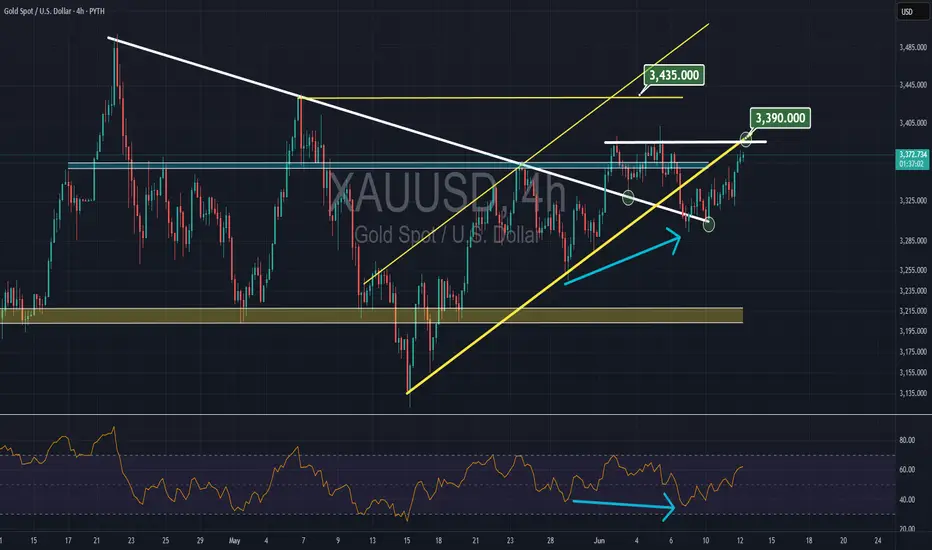
Gold @ CRUCIAL Resistance $3390Gold has a very important resistance at $3390, which is two resistances combined together,
- the previous high
- the former broken support
now its time for gold to show up.
Gold surged, what will be the trend today?Information summary:
On Wednesday, the US dollar index plunged during the session as the CPI data that was lower than expected boosted the market's expectations of interest rate cuts. As of now, the lowest point is near 98.2.
After the release of the CPI data, gold rose in the short term and touched the 3360 US dollar mark, and then quickly gave up the gains and retreated to around 3320. However, it rose again due to the sharp escalation of the situation in the Middle East. As of now, the highest is around 3380.
Market analysis:
From the current 4-hour chart:
Yesterday's 3360 pressure level has been broken, and the Asian market has successfully stood above this position in the early trading. Then the suppression position of 3360 has turned into a support level. Therefore, the position we should pay close attention to next should be 3360-3350. If the price falls back to around 3350, it is possible to enter the market and do more. If the price rises again, it is very likely to break through 3400. Once it breaks through 3400, it will most likely reach around 3420.
Secondly, from the hourly chart, there are some signs of head and shoulders bottom. It would be perfect if it can fall back and then go up again. But gold cannot fall below 3345 again. If it falls below 3345 again, it cannot be long.
Operation strategy:
Go long when the price falls back to around 3350, stop loss at 3340, profit range 3375-3400.
Iran hardens steel, gold rises!
📣Gold news
On Thursday (June 12, 00:00 in the Asian morning, spot gold continued to rise, reaching a high of $3,377 so far, a new high this week. The lower-than-expected US CPI data in May increased the possibility of the Federal Reserve's interest rate cut in September, and the trend of the US dollar and the decline in US bond yields provided a favorable environment for gold prices. At the same time, tensions in the Middle East escalated on Wednesday, and Iran said it would attack US military bases in the Middle East if negotiations broke down. The sharp rise in geopolitical tensions in the Middle East has significantly increased the safe-haven demand for gold. Although the conclusion of the US-China trade agreement has eased some market pressure, the potential impact of tariff policies on inflation still needs to be vigilant. Looking ahead, investors need to pay close attention to Thursday's PPI data and the Fed's policy trends, while keeping an eye on the situation in the Middle East. Driven by risk aversion and expectations of loose monetary policy, the gold market still has room for upside in the short term.
📣Technical side:
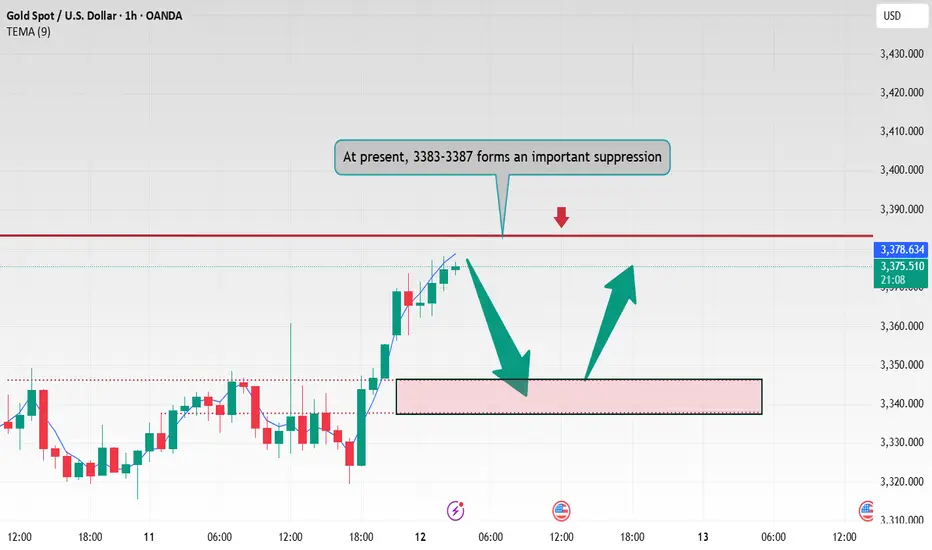
Yesterday's CPI data was bullish. After a brief surge, it fell back to below 3330, and then fluctuated. The rise was not strong. Late at night, Trump again called on the Federal Reserve to cut interest rates by 100 basis points. Confidence in the Iran nuclear negotiations decreased. In the next one to two weeks, he will send a letter to trading partners to set unilateral tariffs. Uncertain risks increased. Gold rose in contact with the CPI data. In the short term, the price broke through the 3348-3353 suppression. Consider going low around this position during the day, looking at the 3383-89 suppression, stop loss 3337, pay attention to risks.
💰Strategy Package
Today's trading strategy: long around 3349. Stop loss 3337, take profit 3383
Short around 3370, stop loss 3374, take profit 3350
Trend value trading is the only way for all investors to make profits. There is no shortcut, and don't be lucky. Any investor needs to go through the process of loss, capital preservation, and profit from the beginning of entering the market. The market is definitely not a long-term paradise for speculators. A successful speculation does not mean that it can be successful from beginning to end. Only stable and continuous profits can make a person successful. There must be rules here. If you don't break the rules, you won't be eliminated.
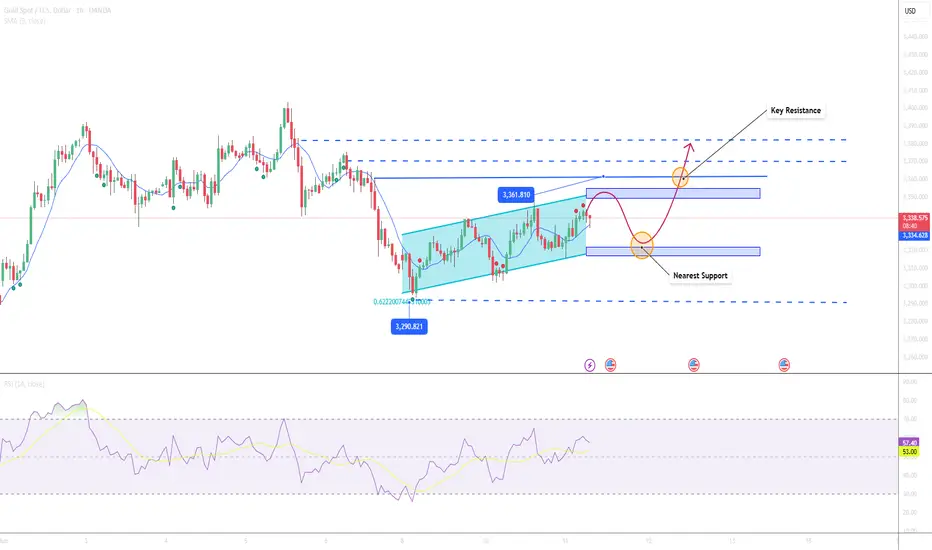
Gold Consolidates Around $3,340–Mild Bullish Bias Ahead CPI Data📊 Market Summary
Gold is consolidating around $3,340/oz, up about 0.5% today, as investors seek safe-haven assets amid ongoing US–China trade tensions. The market is also closely watching the upcoming U.S. CPI data release.
📉 Technical Analysis
Key Resistance:
• $3,350–3,360 – recent swing highs, aligning with the intraday EMA50 and Fibonacci resistance.
• $3,370–3,380 – major monthly high, potential breakout zone.
Nearest Support:
• $3,320–3,330 – EMA20–21 zone, daily support and key pivot level.
• Below $3,320, next support lies near $3,300.
EMA 09:
• Price is trading above EMA9 but still below EMA21–50 → suggests neutral-to-slightly bullish intraday bias.
Candlesticks / Volume / Momentum:
• Small-bodied candles with low volume → signs of sideways movement.
• RSI on H1 ~60, H4 ~55 → modest upward momentum, not yet overbought.
📌 Outlook
Gold is likely to continue consolidating around $3,340, with mild upside potential if the U.S. CPI data comes in hot or trade talks remain inconclusive.
💡 Suggested Trading Strategy
SELL XAU/USD at: $3,350–3,355
🎯 TP: $3,330–3,335
❌ SL: $3,360
BUY XAU/USD at: $3,320–3,330
🎯 TP: $3,340–3,345
❌ SL: $3,310
Beware of the bull trap in gold.
📊Technical aspects
Gold fell to 3330 and then began to rebound. After the release of the US CPI data, gold rose rapidly. This is the time to test human nature and the true understanding of the market.
Is it the bulls coming or the positives being realized and the market continues to fall? Then many people may see the big rise and start chasing the rise, and then the market will once again make a big reversal as if it is a joke.
After the release of the US CPI data, gold continued to short at 3360-65. Gold fell as expected. Gold fell as it went up. This shows that the above section was a market that lured more buyers. The rebound will continue to be mainly short.
Since gold is now tempting to buy, it means that the main trend of gold is still short, so the rebound will continue to be short.
Gold closed with a long upper shadow in 1 hour, so gold is still a strong resistance area above 3350. The upper shadow just happened to surge upward with the help of data, which is the so-called false breakthrough. Gold rebounded to 3350-60 in the US market and continued to be short.
💰 Strategy Package
This is the charm of the market. Some people are always wavering between ups and downs, while others can always grasp the turning points. However, the prerequisite is to be able to see the trend clearly and follow the trend.
Short Position:3365-3370,3370-3380
