Gold is rising. Second starting point?Information summary:
1. The US dollar index has experienced the longest consecutive monthly decline since 2017. The weakening of the US dollar has increased the attractiveness of gold denominated in US dollars to non-US dollar holders, becoming an important support factor for gold prices.
2. Trump's continued pressure on the Federal Reserve to cut interest rates has formed a resonance effect with the weakening of the US dollar, which has jointly pushed up the short-term attractiveness of gold.
Multiple factors are intertwined, and gold has risen slightly again.
Market analysis:
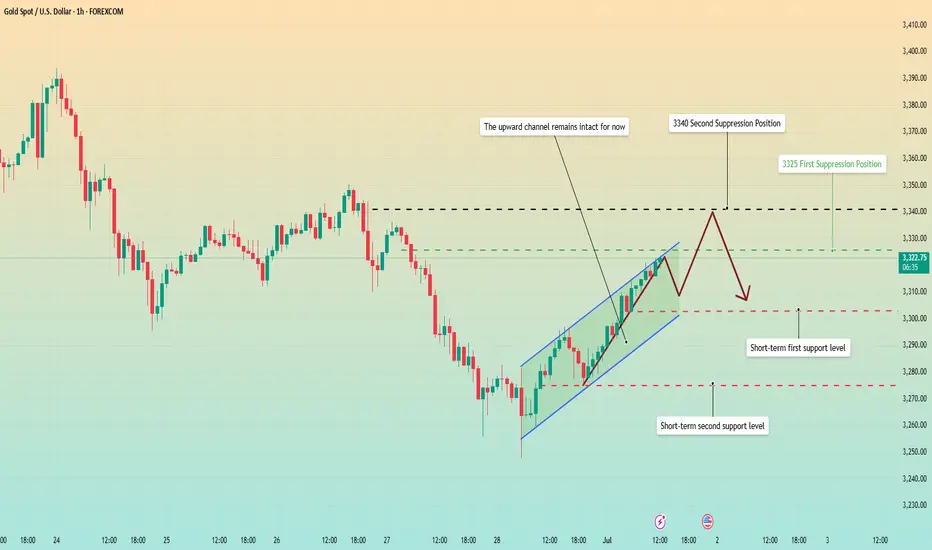
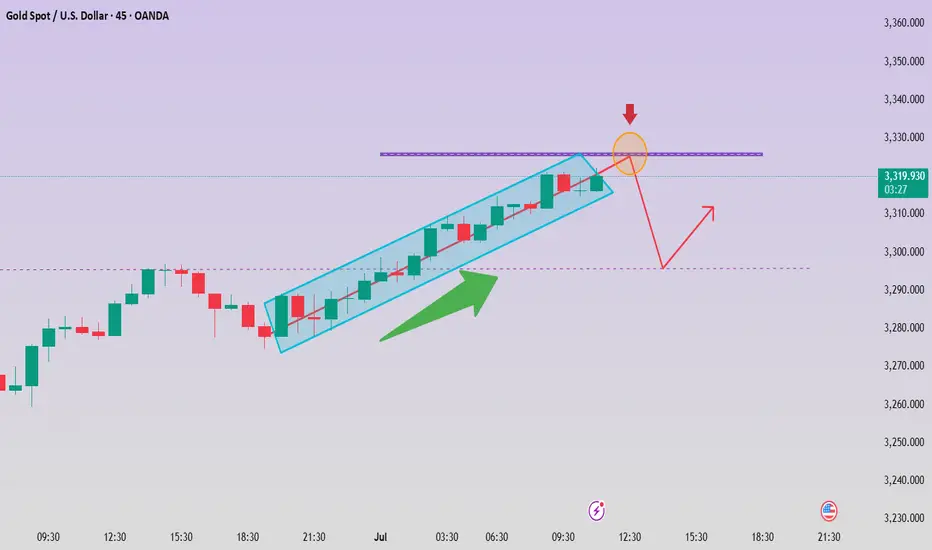
Gold bottomed out and rebounded on Monday, showing a positive closing, and above 3300. After falling sideways for 5 consecutive trading days last week, although it fell for a short time on Monday, it did not continue. In this case, whether a new high can be reached, the watershed is the 3295 line. As long as the European session breaks the high, the long position is near the starting point of 3305 in the early trading session.
At present, the main focus is on the upper resistance around 3325. It opened directly upward on Tuesday, but did not break through too much space, unless it directly broke through 3325-3330; then the next resistance is around 3340. At present, the bulls are still running at a high level. The upward trend line generated after the reversal is more obvious, and the trend line has good effectiveness.
Since the current market is in the first wave of rise, the high point has not been confirmed. Quaid believes that when the high point is clear and the price falls back to the support area, consider entering the market to go long based on the support level. Of course, aggressive trading can choose to buy around 3320 and choose a suitable high point to take profit.
Operation strategy:
Short near the rebound 3340, stop loss 3350, profit range 3310-3300
Long near the fall 3305, stop loss 3290, profit range 3320-3335
Goldprice
Go long on dips and short on rallies📰 News information:
1. Gold market liquidity at the end of the month
2. Impact of geopolitical situation
📈 Technical Analysis:
Last week we predicted that gold would rebound. Today, after gold rebounded as expected, we gave a short trading strategy. Gold fell precisely at the point we gave, 3295, and successfully hit our TP3280-3270. The result confirmed the correctness of our trading strategy. Next, we will focus on the long trading opportunities below 3270-3260.
🎯 Trading Points:
BUY 3270-3260
TP 3290-3300
SELL 3295-3300-3310
TP 3280-3270
In addition to investment, life also includes poetry, distant places, and Allen. Facing the market is actually facing yourself, correcting your shortcomings, confronting your mistakes, and strictly disciplining yourself. I hope my analysis can help you🌐.
TVC:GOLD FXOPEN:XAUUSD PEPPERSTONE:XAUUSD FX:XAUUSD FOREXCOM:XAUUSD OANDA:XAUUSD
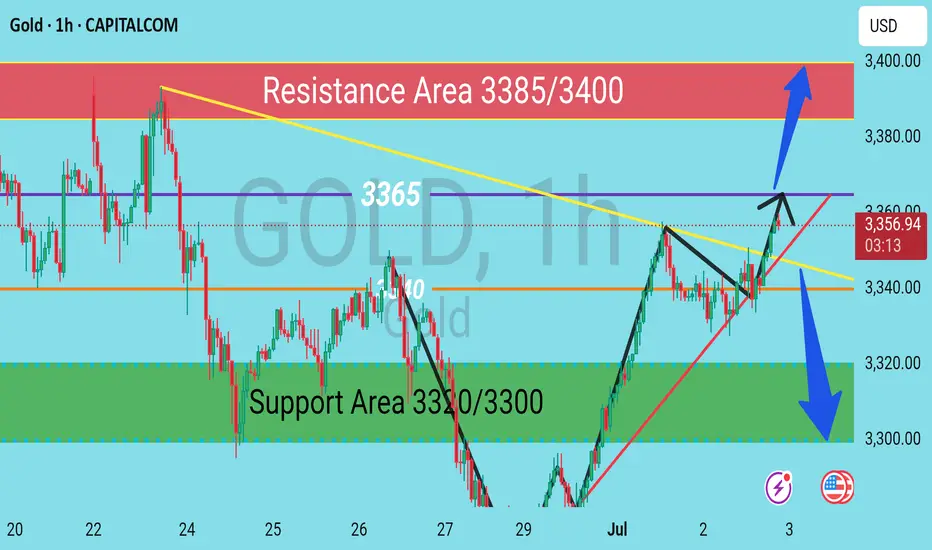
XAU/USD (GOLD) H1 Chart Outlook – Supply & Demand PerspectiveGold is currently consolidating in a tight range near the 3355–3358 zone, showing indecision ahead of a potential breakout. Based on supply and demand dynamics, here’s what to watch:
---
🔼 Bullish Scenario
If the H4 candle closes above 3365, this would confirm a bullish breakout above the immediate supply zone. In that case, expect upside momentum to target key resistance levels:
🎯 3385 – Minor resistance
🎯 3400 – Major resistance and potential reversal zone
A confirmed breakout with strong volume could open room for a short-term bullish rally.
---
🔽 Bearish Scenario
On the flip side, if the H4 candle closes below 3340, it would signal weakness and a possible rejection from the current range. This breakdown could shift the momentum to the downside, targeting the following support levels:
🛑 3320 – Near-term support
🛑 3300 – Critical demand zone
Failure to hold 3300 could indicate further bearish pressure in the coming sessions.
GOLD SHORT TRADE SIGNALGold Sell Now 3338 / 3343
Stoploss : 3347
Target : 3324
Reason Main Resistance Rejection
Bearish Engulfing Conformation To Sell

Gold prices have risen sharply. How should we trade gold?
📣Gold news:
US Senate passes Trump tax reform bill. Trump wins major victory
Trump's signature tax and spending cuts bill passed the Senate on Tuesday. Republican leaders finally convinced dissenting lawmakers after a hard fight, helping Trump win another political victory.
Trump refuses to extend July 9 tariff deadline
US President Trump reiterated on Tuesday that he has no intention of extending the 90-day suspension of reciprocal tariffs on most countries after it expires on July 9.
When asked whether he would extend the suspension of tariffs, Trump replied on Air Force One: "No, I haven't thought about it. I will write to many countries to notify them of the tariff rates they will face."
Gold (XAU/USD) struggled to extend its two-day rally, fluctuating narrowly in the Asian session on Wednesday, just below Tuesday's one-week high. The dollar's slight rebound - from its lowest level since February 2022 - put pressure on gold. Moreover, improving market sentiment continues to weaken demand for safe-haven assets such as gold, further limiting its upside.
⭐️Technical Analysis:
Trend lines are steadily picking up, and continued buying could move towards 3383 based on today's ADP-NF data
💰Set Gold Price:
💰Sell Gold Zone: 3375-3385 SL 3395
TP1: $3370
TP2: $3360
TP3: $3350
💰Buy Gold Zone: $3315-$3310 SL $3305
TP1: $3320
TP2: $3330
TP3: $3340
⭐️Technical Analysis:
Set reasonable buy orders based on technical indicators EMA 34, EMA89 and support resistance areas.
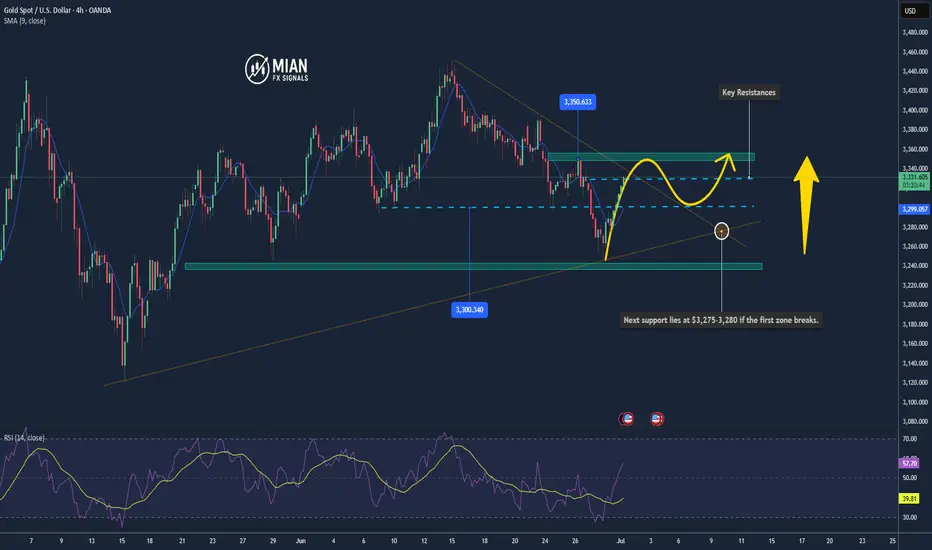
Gold Might Break Higher As It Hits $3,330 Resistance📊 Market Drivers
Gold has just climbed to $3,330/oz, supported by ongoing safe-haven demand and a slightly weaker U.S. dollar ahead of Fed Chair Powell’s speech. Investor expectations of a rate cut in September are keeping bullish momentum alive.
________________________________________
📉 Technical Analysis
• Resistance:
→ $3,330–3,335 (50-day SMA & Fibonacci level)
A breakout above $3,335 could open the door to $3,350+.
• Support:
→ $3,300–3,310 (psychological level & EMA9)
→ Next support lies at $3,275–3,280 if the first zone breaks.
• EMA09:
Price is currently above the 9-EMA, confirming a short-term bullish trend.
• Momentum Indicators:
o MACD is bullish; Stochastics is high — all signaling upside, though a short-term pullback may occur if the resistance holds.
________________________________________
📌 Outlook
Gold is likely to continue climbing in the short term if it breaks above the $3,330–$3,335 resistance zone, fueled by bullish sentiment and dovish Fed expectations.
If it fails to break higher, a minor correction toward $3,300–$3,310 could follow.
________________________________________
💡 Suggested Trade Strategy
BUY XAU/USD : $3,320–3,325
🎯 TP: 40/80/200 pips
❌ SL: $3,310
SELL XAU/USD : $3,340–3,345
🎯 TP: 40/80/200 pips
❌ SL: $3,350
Gold surged and then fell. Has it reached its peak?Information summary:
Today, the United States and Japan negotiated on tariffs. Trump said that the US-Japan deal was unfair and might send a letter to Japan; the US-Japan trade negotiations seemed to be at a standstill. Trump also threatened that he would not extend the expiring tariff period and would send letters to most countries and regions in the next few days.
Secondly, the United States accused the EU of unfair digital legislation and asked the EU to relax its supervision of US technology giants. In addition, Trump accused "Mr. Too Late" Powell and the entire committee on social media that they should be ashamed of not cutting interest rates.
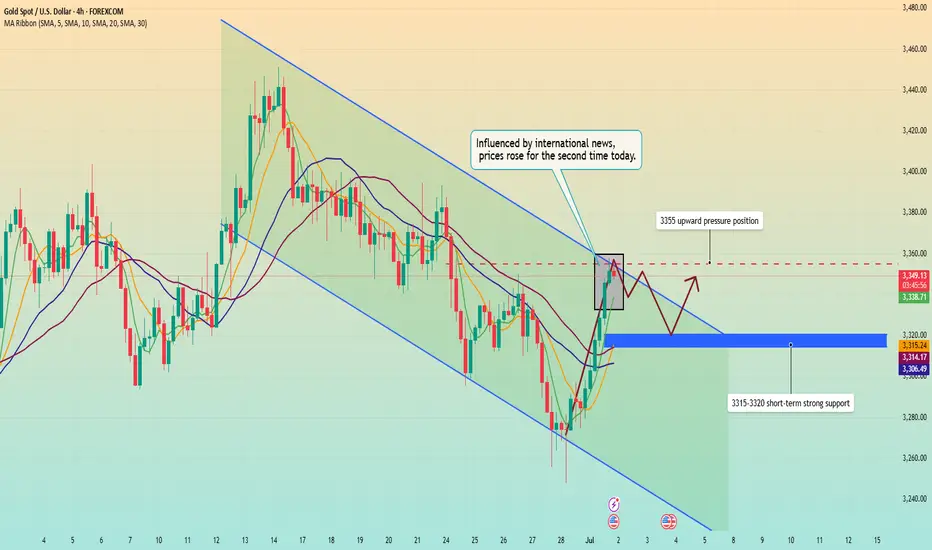
Affected by the above news, gold's risk aversion sentiment heated up and prices started to rise for the second time.
Market analysis:
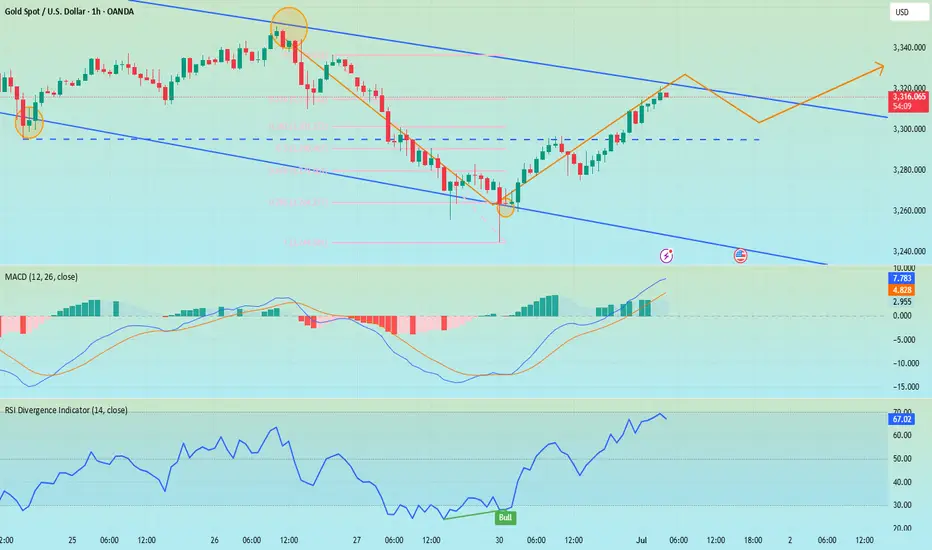
From the 4-hour chart, the market is currently in a slow upward trend in a downward channel, and the price is also repeatedly testing the upward pressure position of 3355. MA5-day and 10-day moving averages turned upward and crossed with the 20-day and 30-day moving averages. At present, the upward momentum is slightly insufficient. In the short term, we should focus on the suppression position of 3355. If we fail to break through this position for a long time, the trend will most likely turn into a downward trend. If no black swan event occurs, today's price will most likely fluctuate around the 3320-3350 range. If there is no black swan event, the price today will most likely fluctuate around the range of 3320-3350.
Operation strategy:
Short near 3355, stop loss 3365, profit range 3340-3330.
Long near 3315 when the price falls back, stop loss 3305, profit range 3340-3345.
Today, we will focus on the resistance around 3350
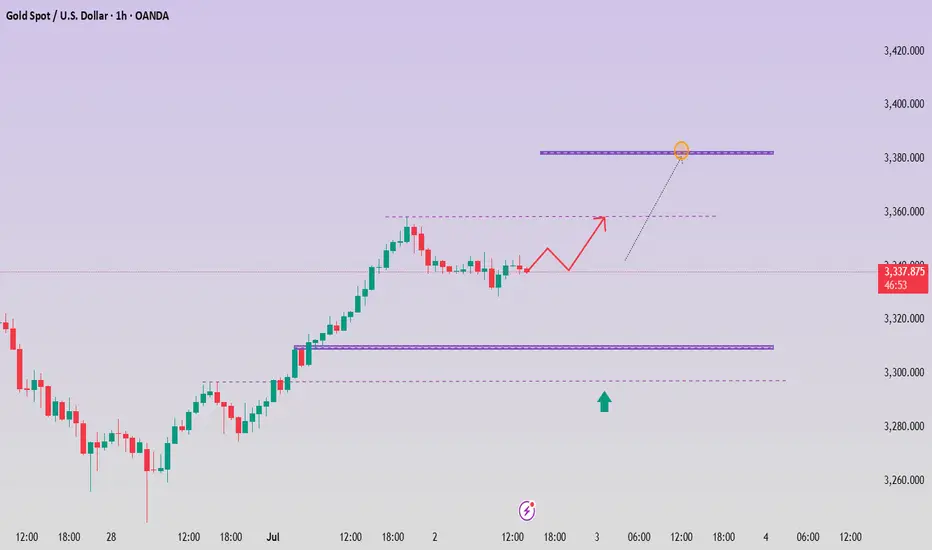
Gold continued to rise without any retracement. At present, the reason for the rise in gold is the market's optimistic expectation that the Federal Reserve will resume interest rate cuts later this year. The US employment report to be released on Thursday may also become a catalyst for the decline in US bond yields, which is usually favorable for gold. Although gold has recently adjusted back, if the US dollar continues to depreciate, gold still has the greatest potential for growth in the short term.
From the trend point of view, gold has risen slowly and continuously, and the new round of resistance needs to be placed around 3350. If this position breaks again, it actually looks at 3400 above, or pierces 3350 but weakens, then it will not fall sharply. At present, this slow rise market has no other good intervention opportunities except for direct long
And the European session will first look at the second highest pressure of 3336. If it breaks easily, there is no need to intervene in the short position. At present, the good intervention opportunity is around 3350, with a small stop loss of 3357, and look at the 3330-25 line.
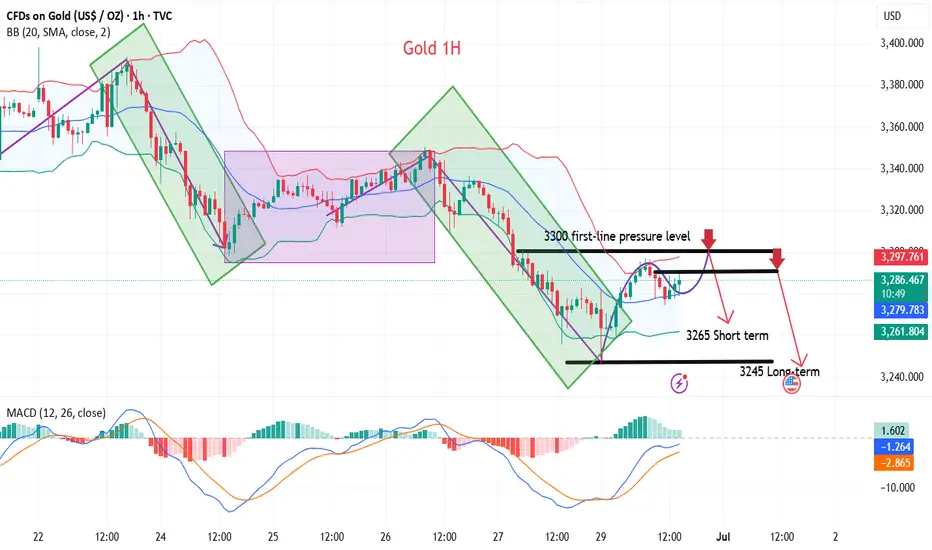
The bull market is too fierce. How to solve the short position?📰 News information:
1. Geopolitical situation
2. PMI data
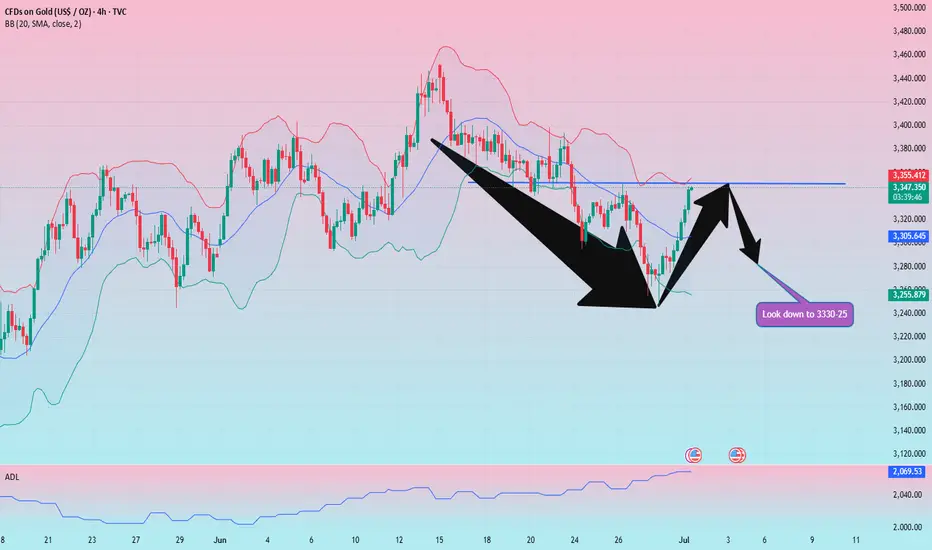
📈 Technical Analysis:
The conflict between Iran and Israel has stopped for a while, but there is a possibility of it breaking out again. There is a possibility of triggering risk aversion in the short term. From a technical perspective, the 4H MACD indicator shows a golden cross, and the moving average and other indicators are also radiating upward, with a strong bullish signal. The 1H chart Bollinger Bands open upward, and the short-term pressure position is at 3340-3345. The short-term data indicators are seriously overbought, and there may be a profit correction in the short term. Therefore, if you want to short in the short term, you can only consider the 3340-3350 range. In the short term, gold will not usher in a large retracement, and the short-term target is only suitable for looking at 3320-3310. As for the long trading point, it is expected to wait for the European and American trading hours.
🎯 Trading Points:
SELL 3340-3350
TP 3320-3310
BUY 3325-3315
TP 3335-3340-3350
In addition to investment, life also includes poetry, distant places, and Allen. Facing the market is actually facing yourself, correcting your shortcomings, confronting your mistakes, and strictly disciplining yourself. I hope my analysis can help you🌐.
TVC:GOLD OANDA:XAUUSD FOREXCOM:XAUUSD PEPPERSTONE:XAUUSD FXOPEN:XAUUSD FX:XAUUSD
This is the reason why gold suddenly "changed its face"!
📣 Gold News
Spot gold closed up $28.59, or 0.87%, at $3,302.71 per ounce on Monday. Gold prices fell to around $3,246 per ounce in early Asian trading, the lowest level since May 29.
At 21:30 Beijing time on Tuesday, Federal Reserve Chairman Powell, European Central Bank President Lagarde, Bank of England Governor Bailey, Bank of Japan Governor Kazuo Ueda, and Bank of Korea Governor Lee Chang-yong will hold a group meeting.
Last Tuesday and Wednesday, Federal Reserve Chairman Powell attended a congressional hearing and said that the Fed needs more time to observe whether tariffs make inflation rise higher before considering cutting interest rates.
Powell said in his congressional testimony that he and most Fed officials expect inflation to start to pick up soon, and the Fed is not in a hurry to cut interest rates before that.
Powell said: "At present, we have good conditions to wait and further understand the possible development path of the economy before considering whether to adjust the policy stance." Yesterday, gold opened at $3381.6 and quickly fell back, reaching a low of $3248.8, then rebounded, rebounded in the early trading and touched $3270 and fell again, gold fell back, reaching a low of $3259.4, then gold did not continue to fall, and rebounded. Gold continued to rebound in the European and American markets, with the highest rebound in the US market reaching $3309.4, and finally closed at $3002.9 in the late trading. The monthly line closed with a long upper shadow line and a shooting star pattern. After such a pattern ended, today's gold rebounded high, and the upper resistance focused on the $3326 line. The rebound relied on the resistance below here to short, and the lower side looked at the $3295 line.
The latest analysis and layout of gold in July made a good start📰 News information:
1. Geopolitical situation
2. PMI data
📈 Technical Analysis:
Yesterday, we gave the idea of looking at the upper resistance of 3310-3320. The 4H pressure is still at 3327. As long as this key resistance level is not effectively broken, gold will fall again. On the contrary, if it stabilizes above 3327, the trend may reverse. In the short term, pay attention to the upper resistance of 3327. If it is not broken, you can short with a light position. If it falls below 3300-3290, consider going long.
🎯 Trading Points:
SELL 3310-3320
TP 3305-3300
BUY 3300-3290
TP 3310-3320-3350
In addition to investment, life also includes poetry, distant places, and Allen. Facing the market is actually facing yourself, correcting your shortcomings, confronting your mistakes, and strictly disciplining yourself. I hope my analysis can help you🌐.
TVC:GOLD FXOPEN:XAUUSD PEPPERSTONE:XAUUSD FOREXCOM:XAUUSD OANDA:XAUUSD TVC:GOLD
XAUUSD/GOLD Geopolitical conflicts have escalated again. Next week is a week of heavy news. How will the gold price focus next week? How to trade? Look at the news preview first.
1. Geopolitics, Russia-Ukraine conflict, Palestine-Israel conflict, Iran-Israel conflict.
2. ADP data, NFP data.
3. Tariff deadline.
The above three news are enough to cause drastic fluctuations in the gold price.
On Friday, the New York market followed my expectations. After rebounding around 3282, it fell back. Finally closed around 3274.
The impact of the weekend news is huge. From the news perspective, the opening price of next Monday will be higher than the closing price on Friday. In terms of operation, you can pay attention to buying at a low price after the market opens.
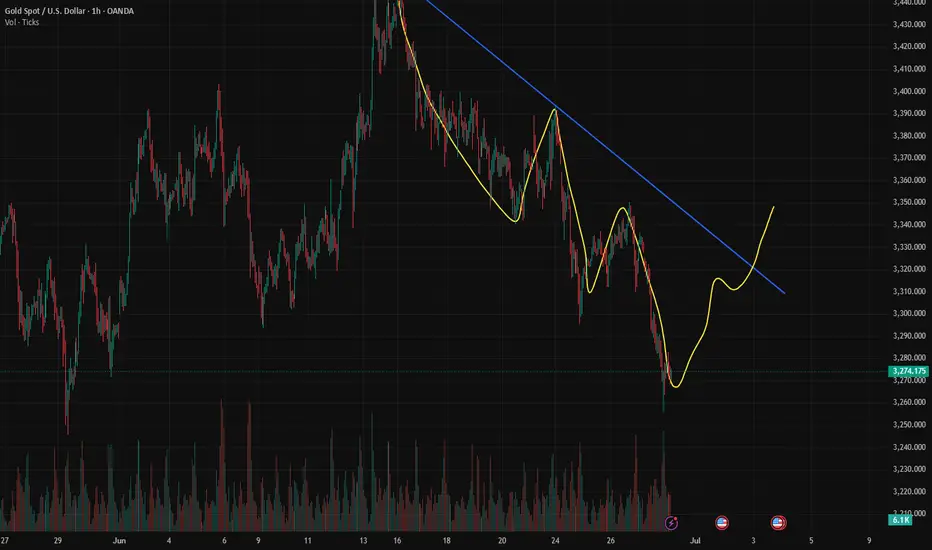
Gold fluctuates upward. Is the decline over?On Monday, gold opened at around 3282, and then fell back quickly to around 3247 under pressure; the downward low was blocked, and then rebounded strongly to around 3297; the market currently maintains a small upward trend.
At present, we need to focus on the resistance range of the upward trend.
From the 4-hour chart, the upper short-term resistance is around 3295-3300, followed by the suppression range of 3310-3315. The main direction of short-term operations maintains the rebound short-selling strategy. The support below is around 3255; the overall short-term operation relies on 3260-3300 to maintain the main tone of high-altitude participation unchanged.
Operation strategy:
Short near 3305, stop loss 3320, profit range 3270-3260.
A new week has just begun. I wish you all gain something from the market fluctuations.
Gold long-short strategy US trading range operation
Gold prices (XAU/USD) recovered some of their losses during Monday's Asian trading session, driven by expectations that the Federal Reserve may cut interest rates further this year (and perhaps earlier than previously expected). This prospect weighed on the dollar, making dollar-denominated gold more attractive to overseas buyers.
However, the recent improvement in global risk sentiment (driven by the US-China trade agreement and the Israeli-Iranian ceasefire agreement) may reduce the safe-haven demand for gold. Investors will now turn their attention to upcoming comments from Federal Reserve officials, with Atlanta Fed President Rafael Bostic and Chicago Fed President Austan Goolsbee expected to speak later in the day.
Gold prices recovered, accumulating around the 3,300 price range at the beginning of the new week. Still in a major downtrend.
⭐️Set Gold Price:
🔥Sell Gold Area: 3316-3318 SL 3323
TP1: $3305
TP2: $3290
TP3: $3277
🔥Buy Gold Area: $3248-$3246 SL $3241
TP1: $3258
TP2: $3270
TP3: $3286
⭐️Technical Analysis:
Set reasonable buy orders based on technical indicators EMA 34, EMA89 and support and resistance areas.
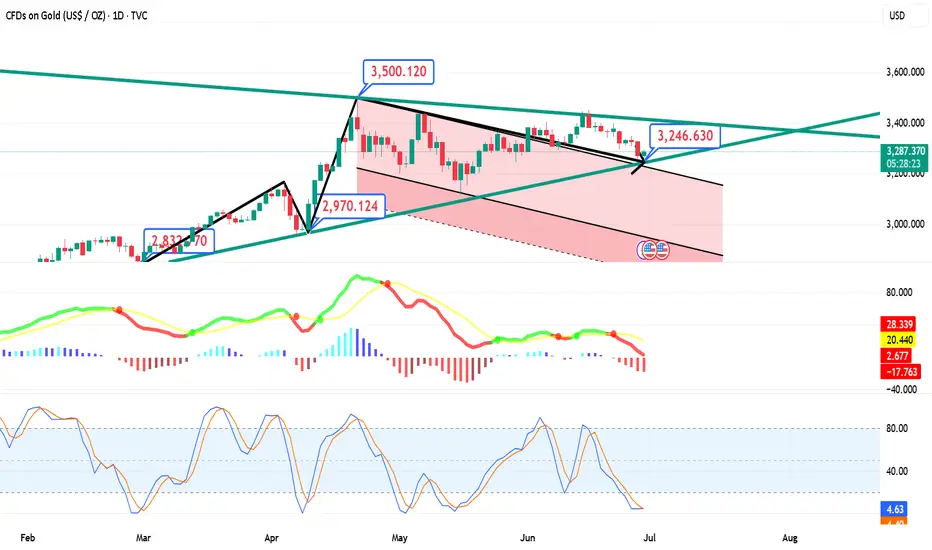
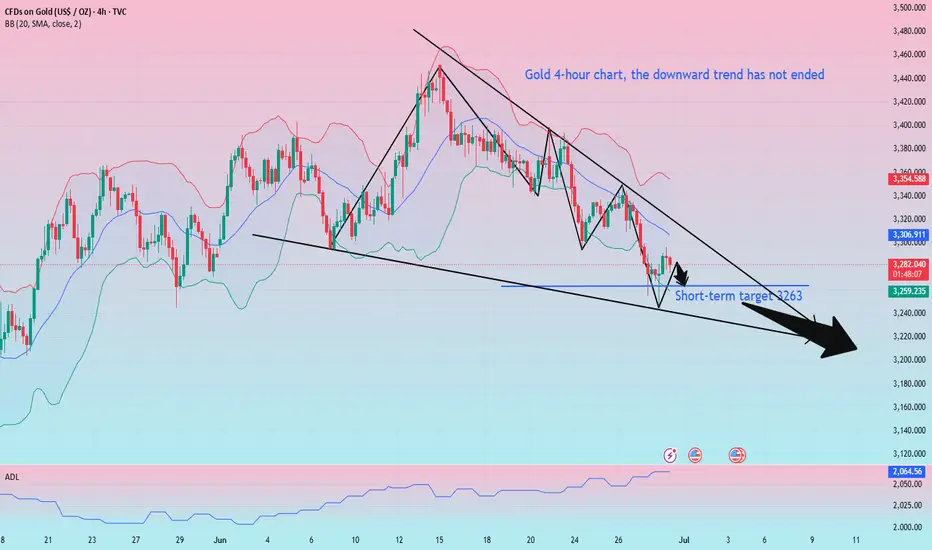
Gold's rally has not reversed yet? The consolidation pattern hasTechnicals:
Short-term risks remain skewed to the downside as the momentum of the relative strength index (RSI) and the moving average convergence divergence indicator (MACD) weakens. The RSI hit a new low below the neutral 50 mark. If short pressure intensifies in the next few trading days, gold prices may retest the upper track of the previous falling channel at 3215, followed by the rising support line from October 2024 at 3150. If it falls below this level, the decline may accelerate towards the psychological level of 3000, or even lower to 2970.
On the upside, if a strong catalyst pushes gold to rebound above the 20-day and 50-day moving averages (currently 3320-3350), the next resistance level may appear in the 3400-3435 range. A decisive close above this boundary may pave the way for gold prices to move towards 3500, or test resistance near 3530, and then may target the 3600 level.
Overall, despite the weakening technical indicators, gold has not completely lost its bullish reversal potential. As long as the price remains within the sideways structure above 3150, the downward pressure may still give rise to a "buy on dips" strategy.
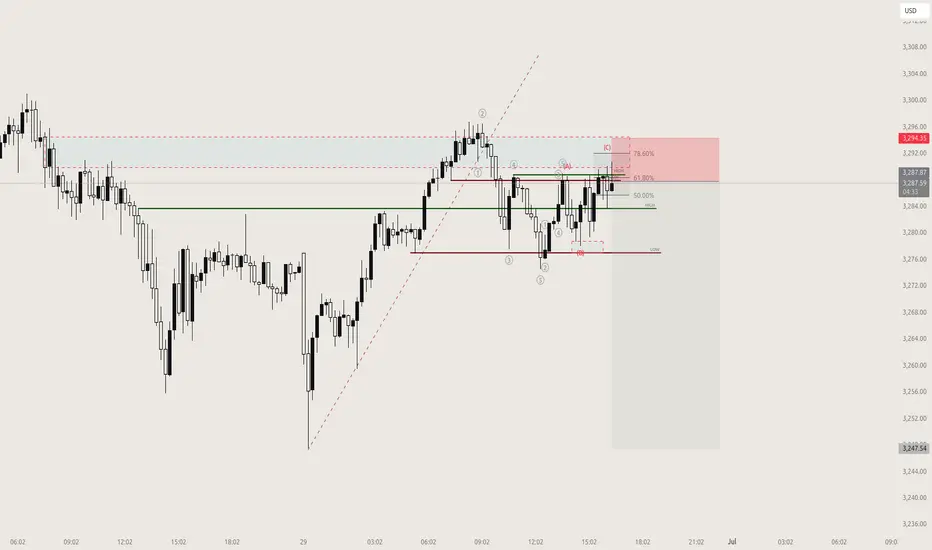
GOLD XAUUSD potential 1-2 setup to downsideLooking at an potential 1-2 setup to the downside wave 3 of 5. adding to my previous gameplay
Gold bulls are suppressed, rebound short-selling range grasp
💡Message Strategy
The cooling of geopolitical tensions and the easing of Sino-US trade tensions have boosted market risk appetite, and rising stock markets have weakened the attractiveness of holding gold, suppressing gold prices.
However, geopolitical tensions have not completely calmed down, and expectations of a September rate cut by the Federal Reserve have increased, limiting the decline in gold and providing support. In terms of operations, it is recommended to treat it with a volatile mindset.
📊Technical aspects
On the daily chart, after gold hit a two-month high in mid-June, it encountered resistance and fell back, hitting a new low in nearly a month, and the short-term trend is biased downward.
For gold's upper pressure, pay attention to the intraday high of $3,300. The gold price bottomed out and rebounded during the day. For gold's lower support, pay attention to the intraday gold price rebounding above the rising position of $3,270, followed by the intraday low of $3,247, which is also near the low point of the gold price after the rise in May. The 5-day moving average and the MACD indicator cross downward, showing that the short-term technical side is dominant.
From the 1-hour analysis, the upper short-term resistance is around 3277-3281, the 3295-3301 line is suppressed, and the 3316 line is suppressed.
In terms of operation, the main short-term support is around 3250-3255. The overall main tone of high-altitude participation remains unchanged in this range, so pay attention in time.
💰Strategy Package
Short Position:3290-3300,SL:3316,Target: 3240-3250
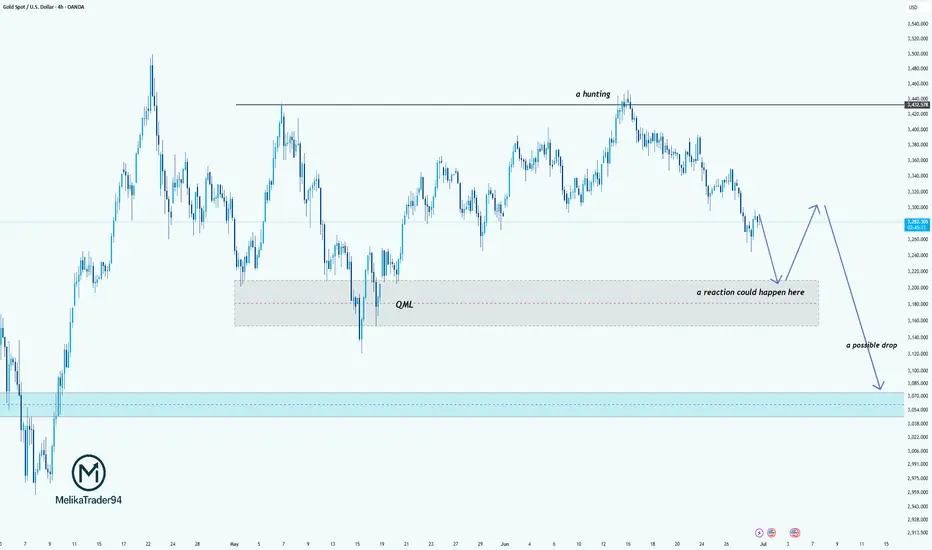
Gold: Eyes on QML Zone for Potential Reaction Before Deeper DropHello guys!
Let's go deep into the GOLD chart!
Price has completed a liquidity grab near 3440 (marked as "a hunting") and is now heading downward toward a key QML zone.
First, a reaction is expected around the QML area (3180–3220), where previous structural interest and demand may cause a temporary bounce.
After this reaction, the price is likely to retest higher, potentially forming a lower high.
Then, the dominant bearish structure is expected to continue, with a possible sharp drop toward the final demand zone around 3050–3080.
This movement represents a classic manipulation.
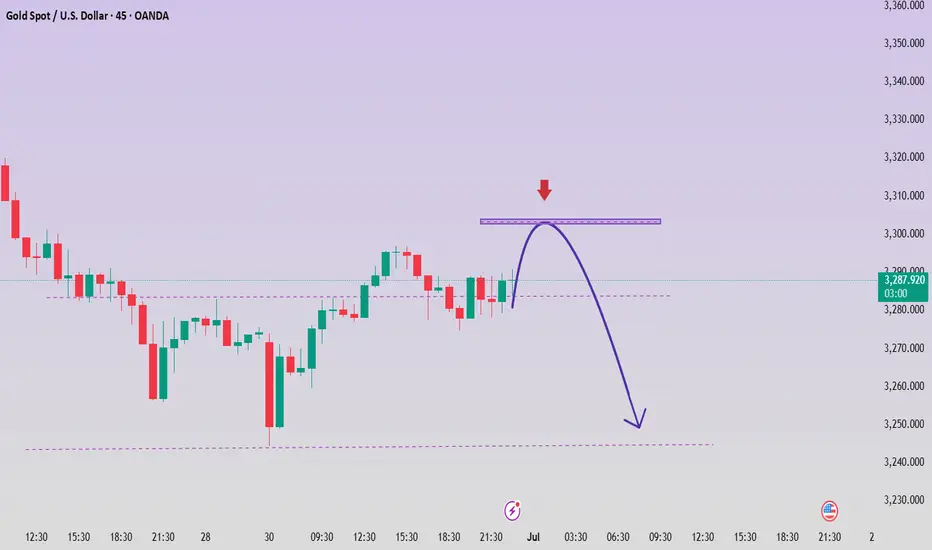
Gold is under pressure at 3296 and may weaken and fall today
I am analyst Yulia, and I always believe that profit is the only criterion for measuring strength. My analysis is never perfunctory, and my trading style is unique. Follow my rhythm, and you will never fail in the annual cycle. Others have already rushed on the road to wealth, but you are still hesitating whether to cross the traffic light at the intersection? Remember, hesitation will lead to failure! Follow my pace, and wealth will be very close to you.
Gold rebounded as I expected during the weekend, but the rebound to 3296 was under pressure. The short-term 60-day moving average and the suppression near the five-day moving average failed to break, so the rebound within the day was limited. It may weaken and fall today, but it belongs to a shock and bearish trend, so consider shorting near 3282-85, stop loss 3291, pay attention to risks.
June 30 gold short-term trading: short near 3283, stop loss 3291, take profit 3263
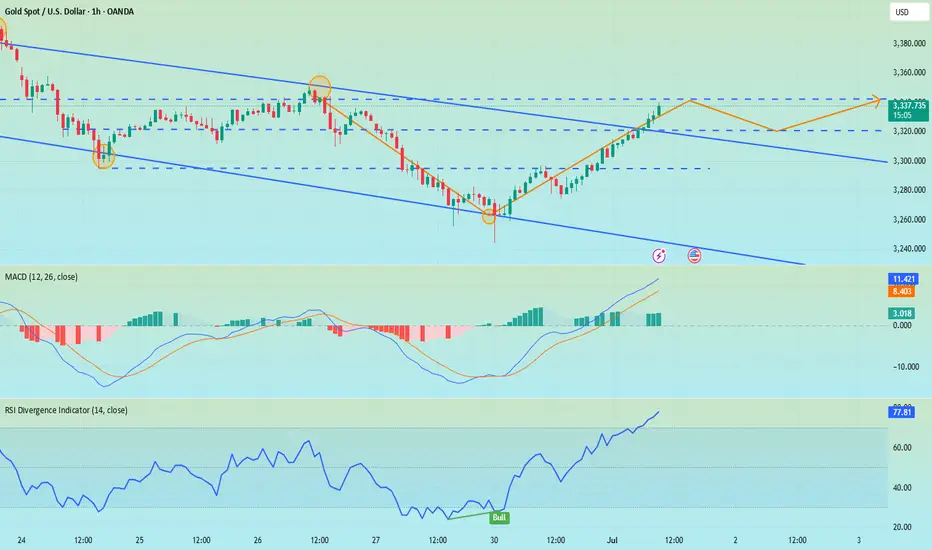
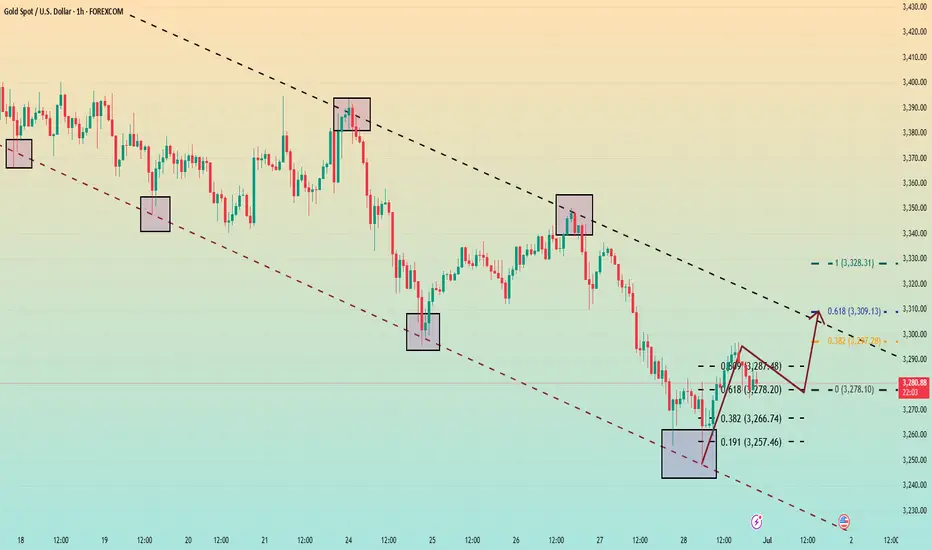
Gold is trading sideways. Has it reached a high point?On the first trading day of this week, after hitting 3247 in the early Asian session, it quickly rebounded to around 3295, and then fell back slightly. It is currently maintained at around 3285.
From the hourly chart, the Fibonacci 0.618 position of this trend from 3247 to 3297 is at 3278. The price has always been above 3278, but it has only fallen below this position in a very short time. If the retracement does not break through the 0.618 position, there is a high probability that there will be a high point in the subsequent trend.
Next, we should focus on the area around 3280. If the price always closes above 3280, then today's high point of 3297 will most likely be refreshed. If the upward trend is opened again, it is very likely to touch around 3310. 3310 is also the current 0.618 position. And it is also the top position of this hourly chart range.
Therefore, we should be cautious when shorting gold above 3280, as there is a high probability that it will reach above 3300.
Aggressive trading can rely on entering the market and going long near 3280, and the profit range is between 3300-3310.
For short strategy trading, Quaid recommends that it is safer to short when the price rebounds near 3310.
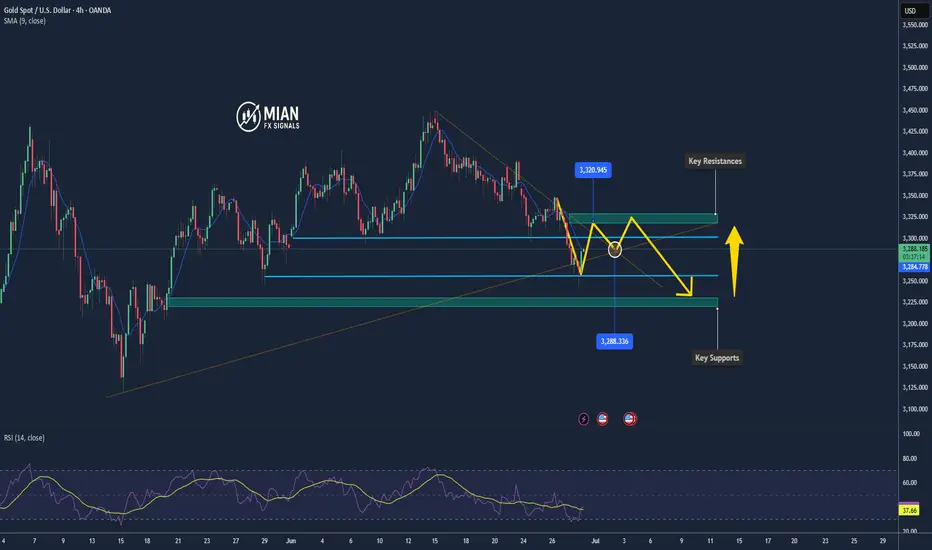
Gold Faces Resistance Near $3,300 Ahead of U.S. Jobs Data📊 Market Highlights:
Gold holds firm above $3,280 supported by expectations of future Fed rate cuts, but upside momentum has stalled as traders await this Friday’s U.S. jobs report. A slight rebound in the U.S. dollar and elevated bond yields are pressuring gold in the short term.
📉 Technical Analysis:
• Key Resistances:
– $3,300 (strong psychological and profit-taking level)
– $3,320 (last week’s high – potential heavy selling zone)
• Key Supports:
– $3,255 (short-term dynamic support – EMA 09)
– $3,230 (major support from previous breakout structure)
• EMA 09: Price remains above the 09 EMA → trend still bullish
• Momentum: The bullish momentum is weakening. A shooting star candle near $3,300 and RSI approaching overbought territory (>70) suggest a possible short-term correction.
📌 Outlook:
Gold may retreat to $3,255 or lower if it fails to break above the $3,300–$3,320 resistance zone. However, the overall bullish trend remains intact as long as price holds above $3,230.
💡 Suggested Trade Setup:
🔻 SELL XAU/USD at: $3,295 – $3,300
🎯 TP: 40/80/200 pips
❌ SL: $3,305
🔺 BUY XAU/USD at: $3,255 – $3,260
🎯 TP: 40/80/200 pips
❌ SL: $3,245
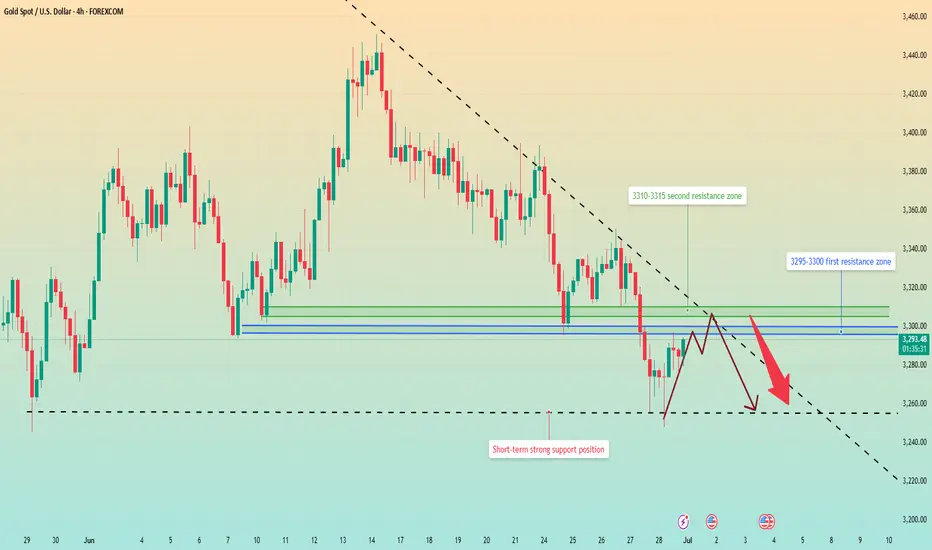
6.30 Safe haven disappears, gold loses its luster!Gold did not break through the upper pressure at midnight last Friday. Gold fell directly after opening in the morning on Friday. The bears broke through the previous 3295 support line, and the lowest reached 3255 in the evening. It closed at around 3274, and the daily line also closed in the form of a big Yin line.
From the 4-hour analysis, the upper short-term resistance focuses on the 3295-3301 line, and the 3316 line is focused on. In terms of operation, it is still rebounding and continuing to be short and follow the trend to fall. The short-term support below focuses on the 3250-3255 line. The overall high-altitude participation tone remains unchanged relying on this range. I will remind you of the specific operation strategy during the session, and pay attention to it in time.
Gold operation strategy:
1. Short gold rebounds at the 3295-3301 line, and short gold rebounds at the 3314-16 line, stop loss at 3326, target 3255-3260 line, and continue to hold if it breaks;

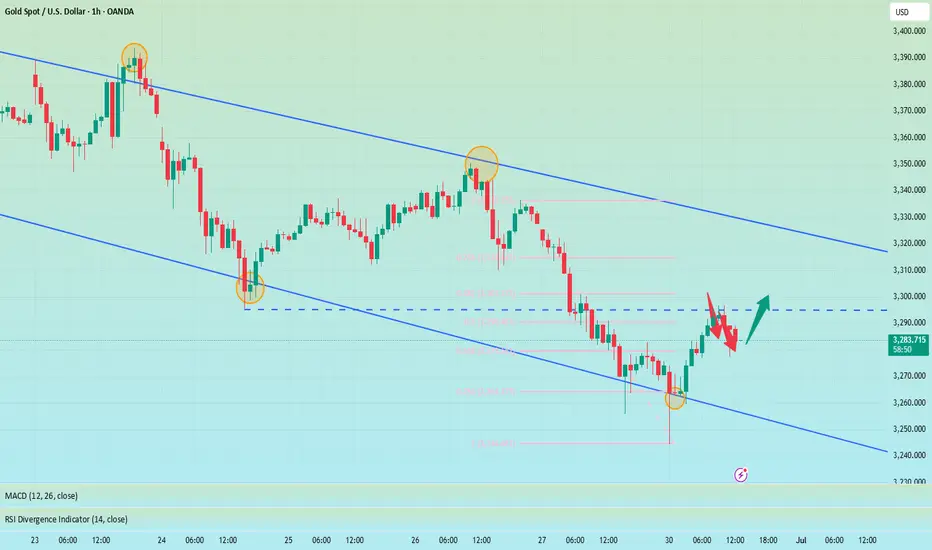
XAU/USD Chart Analysis: Price Retreats to Monthly LowXAU/USD Chart Analysis: Price Retreats to Monthly Low
In mid-June 2025, demand for gold surged following reports of exchanged strikes between Israel and Iran, along with US bombings of Iran's nuclear facilities. As a so-called safe-haven asset, gold prices climbed towards $3,430.
However, by the final day of June, the XAU/USD chart shows that gold had retreated to around $3,250, marking the lowest level in a month.
Why Is the Gold Price Falling?
On one hand, this reflects easing tensions in the Middle East, as a ceasefire—albeit fragile—between Israel and Iran remains in place.
On the other hand, the risk of trade wars is also diminishing. According to media reports:
→ President Donald Trump announced last week that the United States had signed a trade agreement with China and hinted that a “very major” deal with India would follow soon.
→ The US is also close to concluding agreements with Mexico and Vietnam, while negotiations with Japan and many other countries are ongoing.
Technical Analysis of the XAU/USD Chart
Looking at the broader picture, it is worth noting that gold prices in 2025 continue to move within a long-term upward channel (shown in blue), with the following key observations:
→ The channel’s median line acted as resistance (indicated by arrow 1);
→ The line dividing the lower half of the channel in half also showed signs of resistance (indicated by arrow 2).
Now, gold is trading near the lower boundary of the channel – a key support level within the multi-month uptrend. Demand may begin to strengthen here, with long lower wicks on candles on the lower timeframes supporting this view.
A rebound from the lower boundary is possible in early July, but how strong might it be? Note that bears have taken control of the $3,345 level (which has now flipped from support to resistance), and there are signs of a triple top pattern (A-B-C) forming near the $3,430 resistance. This raises the risk of a bearish breakout from the ascending channel.
This article represents the opinion of the Companies operating under the FXOpen brand only. It is not to be construed as an offer, solicitation, or recommendation with respect to products and services provided by the Companies operating under the FXOpen brand, nor is it to be considered financial advice.
