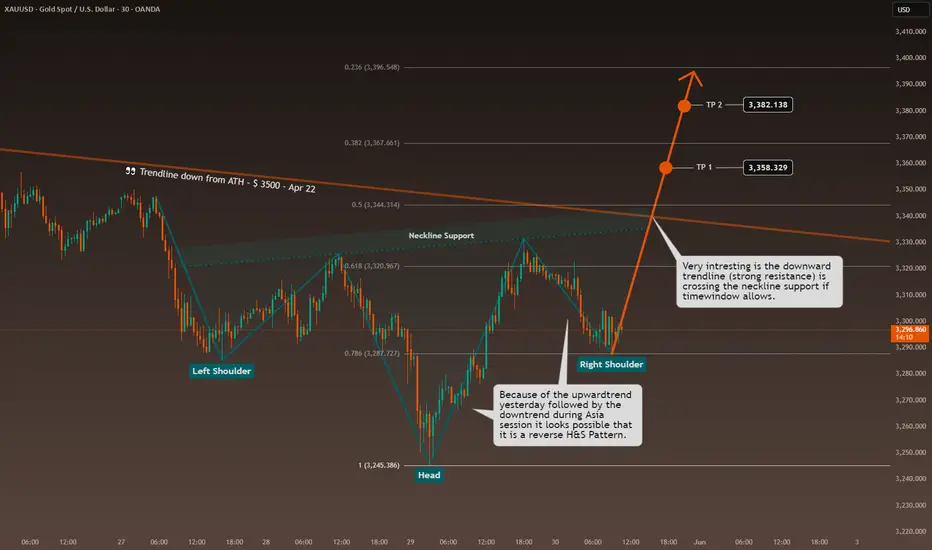
Possible Reverse Head and Shoulders?👁️🗨️ The strong uptrend yesterday, followed by the downtrend during the Asian session, has built a possible inverse head and shoulders pattern (30 min chart) 🤷🏼♂️.
⏫ If an uptrend follows today, the pattern will be complete.
The right shoulder began around $3287, which isn't far from the current price.
👀 Keep an eye on this, as it could drop lower while still keeping the structure intact.
⚡ What's very interesting is that the downward trendline (strong resistance) crosses the neckline support if the time window allows.
🙏 Possible target points:
TP 1: $3358
TP 2: $3382
What are your toughts about this? Please write it in the comments.
-------------------------------------------------------------------------
This is just my personal market idea and not financial advice! 📢 Trading gold and other financial instruments carries risks – only invest what you can afford to lose. Always do your own analysis, use solid risk management, and trade responsibly.
Good luck and safe trading! 🚀📊
Goldprice
GOLD...Hello friends
Due to the entry of buyers and the strong breakdown of the indicated resistance, the price is expected to move to the indicated targets.
*Trade safely with us*
Gold Watch Out for Information Smoke Bombs
💡Message Strategy
Trump's tariff stick ignites the market again
Last Friday, US President Trump's remarks were like a bombshell. He publicly stated that he planned to significantly increase the tariff on imported steel and aluminum from the current 25% to 50%. This radical move immediately triggered a strong reaction from global trading partners. The European Commission immediately issued a warning, saying that Europe is ready to take retaliatory measures.
A weaker dollar boosted gold prices
In addition to safe-haven demand, the weakening of the U.S. dollar index also provided additional support for gold's rise. During the Asian trading session on Monday, the U.S. dollar index fell 0.5% to 98.93, also hitting a new low in nearly four trading days. Since gold is denominated in U.S. dollars, a weaker dollar usually makes gold cheaper for holders of other currencies, thereby stimulating demand.
📊Technical aspects
The international news seems to be bullish for gold, but from the technical trend, gold is currently trapped in a sideways shock at the daily level. After continuous declines, it failed to continue the decline, but continued to be suppressed by the 3350 area. On the weekly line, gold hovered around the 5-day moving average and fluctuated. At the monthly level, it closed with a cross star. From the technical trend point of view, this cross star at the monthly level can be used for attack or defense. However, from the weekly level, the strength and space of the direct upward rush are extremely limited. Without major positive news stimulation, it is difficult to form a trend of rising in the short term. It is highly likely that it will still form a high-rise and fall with the help of fragmentary positive news.
In the short term, focus on whether the suppression of 3350 area can be broken. If it is always under pressure at 3350, it is still expected to fluctuate in the daily range, and the fluctuation range is 3350-3270. Once it breaks through and stands above 3350, gold will have a round of daily level rise in the short term. Once it breaks through the suppression of 3350, you can follow up and go long. On the contrary, before 3350 is broken, you should not rush to chase or be overly bullish.
💰 Strategy Package
Short Position:3345-3360,3365-3375

Don't chase long positions easily during high-level adjustments📰 Impact of news:
1. The conflict between Russia and Ukraine breaks out again, exacerbating the uncertainty of the situation
2. The tension in the Middle East continues, Iran claims to be ready to defend its airspace at any time, and the Houthi armed forces attack Israeli airports
3. May PMI data released
📈 Market analysis:
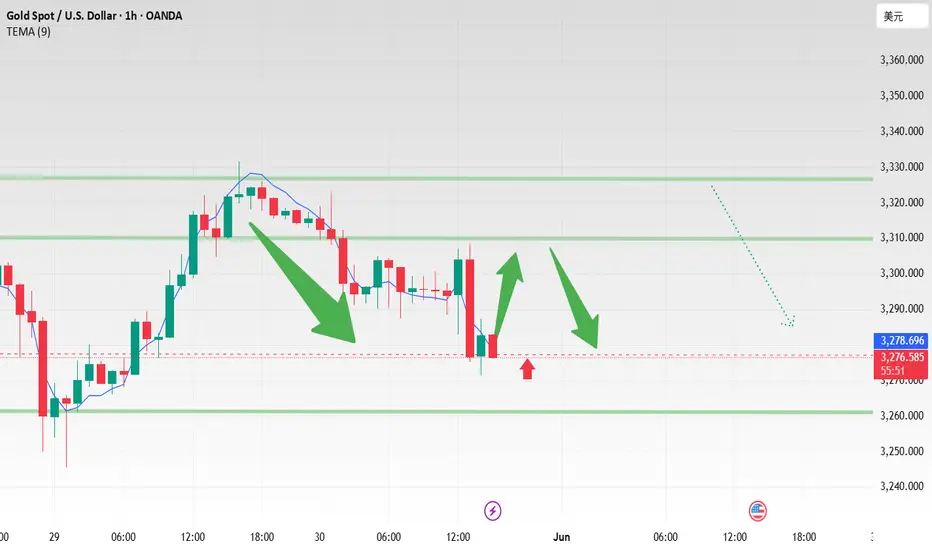
In the short term, the double high points above the gold price are suppressed at the 3365 line. The MACD indicators at the 4H and daily levels tend to form a golden cross, releasing bullish signals. In the short term, if you want to confirm a unilateral upward trend, you need to break through the 3365 line. Despite the strong bullish signals, as I just reminded you, the current technical indicators are close to overbought areas, and I still think there is a certain risk of a correction. In the European session, I will consider trying to short at the 3355-3365 line, and pay attention to the short-term support at 3340-3330 line below. Later, after the price gets some support at the support level, we can consider long trades.
🏅 Trading strategies:
SELL 3355-3365
TP 3340-3330-3320
If you agree with this view, or have a better idea, please leave a message in the comment area. I look forward to hearing different voices.
OANDA:XAUUSD FX:XAUUSD FOREXCOM:XAUUSD FXOPEN:XAUUSD TVC:GOLD

Gold is rising strongly, waiting for a breakthrough.Gold prices soared after the Asian market opened, reaching an intraday high near 3363. However, today's market is also affected by many black swan events.
Event summary:
On the eve of the ceasefire negotiation between Russia and Ukraine, Ukraine attacked a Russian military base with a drone; the United States said it was unaware of the incident.
Trump made a statement saying that China violated the relevant provisions on trade tariffs, and then the US Treasury Secretary said: The United States will never default. This news has worsened Sino-US trade relations.
Due to the sudden black swan event, the sentiment for gold as a safe-haven asset has rapidly heated up, and the price of gold has skyrocketed in the Asian market.
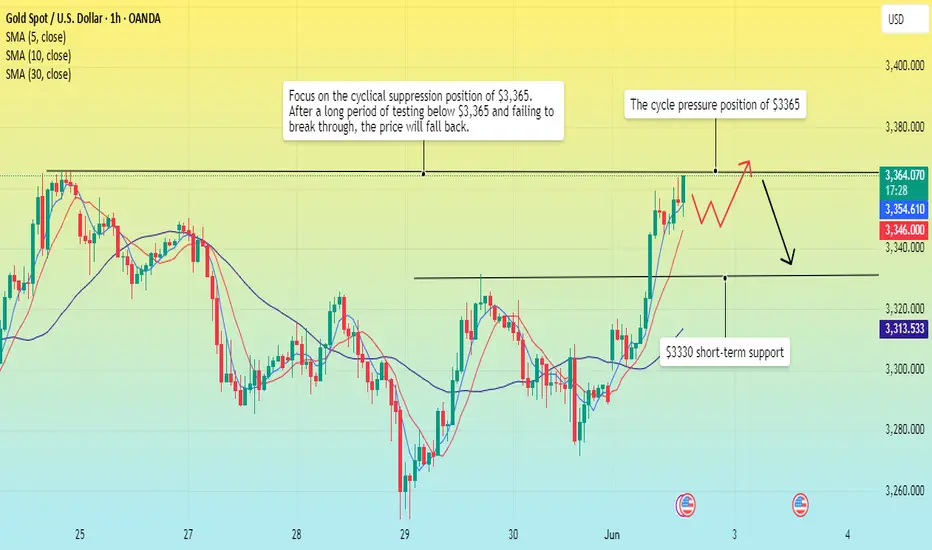
At present, due to the impact of international events, the price of gold has calmed down after the correction, and is currently consolidating around 3355. The 1-hour chart shows that the 5-day MA moving average is currently flat, but the 10-day and 30-day MA moving averages have turned sharply and are on an upward trend, so I think that the current rise in gold has not yet reached its peak.
Market analysis:
The support level in the Asian morning session is around 3300, and the gold price has successfully stood above 3330, and the lower support has also moved up to around 3330; the intraday gold price has a very small retracement, and it is still breaking through the upper side. It is currently trying to break through the cycle suppression level of 3365. After a strong breakthrough, it will reach the cycle high point of 3370. If it fails to break through strongly, the price will fall below 3365 and may touch the current support level of 3330.
Operation strategy:
Buy near 3345, stop loss 3335, target range 3360-3370.
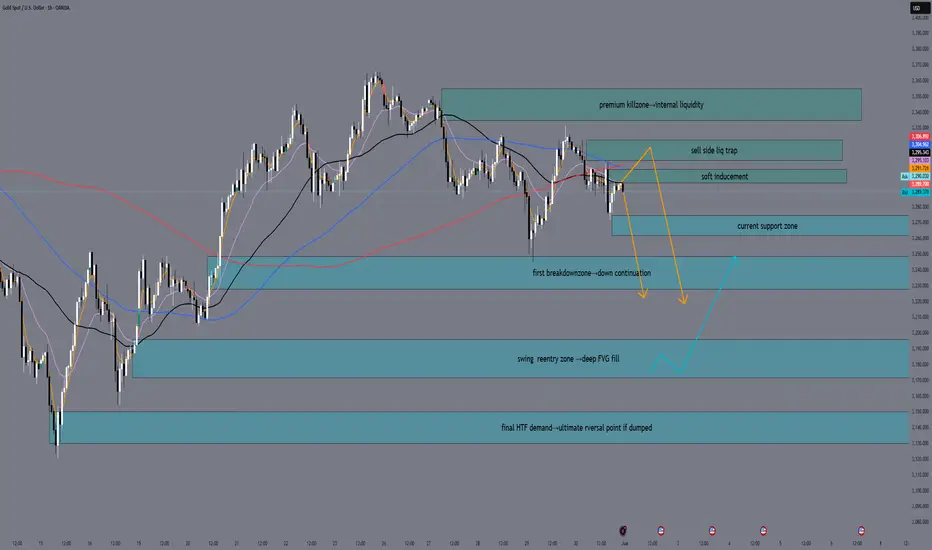
XAUUSD Daily Sniper Plan — Monday, June 2, 2025“Equilibrium Warzone: Will Bears Break Structure or Bulls Reclaim Premium?”
👋 Welcome to the new week, traders. The battlefield is balanced — here’s how we dominate it.
Gold is trading just above equilibrium (3289–3290) after a messy week of premium traps, CHoCHs, and weak bullish continuations. The market has printed clear Lower Highs (LHs) across H1/M15 and failed to reclaim the supply at 3302–3308.
We are now caught in a compression box between M15 OB resistance and discount inefficiency, with liquidity stacked below.
🔹 Current Bias
🎯 Neutral-to-bearish under 3308
🔻 CHoCH + LH formed on both M15 and H1
🧠 Monday will reveal if we break 3270 floor or induce a final trap into premium
🔹 Intraday Structural Zones (Sniper Refined)
🔺 Resistance Zones Above Price
Zone Name Price Range Confluence
🔺 First OB Reaction 3296 – 3302 M15 OB + H1 rejection wick — soft inducement
🔺 Final LH Trap 3308 – 3322 Last Lower High + FVG fill + premium supply
🔺 Premium Killzone 3335 – 3355 Upper trap + internal liquidity — only visited if bulls reclaim structure
🔻 Support Zones Below Price
Zone Name Price Range Confluence
🔻 EQ Reaction Floor 3274 – 3262 Current support shelf + equilibrium wick lows
🔻 First Breakdown Zone 3248 – 3228 BOS origin + M15 CHoCH + clean liquidity stack
🔵 Swing Reentry Zone 3196 – 3172 M15 demand block + clean OB + deep FVG fill
⚫ Final HTF Demand 3150 – 3130 May HL + strong structure base — ultimate reversal point if dumped
🔹 Execution Plan for Monday
✅ Plan A — Sell Setup (Most Probable)
If price taps 3296–3302 early and rejects → short toward 3262
Confirm with M15 CHoCH + bearish PA
Target 3248 → 3228
Hold partials for extension into 3196 if momentum is clean
🔁 Plan B — Inducement Trap Then Drop
Spike into 3308–3322 → watch for LH rejection or FVG sweep
Sell setup becomes valid only if M15 fails to break structure up
Target remains same: 3262 → 3228
🛑 Invalid Buy Conditions
❌ No buys valid inside 3302–3322 → this is smart money trap zone
✅ Buy only valid if:
Deep discount reaction at 3196–3172, OR
Clean break + BOS above 3322, then hold → reentry toward 3355
📊 EMA Structure (5/21/50/100/200)
❌ EMA5 is under 21 and 50 → bearish
⚠️ Price is hugging EMA100 from below
✅ EMA200 (H1) sits at ~3172 → aligns with deep demand zone
Momentum favors sellers if 3308 holds
🔚 Final Thoughts — Battlefield Summary
Gold is stuck in range-to-distribution structure after failing to reclaim premium. With CHoCHs on all major intraday timeframes, momentum is now tilting bearish. The setup is clean: wait for the retest of structure above, then strike into demand zones where clean inefficiencies remain.
Don’t chase fake breakouts. Let price show its hand near OBs and EQ edges — and execute with clarity.
💬 If You Found This Valuable:
📌 Follow GoldFxMinds for live sniper plans, real zone maps, and execution clarity
💡 Smash a LIKE if you’re ready to wait, not chase
👇 Comment your take: Do we drop to 3228 first — or induce 3315 before the flush?
Trade sharp. Trade with structure.
— GoldFxMinds
Affected by tariffs, gold prices rebounded to above 3,300
Gold finally broke the calm of the past and resumed its upward trend. What happened? This is also thanks to President Trump, who imposed tariffs again over the weekend, and there was also news of air strikes. The combination of the two directly broke the calm of gold prices in the past.
So where can this wave of gold go? Technically, gold 1-hour cycle, maintained fluctuations around 3,348, and the support line is expected to be around 3,330.
Our strategy today is also very simple. As long as the gold price retests around 3,360-3,350, I will go short. Which specific position can stop profit? I will tell my VIP.
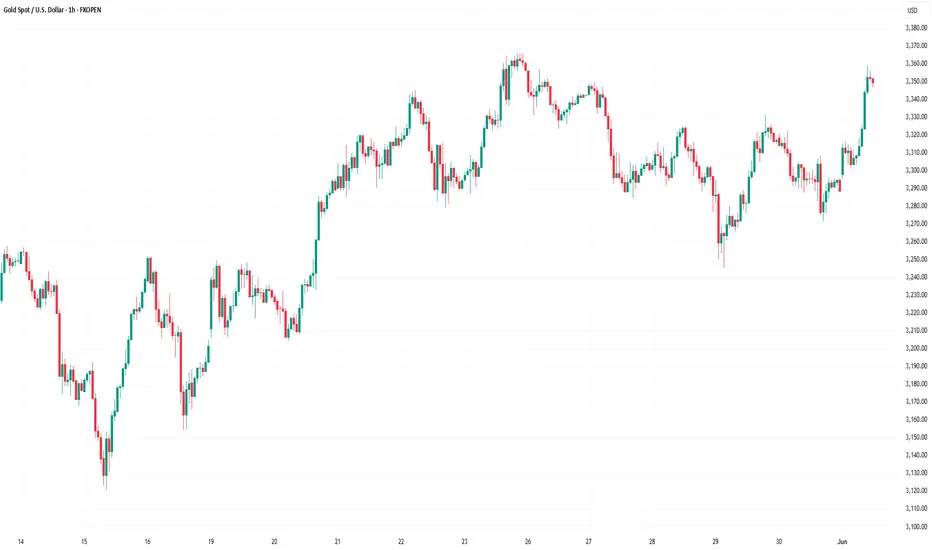
Market Analysis: Gold Price Could Gain Bullish PaceMarket Analysis: Gold Price Could Gain Bullish Pace
Gold started a fresh increase above the $3,300 resistance level.
Important Takeaways for Gold Price Analysis Today
- Gold price started a steady increase from the $3,250 zone against the US Dollar.
- A connecting bearish trend line is forming with resistance at $3,318 on the hourly chart of gold at FXOpen.
Gold Price Technical Analysis
On the hourly chart of Gold at FXOpen, the price found support near the $3,250 zone, formed a base, and started a fresh increase above the $3,280 level.
The bulls cleared the $3,300 zone and the 50-hour simple moving average. There was also a move above the 61.8% Fib retracement level of the downward move from the $3,331 swing high to the $3,271 low. The RSI is now above 50 and the price could aim for more gains.
Immediate resistance is near the 76.4% Fib retracement level of the downward move from the $3,331 swing high to the $3,271 low at $3,318. There is also a connecting bearish trend line forming with resistance at $3,318.
The next major resistance is near the $3,330 level. An upside break above the $3,330 resistance could send Gold price toward $3,382. Any more gains may perhaps set the pace for an increase toward the $3,400 level.
Initial support on the downside is near the $3,300 zone. If there is a downside break below the $3,300 support, the price might decline further.
In the stated case, the price might drop toward the $3,270 support. The next major support sits at $3,250. Any more losses might send the price toward the $3,220 level.
This article represents the opinion of the Companies operating under the FXOpen brand only. It is not to be construed as an offer, solicitation, or recommendation with respect to products and services provided by the Companies operating under the FXOpen brand, nor is it to be considered financial advice.
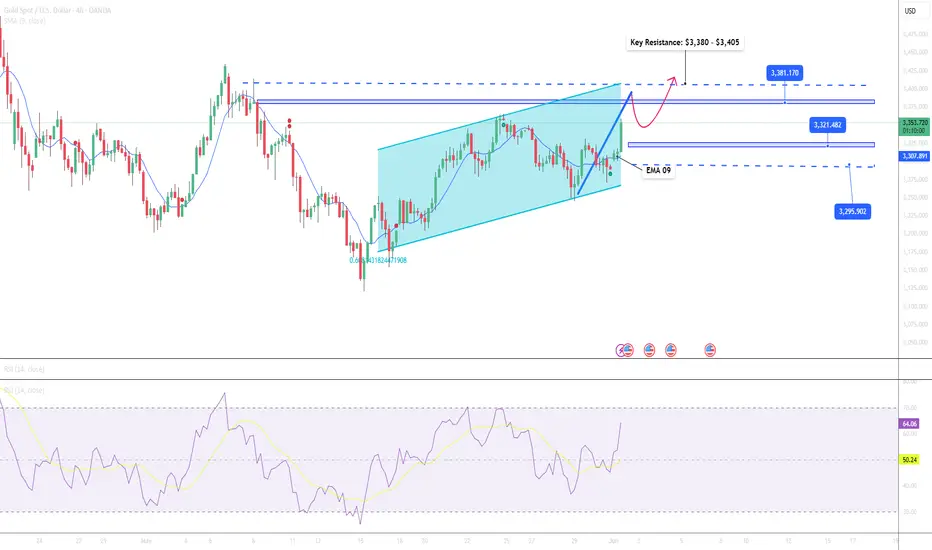
Gold Continues to Rise Amid Increased Safe-Haven Demand📊 Market Overview:
Gold prices surged on June 2, 2025, reaching multi-week highs as investors sought safe-haven assets amid escalating geopolitical tensions and trade war concerns. U.S. President Donald Trump's announcement to double tariffs on steel and aluminum imports to 50%, along with Ukraine's drone attacks on Russian facilities, prompted investors to flock to gold as a secure investment.
📉 Technical Analysis:
• Key Resistance: $3,380 – $3,405
• Nearest Support: $3,320 – $3,295
• EMA: Price is above EMA 09 → uptrend.
• Candlestick Patterns / Volume / Momentum: RSI(14) at 65 , MACD(12,26) signaling buy, indicating continued upward momentum.
📌 Outlook:
Gold may continue its short-term uptrend if it holds above the $3,320 support level. However, caution is advised due to potential technical corrections as RSI indicates overbought conditions.
💡 Suggested Trading Strategy:
SELL XAU/USD at: $3,380 – $3,385
o 🎯 TP: $3,320
o ❌ SL: $3,405
BUY XAU/USD at: $3,295 – $3,320
o 🎯 TP: $3,380
o ❌ SL: $3,270
Trade conflicts are re-emerging, will gold rise?Information summary:
Gold prices rose slightly in early Asian trading on Monday, affected by the long-term uncertainty of tariffs and international geopolitical conflicts, which increased the demand for safe-haven assets.
Trump made a statement earlier that China had violated the Sino-US trade negotiation regulations in a big way; then the US Treasury Secretary assured that the United States would never default. This has once again led to tensions in Sino-US trade relations, and investors are also cautious about this news.
This news has undoubtedly disrupted the international market and supported the rise in gold prices.
Traders need to pay attention to the May ISM manufacturing report to be released by the United States today, which may affect the new trend of gold.
Trading analysis:
I think the repeated emotions of the United States on tariffs will cause gold prices to rebound after a downward adjustment, and then fall slightly.
If gold cannot break through the upward 3350 cycle pressure level strongly and stabilize above this position. Then the price will fall back below this position.
Operation strategy:
Long at 3340, stop loss at 3330, take profit at 3350.
Short at 3350, stop loss at 3365, profit range is around the early support level of 3300-3390.
If you want to trade steadily, you can continue to wait and see for some time, because there are too many black swan events in the Asian market today, and the market is full of uncertainty.

Gold Price Forecast – Bullish Reversal from Support Zone.This 2-hour chart of Gold Spot (XAU/USD) displays a technical analysis setup with key support and resistance zones. The price recently bounced from a significant green support zone near $3,260, suggesting bullish momentum. The projected blue zigzag arrow illustrates a potential upward price movement towards the $3,340 resistance area, indicating a bullish reversal scenario. Volume bars at the bottom highlight recent buying interest. If the price sustains above the immediate resistance (~$3,280), it may continue to rise, targeting successive resistance levels around $3,320 and $3,340.

The international situation is turbulent, how is the trend of goInformation summary:
On June 1, Russia and Ukraine continued to clash. Ukrainian drones attacked several Russian military airports, including military bases in eastern Siberia, more than 40 aircraft were damaged, and the loss was about 2 billion US dollars. This was the first time that a military base in Siberia was attacked by a drone. Murmansk Oblast was also attacked by a drone on the same day.
However, on the same day, Russia and Ukraine planned to hold a second round of ceasefire negotiations in Istanbul on June 2. The United States said that it was not informed of the Ukrainian attack in advance. Russia and the US Foreign Minister discussed the negotiation plan by phone. The Hungarian Prime Minister revealed that the mediation in 2024 was unsuccessful, and the two sides had obvious differences on the timing of the ceasefire.
The current situation is complicated, the prospects for peace talks are unclear, and market risk aversion and economic data (this week's employment report, central bank interest rate decision, etc.) have become new focuses.
Gold trend analysis:
From the daily chart, the current daily support position is around 3280. This position is the key to the gold band trend. Since the price has broken upward recently, it has stepped back many times and finally closed above the daily support, so the position of the daily support is still the key. Before falling below this support level, the price will most likely maintain a range of 3320-3280 US dollars.
Operation strategy:
Buy near 3280, stop loss 3270, profit position 3320.

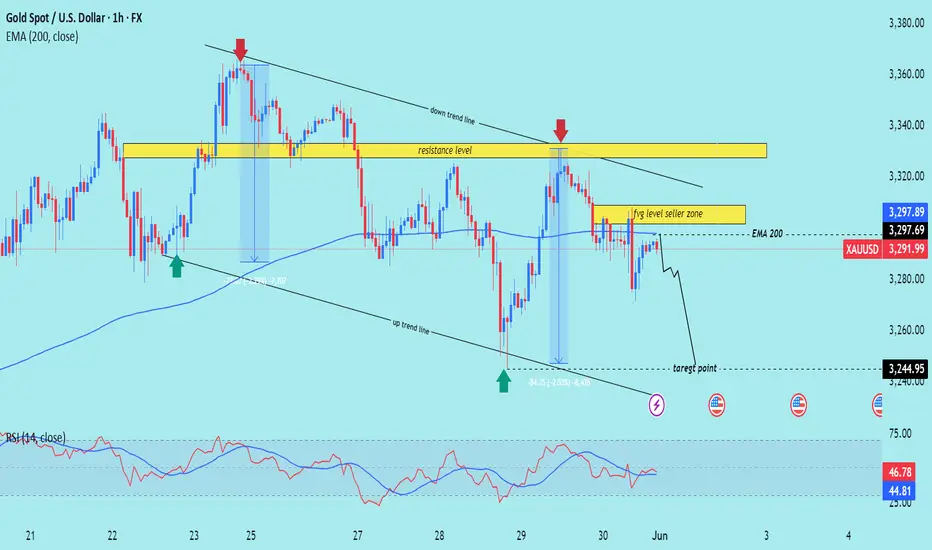
XAU/USD) Bearish trand analysis Read The ChaptianSMC trading point update
Technical analysis of XAU/USD (Gold Spot) on the 1-hour timeframe, based on Smart Money Concepts (SMC). Here's a breakdown of the idea and trading scenario:
---
Overall Idea: Bearish Continuation
---
Market Context
Current Price: $3,291.99
EMA 200: $3,297.69 (acting as dynamic resistance)
Trend: Price is within a descending channel, respecting both downtrend and uptrend lines
Directional Bias: Bearish unless a breakout occurs
---
Key Zones
1. Resistance Level (Sell Zone)
Around $3,320–$3,340
Price rejected this level multiple times → strong supply zone
2. FVG Level (Fair Value Gap)
Around $3,305–$3,315
Price tapped this area and showed rejection
Identified as a "seller zone" – price likely filled imbalance and now resuming trend
---
Projected Move
Price is expected to:
1. Reject EMA and FVG zone
2. Continue downward movement
3. Target support around $3,244.95
---
Indicators
EMA 200: Above price → bearish pressure
RSI (14): ~46.78 → no extreme reading, but leans bearish; room for further downside
---
Trade Idea Summary
Bias: Bearish
Sell Entry: ~$3,300–$3,310 (already triggered)
Stop Loss: Above $3,320
Target: $3,244.95 (demand zone / previous low)
Risk/Reward: Favorable (~1:2+)
Mr SMC Trading point
---
Warnings
Multiple economic event icons are marked (bottom of chart) → potential high volatility, especially around NFP/FOMC-related news
---
pales support boost 🚀 analysis follow)
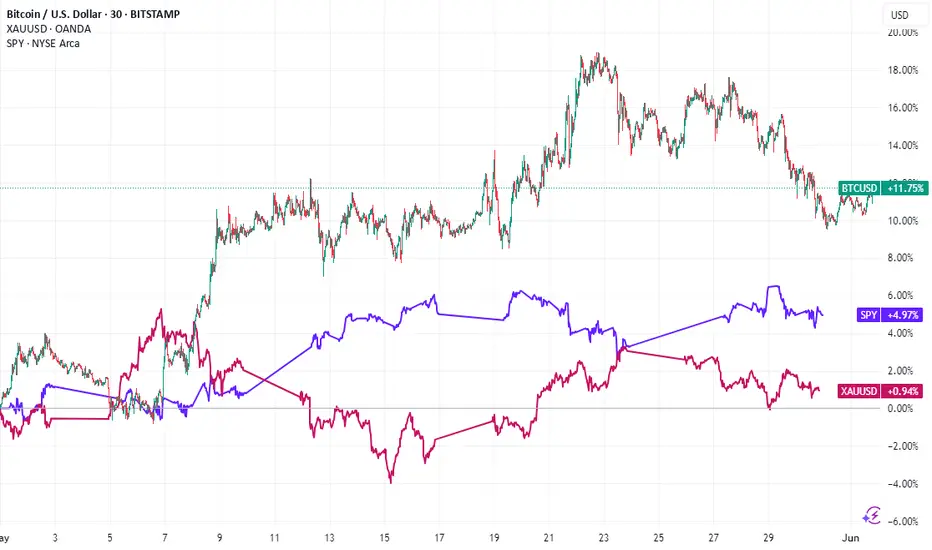
Unmasking the "Intrinsic Value" Debate Between Gold vs BTCFool's Gold? Unmasking the "Intrinsic Value" Debate Between Gold and Bitcoin
The assertion is a familiar one, a well-worn cudgel in the ongoing debate between traditional assets and their digital counterparts: "Gold has intrinsic value that Bitcoin doesn't." This statement often serves as the bedrock for arguments championing the yellow metal's timeless appeal while dismissing cryptocurrency as mere speculative froth. But what if this foundational claim, this appeal to gold's inherent, undeniable worth, is built on shakier ground than its proponents believe? What if the very notion of "intrinsic value" as applied to these assets is a misunderstanding, a convenient narrative rather than an objective truth?
This exploration will journey into the heart of this debate, dissecting the concept of intrinsic value and examining how it truly applies – or doesn't – to both gold and Bitcoin. We will scrutinize gold's much-vaunted industrial utility against the backdrop of its vast above-ground stocks and its overwhelming monetary premium. We will consider whether value is indeed an inherent property of an object or a subjective judgment made by individuals. Ultimately, by challenging long-held assumptions, we aim to illuminate the real sources of value for both the ancient metal and the modern digital asset, moving beyond simplistic labels to a more nuanced understanding.
1. The Elusive Nature of "Intrinsic Value"
Before we can meaningfully discuss whether gold or Bitcoin possesses intrinsic value, we must grapple with the term itself. In the realm of corporate finance, "intrinsic value" refers to the fundamental worth of a company, derived from an analysis of its assets, earnings potential, cash flows, and overall financial health. It's an attempt to ascertain what a stock should be worth, independent of its fluctuating market price. This is the world of discounted cash flow models and balance sheet scrutiny.
However, this definition struggles when applied to commodities or currencies. Gold, like Bitcoin, does not generate cash flows. It doesn't pay dividends or have earnings reports. As one observer noted, gold and Bitcoin are commodities that have a spot price; their "value" is essentially what someone is willing to pay for them at a given moment. Companies, by contrast, can have an intrinsic value tied to the future economic benefits they are expected to produce for their owners.
So, when advocates claim gold has intrinsic value, they are often pointing to something else entirely. Usually, this encompasses its tangible, physical nature – you can hold it, feel its weight. It also refers to its historical use as money and a store of value over millennia. And crucially, it implies a baseline worth derived from its utility in practical applications, particularly in industry. One might even argue, as some have, that there is simply "no such thing as intrinsic value" in an absolute sense; value is not a property embedded within an object but is assigned to it by human beings.
2. Gold's Industrial Utility: A Gilded Facade?
The argument that gold's industrial use underpins its intrinsic value is perhaps the most frequently cited. "But it's used in microchips!" is a common, almost reflexive, defense. And it's true: gold's excellent conductivity, resistance to corrosion, and malleability make it a valuable component in high-end electronics, dentistry, aerospace, and certain medical applications. But the critical question is not whether gold has industrial uses, but how much these uses contribute to its overall market price.
Consider the data for a recent year, say 2024. Global industrial gold consumption was approximately 330 tonnes. However, a staggering 90% of this demand, around 297 tonnes, was met by recycling existing gold scrap, a process that can cost as little as tens of dollars per ounce. This leaves a mere 33 tonnes of new gold required from mining to satisfy the entirety of industrial needs not covered by recycling.
Now, compare this to the annual mine production. In that same year, about 3,700 tonnes of gold were newly extracted from the earth. This means that less than 1% (33 tonnes out of 3,700 tonnes) of all newly mined gold was actually needed for industrial purposes. The vast majority, over 99%, went elsewhere – primarily into jewelry, bars, and coins, all forms of value storage.
The disparity becomes even more dramatic when we consider the total above-ground stock of gold held for these value-storage purposes. This figure stands at roughly 184,000 tonnes. If, hypothetically, gold were to suddenly lose its allure as jewelry and its status as a monetary asset, and this colossal hoard were redirected to meet industrial needs (the 33 tonnes per year not covered by recycling), we would have enough gold to last for approximately 5,600 years at current industrial consumption rates. And this is without digging a single new ounce out of the ground. Much of this 184,000-tonne supply could potentially be acquired at prices far closer to the low cost of recycling than the current market price of newly mined gold.
As one commenter aptly put it, if gold's value was solely based on industrial demand, it "would be nearly worthless" compared to its current valuation. While gold does possess certain unique properties that make it useful, these applications are a drop in the ocean when explaining its price. The idea that its utility in microchips or dental fillings provides a significant "floor" for its value is, upon closer inspection, largely a myth.
3. The Towering Monetary Premium: Where Gold's Value Truly Lies
If industrial use accounts for such a tiny fraction of gold's demand and price, what explains the rest? The answer is its "monetary premium." This is the portion of an asset's price that exceeds its direct use-value as a commodity. For gold, this premium is immense, built over centuries of human history and cultural adoption.
Gold's journey as money began thousands of years ago. Its inherent characteristics – it doesn't rust or tarnish (durability), it's relatively rare (scarcity), it's easily recognizable and has a pleasing aesthetic (acceptability), it can be melted and reformed (divisibility and fungibility), and it's dense (portability of value) – made it a superior choice for a medium of exchange and store of value in pre-industrial societies. This long history has ingrained gold into the collective human consciousness as something inherently valuable. There's a certain "magical power," as one person described it, to the shiny yellow metal, a testament to its enduring legacy.
This historical precedent and the deep-seated belief in its enduring worth are what sustain gold's monetary premium. Central banks hold it in their reserves. Individuals purchase it in the form of jewelry (which, in many cultures, serves as a primary store of family wealth) and invest in bars and coins, not primarily for its practical applications, but because they trust it will preserve purchasing power or be desired by others in the future. This shared belief, this social consensus, is the bedrock of gold's value far more than its limited industrial applications. Some estimate this monetary premium to be as high as 90% of its total price, with the remaining 10% attributable to its use in jewelry and industry.
4. The Shifting Sands of Perceived Value
The notion that value is intrinsic and immutable is challenged by history itself. Value, as many economists and observers contend, is not an inherent property of an object but is determined by human perception and utility, which can and do change over time.
Consider aluminum. There was a time when aluminum was exceedingly rare and difficult to extract, making it more precious than gold. The capstone of the Washington Monument, completed in the late 19th century, was made of aluminum to signify its value and the technological prowess of the era. Today, thanks to advancements in refining processes, aluminum is abundant and inexpensive. We use it to wrap sandwiches, a far cry from its days as a "precious" metal adorning national monuments.
Similarly, Tyrian purple dye, derived from sea snails, was once so costly and labor-intensive to produce that its use was reserved for royalty and the highest echelons of society. It symbolized power and status. The invention of synthetic dyes in the 19th century made purple accessible to everyone, and the immense value once attached to the natural version evaporated.
These examples powerfully illustrate that what society deems valuable is not fixed. It is contingent on factors like scarcity (natural or artificial), the current state of technology, cultural significance, and collective human agreement. If gold's value is predominantly a monetary premium built on historical consensus and aesthetic appeal, then it too is subject to these shifting sands of human perception. The humorous desire to one day wrap sandwiches in gold foil, should it lose its monetary status, underscores this potential for radical revaluation.
5. Bitcoin's Utility: Solving Problems of the Digital Age
If gold's claim to "intrinsic value" through industrial use is tenuous, and its primary value stems from a historically constructed monetary premium, how does Bitcoin compare? Critics often dismiss Bitcoin as having no utility beyond speculation, a digital tulip mania. However, this perspective often overlooks the specific problems Bitcoin was designed to address and the unique properties it offers in the 21st century.
Bitcoin emerged in the wake of the 2008 financial crisis as a "peer-to-peer electronic cash system," aiming to provide an alternative to the traditional financial system. Its utility lies in its ability to offer:
• Decentralization: No single entity, corporation, or government controls the Bitcoin network. It operates on a distributed ledger (the blockchain) maintained by thousands of computers worldwide. This makes it resistant to control or shutdown by any central authority.
• Permissionless Access: Anyone with an internet connection can participate in the Bitcoin network – send, receive, and store value – without needing permission from a bank or government.
• Censorship Resistance: Once transactions are confirmed and added to the blockchain, they are extremely difficult to alter or reverse. This makes it a powerful tool for individuals in environments where financial censorship is a concern.
• Provable Scarcity: The Bitcoin protocol dictates that there will only ever be a maximum of 21 million bitcoins. This hard cap on supply is a fundamental aspect of its design, making it a verifiably scarce digital asset. This contrasts with gold, where new supply is continuously mined each year, estimated by some to be around 1.5-2% of the existing above-ground stock, arguably diluting its value over time.
• Portability and Divisibility: Bitcoin is incredibly portable. Vast sums can be "carried" on a tiny device or even memorized as a seed phrase, and transferred across the globe in minutes for relatively low fees. It is also highly divisible, down to one hundred millionth of a bitcoin (a "satoshi"), facilitating transactions of various sizes.
• Verifiability: The authenticity and transaction history of every bitcoin can be publicly verified on the blockchain, eliminating the need for trust in intermediaries for this purpose.
• Durability: As a digital asset secured by a vast, decentralized network, Bitcoin is highly durable as long as the network itself remains operational and secure.
A crucial real-world utility, highlighted by observers, is Bitcoin's ability to bypass capital controls. For individuals in countries with restrictive financial regimes, Bitcoin offers a means to transact and move value across borders with a degree of freedom not possible through traditional channels. This is not a speculative feature; it is a tangible benefit solving a real problem for many.
While the number of people using Bitcoin worldwide is still relatively small compared to users of traditional financial systems, its adoption is growing. Like any transformative technology, its utility is being discovered and leveraged by an expanding user base. Its "intrinsic value," if we are to use that term, lies in its capacity to fulfill these unique functions.
6. Gold vs. Bitcoin: A Clash of Properties
When we compare gold and Bitcoin based on properties often associated with a store of value or monetary good, distinct profiles emerge:
• Tangibility: Gold is physical; you can touch it. This offers a psychological comfort that some find reassuring. Bitcoin is digital; its existence is as code and ledger entries. Its "possession" is through control of cryptographic private keys.
• Industrial Utility: Gold has limited industrial uses that account for a tiny fraction of its price. Bitcoin's "industrial utility" is the operation of its network as a global system for value transfer and verification.
• Scarcity: Gold is naturally scarce, but its total earthly and cosmic abundance is unknown, and new supply is constantly mined. Bitcoin has absolute, programmable scarcity with a fixed supply cap.
• Portability: Moving large amounts of gold is cumbersome, expensive, and risky. Bitcoin is exceptionally portable.
• Divisibility: Gold can be physically divided, but it's not a seamless process. Bitcoin is easily and precisely divisible.
• Verifiability: Authenticating gold requires specialized knowledge and tools; it can be faked. Bitcoin transactions and holdings are verifiable with mathematical certainty on its public ledger.
• Durability: Gold is physically very durable. Bitcoin, as a digital protocol, is durable as long as its decentralized network is maintained and secured.
• Historical Precedent: Gold boasts millennia of use. Bitcoin is a little over a decade old, a mere infant by comparison.
• Censorship/Seizure Resistance: Physical gold can be, and has been, confiscated. Self-custodied Bitcoin, with properly secured private keys, is highly resistant to censorship and seizure.
This comparison reveals that while gold's strengths lie in its long history and physical presence, Bitcoin excels in areas like absolute scarcity, portability, divisibility, verifiability, and censorship resistance – attributes that are arguably increasingly valuable in an increasingly digital and interconnected global landscape.
7. The "Next Person" Fallacy and the Foundation of Value
A common critique leveled at both gold (for its monetary premium) and Bitcoin is that their value depends solely on "the next person being willing to buy it." In a sense, this is true for any asset that isn't consumed directly or doesn't produce cash flows. The value of a collectible, a piece of art, or indeed a monetary good, is ultimately what someone else is prepared to exchange for it.
However, this doesn't mean their value is arbitrary or baseless. The willingness of the "next person" to buy is predicated on a shared understanding or belief in the asset's desirable properties and its potential to retain or increase its value. For gold, this belief is built on thousands of years of tradition and its perceived enduring qualities. For Bitcoin, this belief is growing based on its unique technological attributes, its potential to solve modern financial problems, and its emerging network effects. The more people who recognize and utilize these properties, the stronger the shared belief, and thus the more robust its value becomes.
8. The Cost of Production and the Illusion of a Price Floor
Some argue that gold's price cannot fall below its cost of extraction, suggesting this provides a natural price floor. While it's true that miners would cease operations if the price fell below their production costs for a sustained period, this argument largely ignores the colossal 184,000 tonnes of gold already above ground and held primarily for monetary or aesthetic purposes. If this massive hoard were to lose its monetary premium and be dumped onto the market, the price could plummet dramatically, far below current mining costs, until it reached a level where industrial demand (or perhaps a new, much lower equilibrium for aesthetic use) could absorb it. Much of this existing stock could be made available at recycling costs, which are significantly lower than mining costs. The "cost of production" floor applies primarily to newly added supply, not to the revaluation of existing, hoarded stock.
Conclusion: Beyond Intrinsic – Value in Utility and Belief
The debate over whether gold has "intrinsic value" that Bitcoin lacks often misses the mark by clinging to a nebulous and misapplied concept. If "intrinsic value" refers to a baseline worth derived from non-monetary, practical utility, then gold's claim is surprisingly weak. Its industrial applications are minimal compared to its price, which is overwhelmingly a monetary premium built on centuries of human belief, cultural acceptance, and its historical role as money.
Value, ultimately, is not an inherent property magically residing within an object. It is a subjective judgment made by individuals, a reflection of an asset's perceived utility and the collective belief in its future desirability. Gold has served humanity well as a store of value due to a set of physical properties that were optimal for pre-digital eras. Bitcoin, a product of the digital age, offers a different set of properties – provable scarcity, decentralization, censorship resistance, and unparalleled portability – that address the challenges and opportunities of our modern world.
Neither gold's sheen nor Bitcoin's bits possess a mystical "intrinsic value" independent of human perception and use. Gold's value is rooted in its long history and the enduring human affinity for its beauty and permanence. Bitcoin's burgeoning value is rooted in its innovative technology and its potential to offer a new paradigm for money and value transfer. Both are valuable because, and only because, people believe them to be. The critical difference lies in the reasons for that belief and the problems each asset is perceived to solve. As the world continues to evolve, so too will our understanding and assignment of value.
Technical Analysis on XAU/USD (Gold vs USD) – Bullish Reversal📊 Chart Overview:
This chart of XAU/USD (Gold) on a lower timeframe shows a potential bullish reversal setup. The price action has formed a series of lower highs and lower lows, but now a bullish momentum is building up, suggesting a possible breakout to the upside.
🔍 Key Observations:
🟠 Swing Points Identified:
The orange circles mark significant swing highs and lows, clearly outlining a recent downtrend.
The latest swing low (bottom-right) shows a strong rejection with a bullish engulfing candle forming, indicating buyer interest.
📦 Demand Zone (Support Area):
The grey rectangle near the lower region marks a demand zone where buyers have stepped in before.
Price has reacted strongly from this zone again, validating it as a key support level.
📉 Resistance Turned Potential Breakout Zone:
The red line (~3,291.416) represents a resistance level that was previously support.
Price has broken above it and now appears to be retesting it, indicating a possible retest-confirmation for a bullish continuation.
🎯 Target & Risk Management:
✅ Entry: Confirmed breakout and retest around 3,291.
📈 Target: 3,364.819 (green zone above), based on previous resistance.
❌ Stop Loss: Below 3,267.772, the recent swing low.
The setup offers a favorable risk-to-reward ratio.
🧭 Projection Path:
The white arrowed path illustrates a likely pullback before continuation upward, suggesting a bullish structure if confirmed.
✅ Conclusion:
Gold is showing signs of a bullish reversal from a well-defined demand zone, with a potential rally toward the 3,365 area. A successful retest of the broken resistance as new support would strengthen the bullish bias.
📌 Watch closely for confirmation candles on the retest before entering.

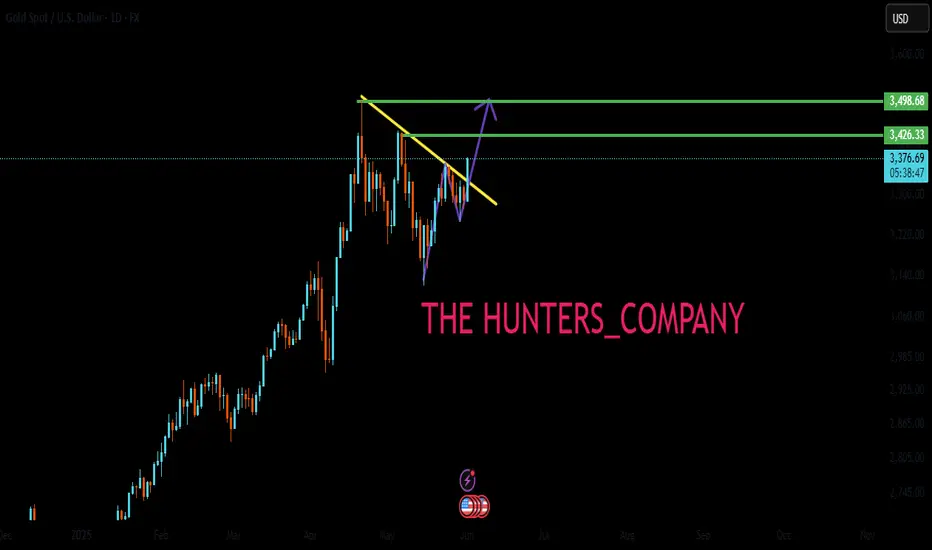
The dollar is strong, will gold break through the consolidation?At the beginning of this week, the US dollar index fell to a one-month low due to Trump's sudden change in the direction of the EU policy. Subsequently, due to the contest between Trump and the US Trade Court ruling, the prices of gold and the US dollar fluctuated greatly.
I think the US dollar will start to rise next week with the help of non-farm payrolls data. I am afraid that a new round of price fluctuations is coming.
If the US dollar is to have a new upward trend in June, gold will also be affected. Judging from the current daily line of gold, the overall trend is also to be adjusted downward.
The high point of gold in May was 3438, and the low point was 3120. I also drew the Fibonacci dividing line in the figure. The most critical position is 3317 at the 0.382 position and 3280 at the 0.5 position.
Gold is still maintaining a consolidation of 3317-3280. Although there have been breakthroughs above and below, they are all within the daily range. Next week, as long as gold can close below 3280 on the daily line, it will start a correction trend step by step. The first target below is around 3250, and the second is 3180-3200.
As long as the daily line of gold can close below 3180, then we will usher in a big bearish trend at the daily level. On the contrary, the daily line of gold cannot close above 3317 again. In a better situation, it may touch around 3340 again and then retreat again.
The bad result is that it directly breaks through the pressure level and stands above the 3340 trend line. If this happens, the price of gold may move towards a new high.

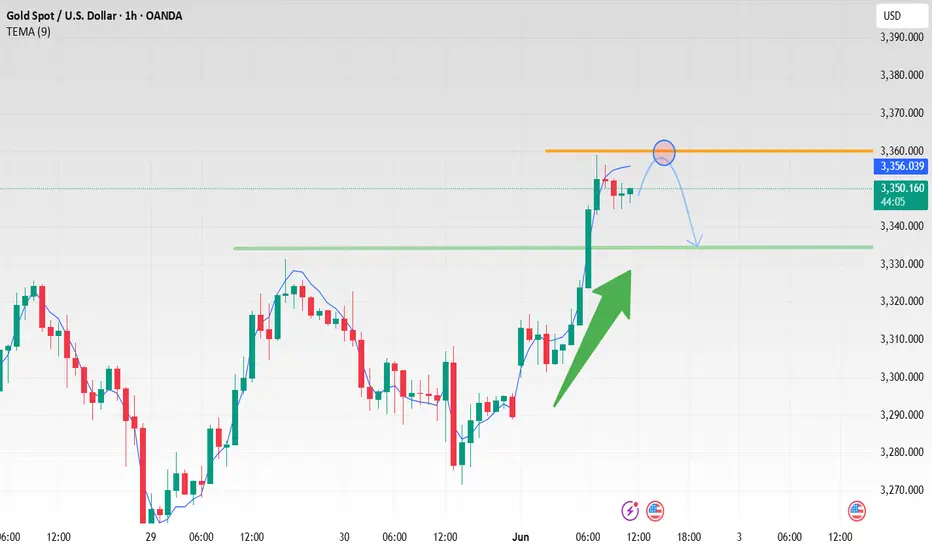
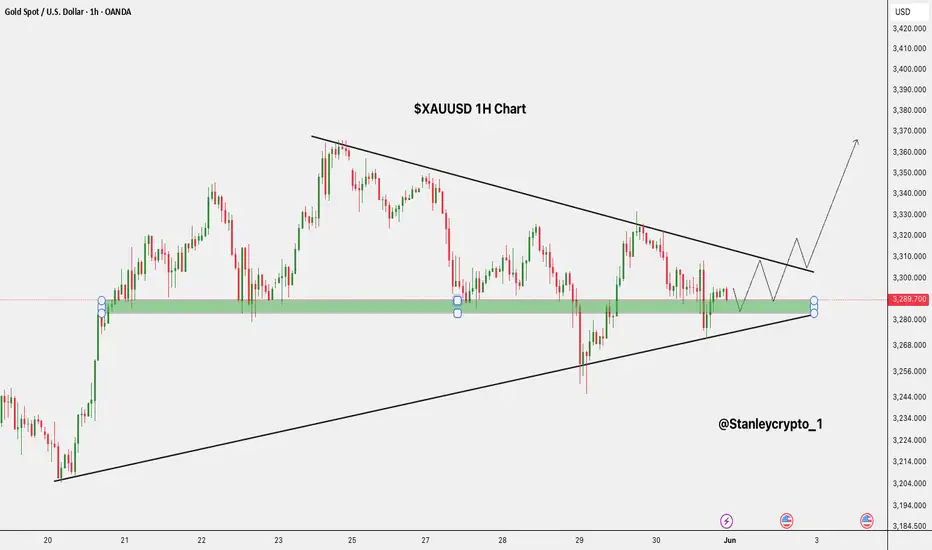
$XAUUSD Breakout Loading OANDA:XAUUSD Breakout Loading
The OANDA:XAUUSD 1H chart shows a symmetrical triangle forming, with strong support around the $3,280–$3,290 zone.
Price is consolidating above this key area, suggesting bullish pressure.
A breakout above the descending trendline could push gold toward $3,320 and potentially $3,360.
A breakdown below the support zone would invalidate this setup.
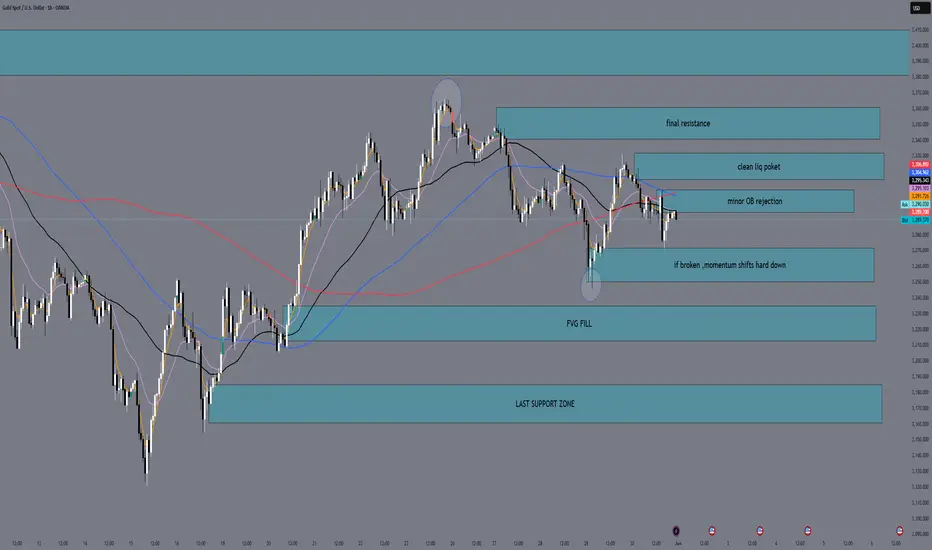
XAUUSD H1 Outlook – Monday, June 2, 2025“Equilibrium Loading — Breakout or Breakdown?”
👋 Welcome back traders — let’s decode the H1 battlefield together.
Gold is currently consolidating just under the 3290–3300 magnet, after a slow Friday close. The chart shows clear lower highs and rejection from premium, with multiple CHoCHs confirming bearish intent. However, price hasn’t fully broken below key H1 structure yet, holding just above equilibrium support.
We’re sitting in a coiled market — liquidity has built on both sides. Monday will likely give us the breakout.
🔹 Current Bias
🔻 Bearish bias while under 3308
📉 Structure shows CHoCH → BOS → LH, all under premium
🧭 Price is compressing between 3300 resistance and 3270 support
🔹 Refined Structural Zones (Realistic Width)
🔺 Key Resistance Zones (Upside)
Zone Price Range Context
🔺 Minor OB Rejection 3295 – 3308 Local OB + premium zone → first reaction area
🔺 Inducement Trap 3315 – 3335 Clean liquidity pocket → likely wick spike trap if retested
🔺 Extended Premium Zone 3340 – 3360 Final resistance from May → only valid if HH breaks
🔻 Key Support Zones (Downside)
Zone Price Range Context
🔹 Equilibrium Hold 3270 – 3250 Current floor. If broken, momentum shifts hard down
🔻 CHoCH + FVG Fill 3235 – 3212 BOS zone + inefficiency. Logical sell-side draw
🔵 Discount Demand Zone 3185 – 3160 Last HL + OB. Major reaction zone for swing reentry
🔹 EMA Flow (Momentum Outlook)
❗ Price is below all EMAs (5/21/50/100/200) = bearish stacked pressure
EMA100/200 are bending — momentum is confirming bearish tilt
Only a sharp move above 3308 will flip momentum short-term
🧠 Tactical Scenarios for Monday:
🔻 Sell Bias Active:
Rejection from 3295–3308 = possible LH → short down to 3250
Break of 3250 → continuation leg toward 3212 and 3185
🔁 Trap and Flip (Low Probability):
Price breaks above 3308 and holds → possible squeeze into 3335
Confirm with BOS + bullish PA on M15-H1
🔚 Summary:
Gold on H1 is coiled tightly inside mid-premium, and structure is now pointing slightly bearish. If we stay under 3308, the path of least resistance is down. If bulls trap sellers and break above, 3335 becomes the target.
Let price reveal its intent — you trade from clean structure, not from bias.
💬 Was this helpful?
📍 Follow GoldFxMinds for daily sniper-entry levels, bias shifts, and clean trade maps
👍 Like if you're waiting for confirmation before reacting
👇 Comment below: Will we flush into 3212 — or spike 3335 first?
See you in the charts.
— GoldFxMinds
XAU/USD Gold short to long ideaIn this week’s analysis, price is currently positioned between a few key zones where we could expect reactions. Given the overall bullish trend, we’ll be using the broader bias to guide our setups, but there’s also opportunity for tactical short-term plays.
Recently, price has shown strong bearish structure, forming new supply zones such as the 6H supply, which is now close by. If price reacts from this level, there’s potential for short-term sells targeting the clean 9H demand zone below — a solid area where I’ll be looking for a possible Wyckoff accumulation and bullish continuation with the trend.
Confluences for GOLD Shorts:
- Recent strong bearish structure and downside moves
- Significant liquidity and imbalance to the downside
- Well-defined 6H supply zone has formed nearby
- Market appears overbought, and bearish pressure is becoming more visible
- For long-term bullish continuation, price may need to revisit the demand zone below
P.S. If gold pushes higher first and sweeps the liquidity above, I’ll be watching closely for signs of Wyckoff distribution before considering any short-term sell setups. Patience is key — let the market show its hand before reacting.

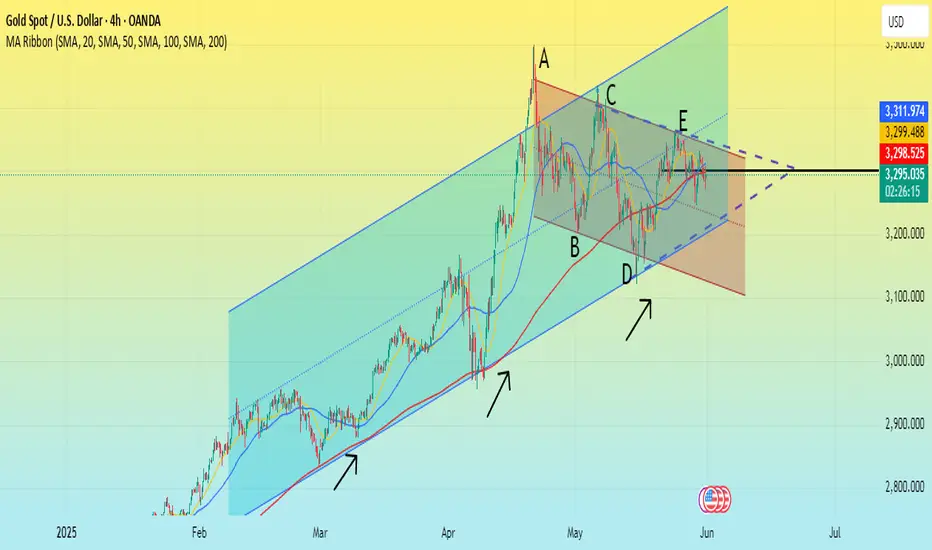
Technical Analysis → Gold will remain stableThroughout May, the news backdrop, including international trade tariffs and geopolitical turmoil, led to a technical peak of around $3,430 and a low near $3,130 in gold. As of now, the price per ounce is stable at around $3,300, roughly the same level as at the beginning of the month.
This shows that supply and demand forces are basically balanced, and prices are maintained between these two extremes. Gold technicals further confirm this and highlight the importance of the $3,300 level.
Bearish perspective: The A→B→C→D→E sequence forms a peak high and a cycle low, which is a clear downtrend signal. The trajectory is marked in red, and the upper line constitutes resistance.
Bullish perspective: Since the beginning of 2025, the price of gold has been in an upward trend, represented by the blue channel, and its lower boundary constitutes key support (marked with arrows).
It is worth noting that these support and resistance lines are converging, forming a narrowing triangle. This shows that supply and demand are balancing and the market has reached a consensus around the $3,300 level, which is exactly the central axis of the triangle.
Based on this, we can reasonably assume that the technical side of gold in June may continue to fluctuate within this triangle unless a special event occurs that causes a significant break in the current balance.
Gold retested as expected, what to do next?
Gold rebounded from 3308 in the US market and fell to 3272. The recent market is good-looking but difficult to do. The long and short positions are repeatedly washed. The monthly line basically closed at the cross star. Under the fierce game between long and short positions, the performance was balanced.
The short-term hourly line is only a single negative line that fell rapidly, and it does not have downward continuity. The high point of the US market rebound is around 3302. If you want to participate, you can go short when it reaches around 3302. As of press time, gold is accumulating strength around 3293. If you step back below, you can rely on the low point for defense.
⭐️ Note: Labaron hopes that traders can properly manage their funds
- Choose the number of lots that matches your funds
- Profit is 4-7% of the fund account
- Stop loss is 1-3% of the fund account

Gold price rebounded. Strategy is coming.Gold rose yesterday under the stimulus of risk aversion; gold did not continue the upward trend today, which means that the risk aversion sentiment of gold has been digested. The 4-hour moving average of gold formed a dead cross, and MACD also formed a dead cross. Then gold is likely to maintain the morning support position near 3290 for oscillation.
I think we can continue to short after gold rebounds. After the opening of the US market, the rise of gold has been under pressure at the 3310 line and cannot break through. Gold rebounded under pressure at 3310 and continued to short on rallies.
The market situation is changing all the time. We cannot always use the same trading strategy. If the price fails to rise, we will implement a short strategy; in line with the changes in the market, we can make profits faster.
Operation strategy:
Short near 3305, stop loss 3315, profit range 3270-3260.

Gold rebounds in the US market and continues to be short!
📊Comment analysis
Gold rose yesterday under the stimulus of risk aversion, so gold did not continue to rise today, which means that the risk aversion sentiment of gold has been digested, and the 1-hour moving average of gold has also begun to turn downward and has not crossed upward, so the momentum of gold shorts has begun to increase, and gold rebounds and continues to be short. After gold surged, it has been under pressure at the 3310 line and cannot break through. Therefore, gold rebounds in the US market and continues to be short at highs under pressure at 3310.
💰Strategy Package
US trading operation ideas:
Gold 3304-3310 short, stop loss 3315, target 3280-3270-3260;
⭐️ Note: Labaron hopes that traders can properly manage their funds
- Choose the number of lots that matches your funds
- Profit is 4-7% of the capital account
- Stop loss is 1-3% of the capital account