Gold Price Struggles at Key Support ZoneTechnical Analysis – Data as of June 25–26, 2025
In the latest trading sessions, XAUUSD continues to move within a narrow range, reflecting a cautious market sentiment awaiting clearer signals. The daily chart shows price hovering around the 3,341 USD level — aligning with the 0.618 Fibonacci retracement and intersecting key descending trendlines and previous correction zones.
1. Notable Price Action:
Gold has bounced slightly from the 3,294 USD support and retested the 3,360–3,365 USD resistance but failed to break through.
Small-bodied candles with long wicks indicate indecision, suggesting that neither buyers nor sellers have a clear upper hand.
The descending trendline (blue line) is acting as a significant resistance barrier, with each bullish attempt being rejected.
2. Key Support and Resistance Levels:
Immediate Support: 3,294 – 3,296 USD
Nearby Resistance: 3,360 – 3,365 USD
Crucial Breakout Zone: 3,382 – 3,394 USD (Fibonacci 0.618 – 0.786 of the latest downleg)
3. Short-Term Trading Strategy:
If XAUUSD maintains support above 3,294 USD, a short-term technical rebound toward 3,360 – 3,394 USD is possible.
However, a clean break below 3,294 with strong volume could trigger further downside momentum, potentially targeting 3,265 USD or even 3,221 USD.
4. Overall Outlook:
The market is currently in a state of uncertainty, with neither side showing dominance. Traders are advised to wait for a decisive breakout in either direction before entering new positions. Breakout trading strategies with volume confirmation should be prioritized in this phase.
Goldprice
6.26 Gold intraday analysis guideOn Wednesday (June 25), international spot gold rose slightly during the US trading session, but was still suppressed by the 20-day moving average (US$3,355). The RSI (14) was at 48.7, in the neutral range of 40-60, suggesting that the market lacks a clear direction. US$3,355 (20-day moving average) has become the recent watershed between long and short positions. If it breaks through this level, it may test the psychological barrier of US$3,400. The support below is US$3,245 (the low point on May 29). If it fails, it may drop to the integer level of 3,200 and US$3,121 (the low point on May 15). Stability of the geopolitical situation: If the ceasefire agreement in the Middle East continues, the outflow of safe-haven funds may further suppress the gold price. Fed policy expectations: If the July non-agricultural and CPI data show that inflation is cooling down, it may rekindle expectations of interest rate cuts and boost gold. The current gold market is in a "wait-and-see mode", and both long and short sides lack decisive momentum. Traders need to pay close attention to: US economic data: especially employment and inflation indicators for the Fed's policy path. Geopolitical dynamics: Any breakdown of the ceasefire agreement could quickly push up safe-haven demand. Dollar trend: If the Fed maintains a hawkish stance, a stronger dollar may further suppress gold prices. Gold is expected to maintain range fluctuations in the short term, with the $3,355 moving average resistance and $3,245 support forming a key trading range. The direction of the breakthrough depends on new fundamental catalysts.
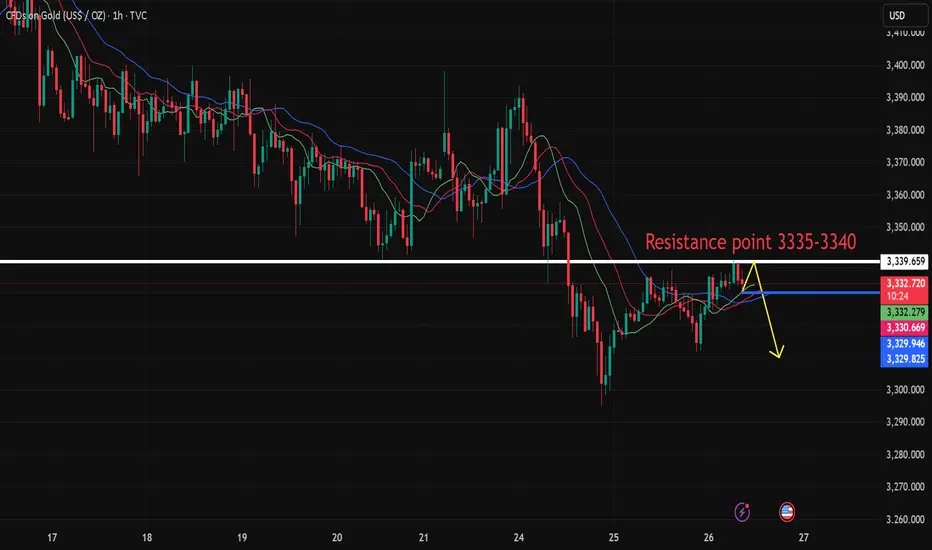
Personal operation analysis:
Trend: Oscillating trend
Support: Near 3,300.00
Resistance: Near 3,335.50
Strategy:
View logic: Short view near 3,335-3,340, stop loss 3,345, take profit near 3,300--3,280, and follow the stop loss 300 points.
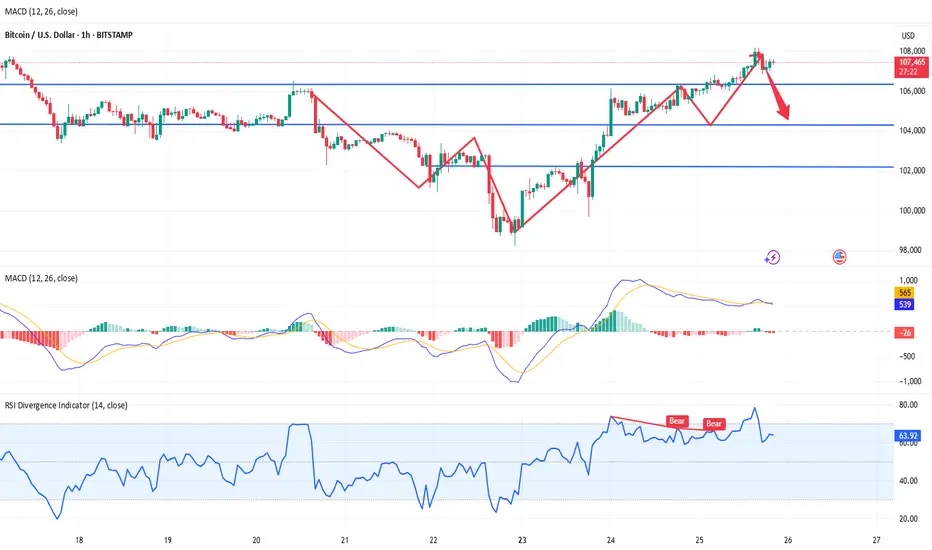
BTC continues to short at high levels during the day📰 Impact of news:
1. Geopolitical impact
📈 Market analysis:
BTC has reached an intraday high of 108,125, just one step away from the all-time high of 112,000. With the increase in trading volume and institutional sentiment turning bullish, the momentum seems to be in the bulls' favor. In addition to institutional buying, the ceasefire agreement in the Iran-Israel war is also an important factor in Bitcoin's sharp rebound. Trump's announcement of the end of the war almost immediately triggered a surge in the cryptocurrency market. However, the overall pattern has not changed, and the range resistance has not been broken, so we still keep the idea of shorting at high levels.
🏅 Trading strategies:
SELL 108000-107500
TP 104500-103500
If you agree with this view, or have a better idea, please leave a message in the comment area. I look forward to hearing different voices.
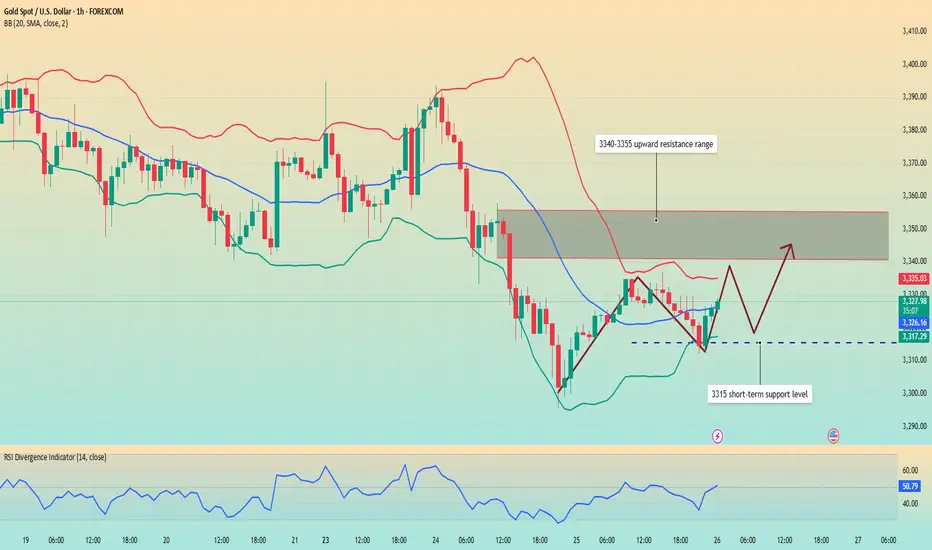
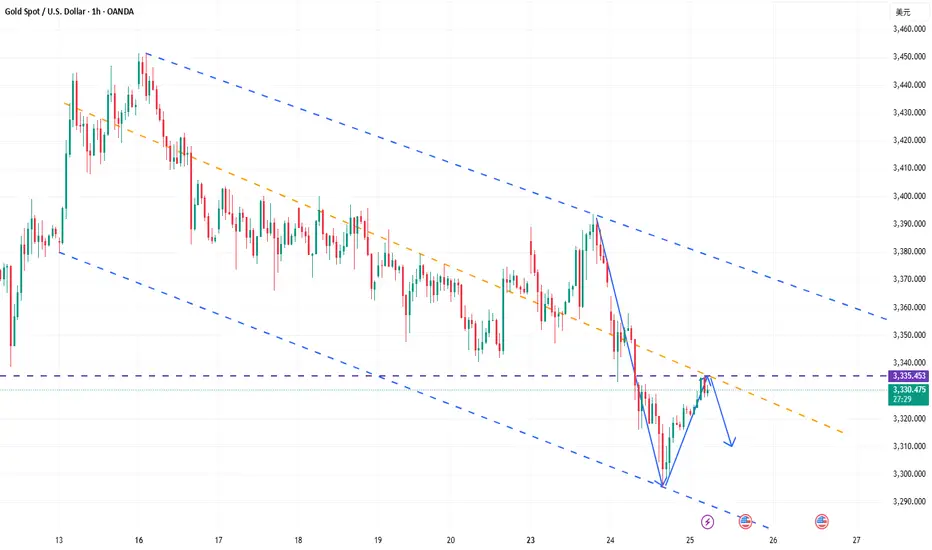
Gold fluctuates upward. Trend change?Yesterday, the gold daily line closed with a middle-yin candlestick with a lower shadow. The closing price has lost the middle and lower rail positions one after another, and the short-term downward pressure adjustment will continue.
The hourly level shows a bottoming out and rebound, and it rose in the early Asian session, breaking through the pressure resistance of 3328-3332 in the European and US sessions yesterday, but it did not continue the rebound and fell into a narrow range. At present, there is still great resistance above 3340, and it has failed to break through after many attempts, but the hourly line track has not been completely lost.
Pay attention to the 3315 support for long positions, and pay attention to the 3340-3355 short position range for upward movement. For the period of shock, strong support or resistance will inevitably produce inertial puncture behavior, and some errors are normal. We need to pay attention to the market trend at all times and change strategies in time.
Today we need to focus on the response strategies for resistance and support levels, which will determine whether we can achieve profits within the fluctuation range.
Good luck to everyone.
Suppression remains unchanged, the latest layout of gold📰 Impact of news:
1. Powell's testimony
2. Geopolitical impact
📈 Market analysis:
The short-term rebound of gold is the release of energy for the accumulated bulls. From the current market trend, 3340 above is the key point of the short-term watershed between bulls and bears. The short-term resistance above is around 3342-3348, and the short-term support below is around 33220-3315. If it falls below this, it will continue to look towards yesterday's low of 3290-3280. The daily level is under pressure and continues to see a decline and adjustment. If it touches 3340-3350 above, you can try to short. After it retreats to 3320-3315 and obtains effective support, you can consider going long.
🏅 Trading strategies:
SELL 3340-3350
TP 3330-3320-3315
BUY 3320-3315
TP 3330-3340-3350
If you agree with this view, or have a better idea, please leave a message in the comment area. I look forward to hearing different voices.
OANDA:XAUUSD FX:XAUUSD FOREXCOM:XAUUSD FXOPEN:XAUUSD TVC:GOLD
Bulls have made profits, gold layout in the evening📰 Impact of news:
1. Powell's testimony
2. Geopolitical impact
📈 Market analysis:
I have completed the long trade according to the previous trading strategy, and the long order has generated profit. In the short term, the overall trend of gold is still bearish. Only if it breaks through and stabilizes above 3350 can the bulls continue. If it rebounds to the 3330-3335 line and encounters resistance under pressure, you can consider shorting. If it rebounds to 3340-3350 but fails to stabilize, you can increase your short position. Pay attention to the support of 3320-3300 below. If it falls below 3300, it is expected to reach 3280
🏅 Trading strategies:
SELL 3330-3335-3340-3350
TP 3320-3310-3300-3280
If you agree with this view, or have a better idea, please leave a message in the comment area. I look forward to hearing different voices.
OANDA:XAUUSD FX:XAUUSD FOREXCOM:XAUUSD FXOPEN:XAUUSD TVC:GOLD
Gold Rebounds Slightly After Dropping to 3295📊 Market Update:
Gold bounced back to 3320 after dipping to 3295 amid USD strength and rising bond yields. The recovery was fueled by short-covering, but traders remain cautious ahead of upcoming U.S. PCE data – the Fed’s preferred inflation gauge.
📉 Technical Analysis:
• Key Resistance: 3330
• Nearest Support: 3295
• EMA: Price is hovering near the 09 EMA on the H1 chart → neutral to slightly bullish in short-term correction.
• Candle / Volume / Momentum: H1 candles show mild recovery with increased volume, but no clear reversal signal yet.
📌 Outlook:
Gold may range between 3295 and 3330 before a breakout, depending on incoming U.S. economic data. A break above 3330 could trigger a short-term rally.
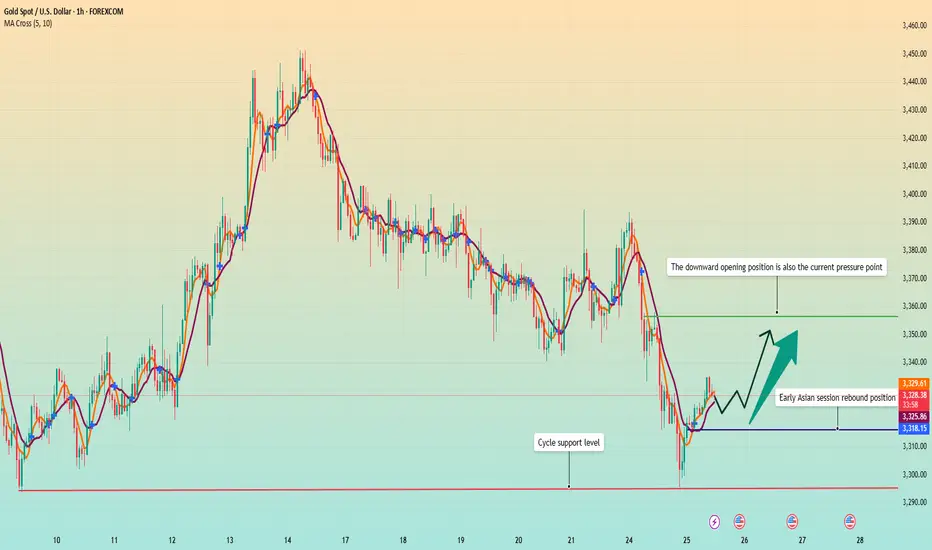
Gold fluctuates sharply, both bulls and bears have opportunities
💡Message Strategy
1. The decline in gold prices is directly due to the cooling of market risk aversion caused by the ceasefire agreement between Israel and Iran. The attractiveness of gold as a safe-haven asset has weakened. The ceasefire agreement is fragile. Israel and Iran have accused each other of default. Trump criticized both sides. Its sustainability is questionable, adding uncertainty to the gold market.
2. Federal Reserve Chairman Powell testified at a congressional hearing on June 24 that it is necessary to observe the impact of tariffs on inflation before cutting interest rates. He is not in a hurry to cut interest rates, which has cooled expectations for a rate cut in July. Gold, as a non-interest-bearing asset, is under pressure under high interest rate expectations. The uncertainty of inflation caused by tariffs also limits the attractiveness of gold as an inflation hedging tool.
3. The U.S. Consumer Confidence Index fell to 93.0 in June. Consumers are worried about employment and economic prospects. Although the one-year inflation expectations have fallen, the expectations for rising interest rates have risen, which has weakened the safe-haven demand for gold. In the long run, gold's anti-inflation and safe-haven properties are still there. Global economic uncertainty and a weaker dollar may rekindle demand for gold. Investors need to pay attention to the Fed's policies and the situation in the Middle East and seize the opportunity to allocate.
📊Technical aspects
1. The weekly level switches space around the 10-day moving average. This week has not yet closed, so there is no final conclusion. You can keep it in mind first.
2. The daily line lost the lifeline support area that has been held for a month. The top and bottom are converted to each other. The lifeline position 3355 becomes the resistance range. However, please note that the pattern is closing, which means that the switching space is not the direction. The opening and volume must be opened to guide the direction.
Note that two points are also contradictory points. One is the lifeline 3355 switching space, and the other is that the pattern further closes and accumulates momentum, waiting for the opening to guide the real direction.
3. Five consecutive negatives in four hours, a drop of more than 100 US dollars from 3396 to 3295, and then began to rebound from a low position. This is very embarrassing. If it is a trend, there will be no consecutive positives. action, and will not linger for so long
Then there is only one explanation left, or sweep, pay attention to the lifeline position 3350, the double-line upper rail position 3364, together become the pressure line position of the partial sweep method
There can be a rise in leverage, but it cannot be a breakthrough of continuous rise or steady rise, otherwise the nature will change again
4. The double lines of the hourly chart are close and superimposed in the 3350-3355 area, which coincides with the four-hour lifeline. At the same time, this is also the last rebound to determine the resistance area yesterday afternoon, so as to change the nature
5. The large channel cooperates with the small channel interval. After breaking through yesterday, it further fell in volume. Now the position along the large channel is in the 3340 area. This will be the acceleration point today. Breaking through accelerates the rise, and breaking through accelerates the fall
💰Strategy Package
Short Position:3345-3355,SL:3365,Target: 3300-3290
Long Position:3280-3290,SL:3265,Target: 3340
Gold - This is the official top!Gold - TVC:GOLD - might top out soon:
(click chart above to see the in depth analysis👆🏻)
Since Gold confirmed its rounding bottom in 2019 it rallied more than +200%. Especially the recent push higher has been quite aggressive, squeezing all bears. But now Gold is somehow unable to create new all time highs, which could constitute the a top formation.
Levels to watch: $3.500, $3.000
Keep your long term vision🙏🙏
Philip (BasicTrading)

GOLD/XAUUSD SellGold price is still bearish in the short term. The US dollar is currently being boosted. There are also geopolitical talks and indirect ceasefires. Therefore, the short-term risk aversion sentiment has declined. The gold price is now quoted at: 3323. We can focus on the lower target of 3300-3290.
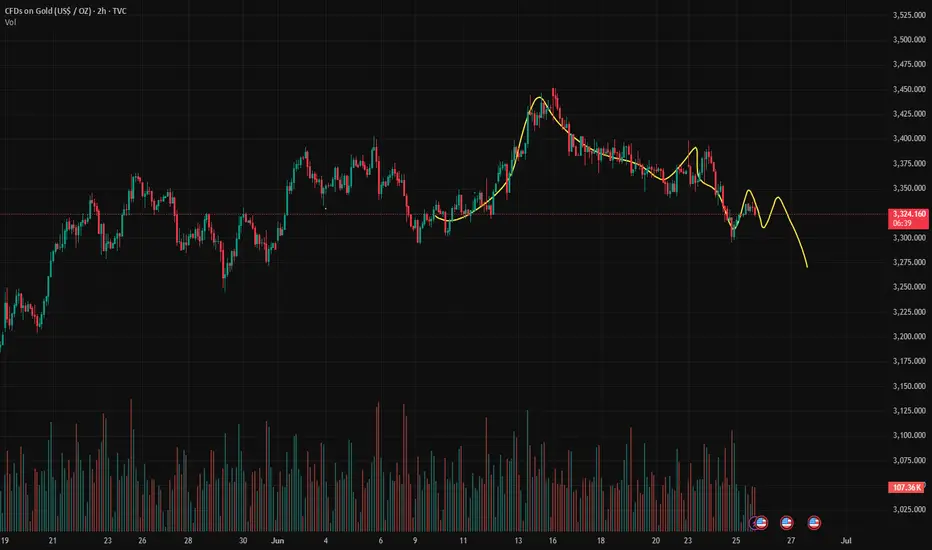
Gold fluctuates, 3300 may fall below.Gold fell to 3333 on Tuesday and then rose to around 3358, then began to fall slowly due to resistance, continued to fall in the European session, and fell to around 3295 in the US session, and rebounded in the late trading, rebounding to around 3325, and the daily line closed with a negative line with a lower shadow.
In addition, Israel and Iran both accused each other of violating the agreement, which brought uncertainty to the gold market.
After the sharp drop in gold last week, except for the correction of the cross positive line on Tuesday last week, the daily level has closed five consecutive negative lines since last Wednesday until now, fully demonstrating that the gold price has shown a weak feature of fluctuating downward in recent transactions.
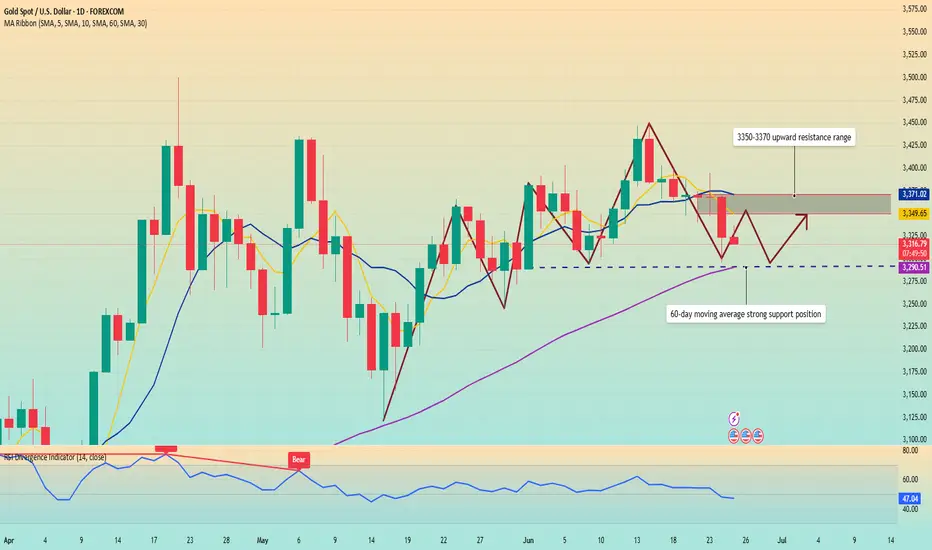
From the technical indicators, the 5-day moving average and the 10-day moving average cross downward, which indicates an important signal that the market trend is weakening in the short term. The current gold price continues to run below the moving average, further verifying the current market situation where shorts dominate.
In terms of resistance, the 5-day moving average is currently around 3350, and the 10-day moving average is around 3370. These two price levels constitute the key resistance range in the upward process of gold prices. As long as the gold price fails to effectively break through this resistance band, it is likely to continue to be weak in the short term. At the support level, pay attention to the 60-day moving average around 3290.
Operation strategy:
Short gold rebounds around 3350, stop loss 3360, profit range 3320-3310.
Go long gold falls back to around 3295, stop loss 3285, profit range 3330-3340.
The market conditions are often not what we ideally want. This is the market, and it is also a form of trading practice.
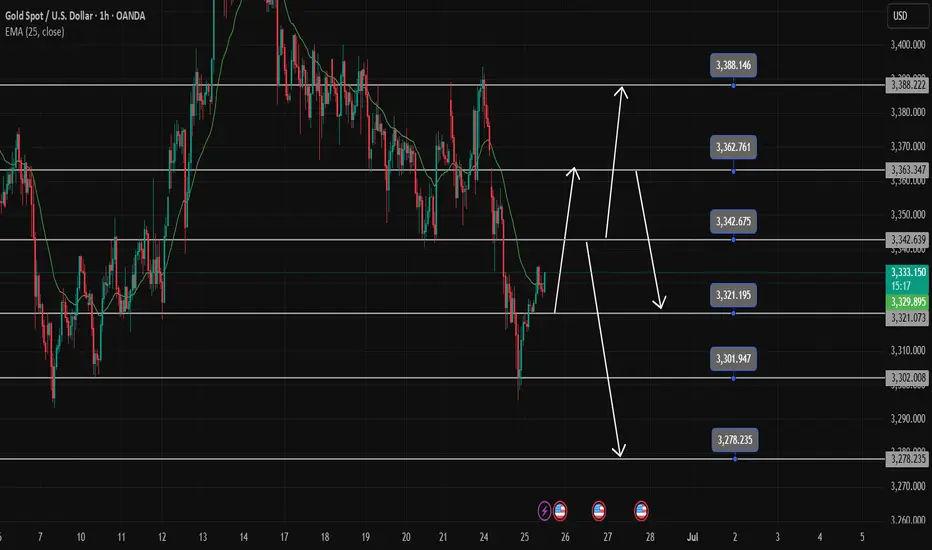
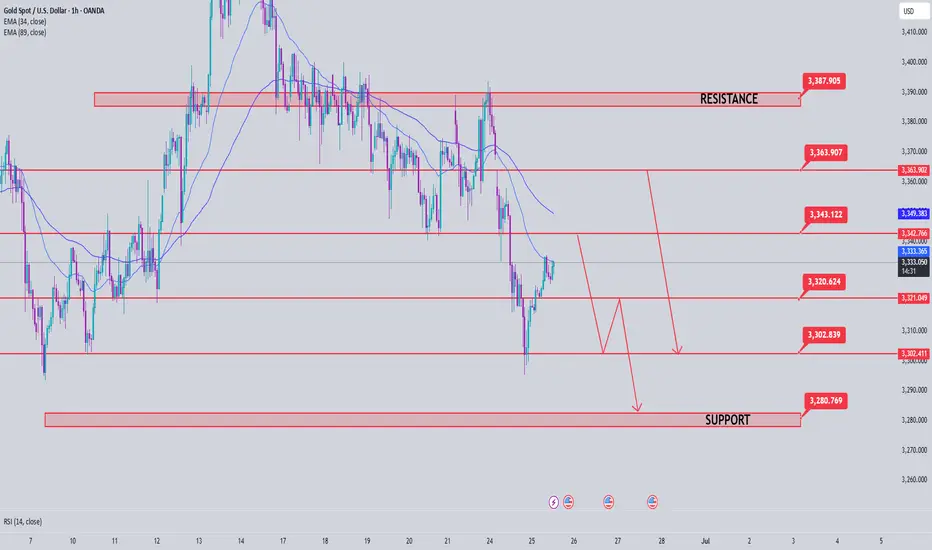
Gold Trading Strategy June 25The Daily Candle shows a strong selling force breaking out of the 3-day accumulation zone. Gold touches the support zone of 3296 and bounces back as analyzed yesterday. Today, it is difficult for the bullish force to return, there is a possibility of an increase in the Asian session and the European session, and the US session will return with the Selling force.
The recovery from 3296 towards 3342, some selling force may appear around 3342, forming a strong bearish structure. The bearish wave structure will weaken if it breaks 3342. The 3363 area still has a reaction but the bearish wave structure is no longer strong.
The market closed above 3363 confirming the downtrend break and heading towards the resistance zone of 3388. The bottom support of 3302 will help to temporarily stop the price decline before heading towards the target of 3278.
Support: 3321-3302-3278
Resistance: 3342-3363-3388
Break out: 3342-3322
Recommended trading signal
BUY GOLD 3302-3300 SL 3297
SELL GOLD 3363-3365 SL 3369
Gold Price Analysis June 25The Daily Candle shows a strong selling force breaking out of the 3-day accumulation zone. Gold hits the support zone of 3296 and bounces towards the resistance zone of 3342. Today, there is unlikely to be a rebound, there is a possibility of an increase in the Asian session and the European session, and the US session will return to the Selling force.
The recovery from 3296 towards 3342, some selling force may appear around 3342, forming a strong bearish structure. The Bearish Wave Structure will weaken if it breaks 3342. The 3363 area is still noteworthy for SELL signals.
The market closed above 3363, confirming the break of the downtrend and heading towards the resistance zone of 3388. The bottom support of 3302 will help prevent a temporary decline before heading towards the target of 3278.
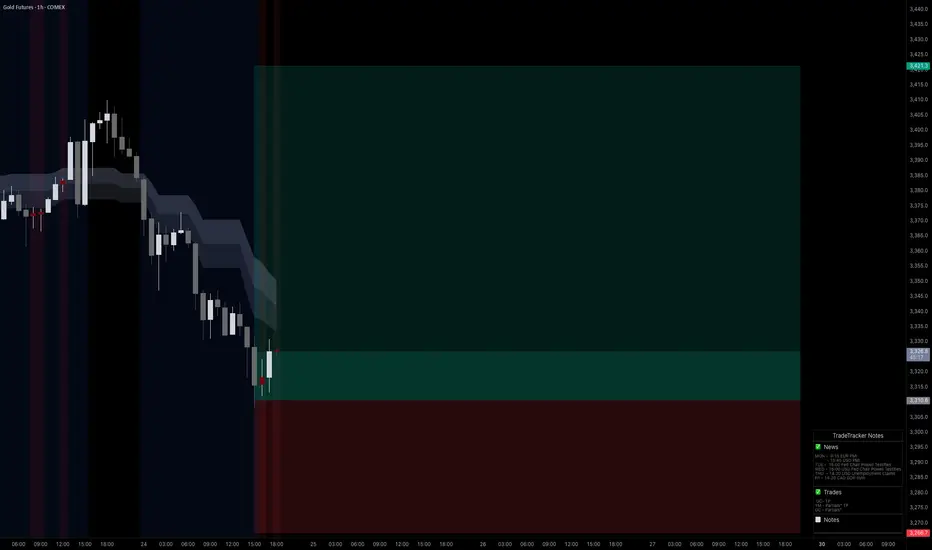
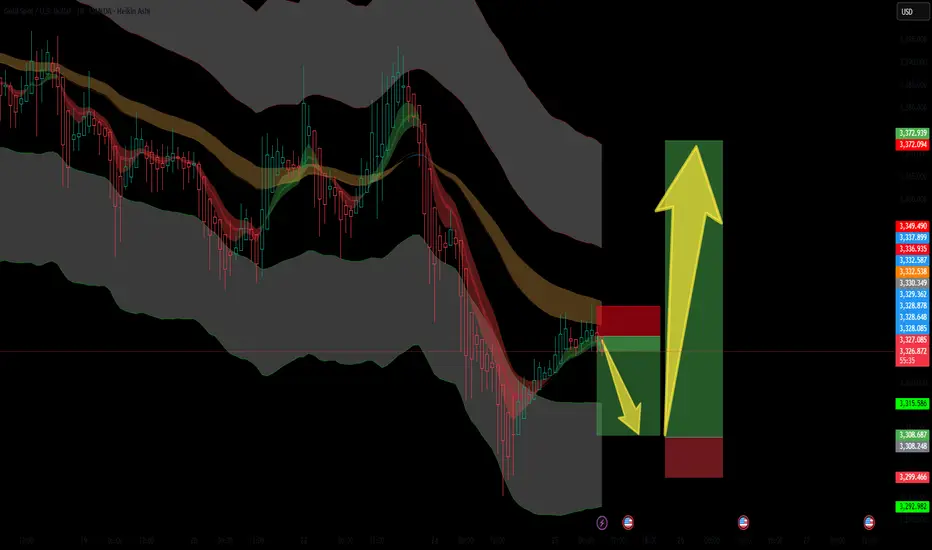
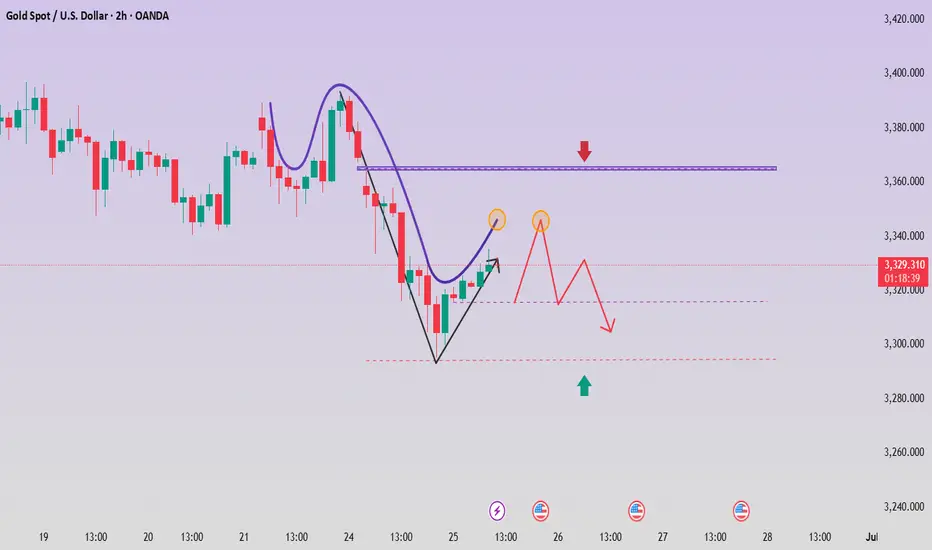
Pullback Before Bullish ContinuationGold is currently facing resistance near the mid-Keltner Channel zone. Based on current structure and momentum, we anticipate a two-phase move:
🔻 Phase 1 – Short-Term Pullback:
Price is likely to reject the current resistance and move lower into the demand zone around 3310–3315. This retracement aligns with a healthy correction within a larger structure.
🟢 Phase 2 – Bullish Reversal:
After the pullback, we expect a strong bullish continuation toward the 3370–3373 area. This level represents the next significant resistance and profit target for long positions.
📌 Key Zones to Watch:
Demand Support: 3310–3315
Bullish Target: 3370–3373
Stop-Loss for Longs: Below 3308
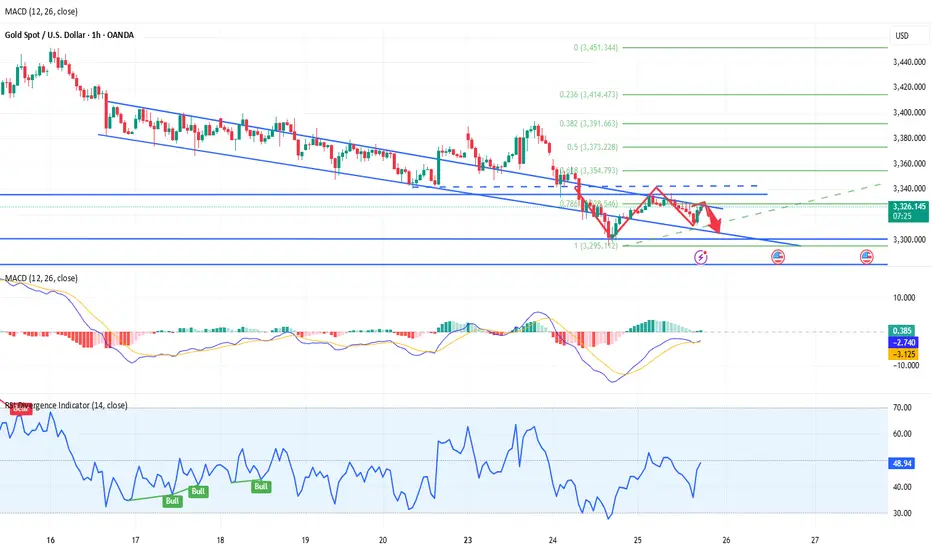
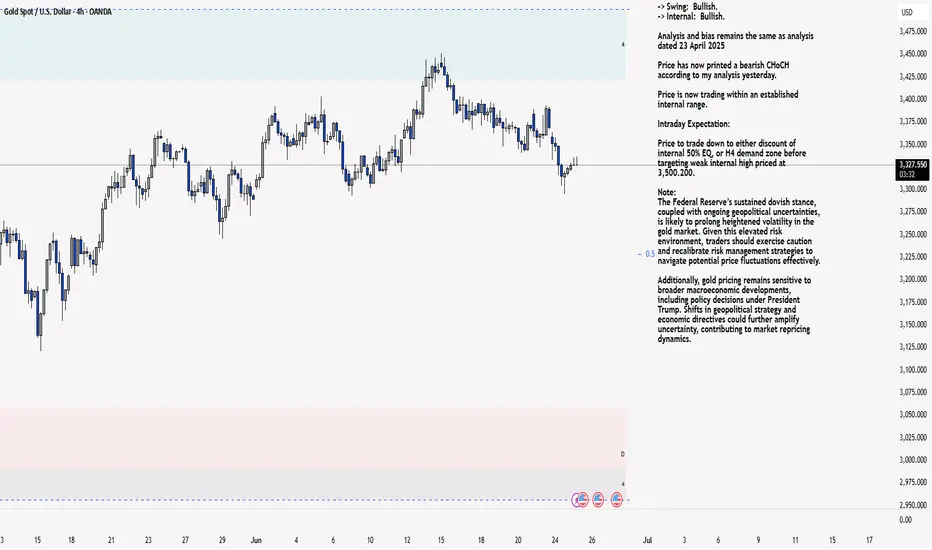
XAU/USD 25 June 2025 Intraday AnalysisH4 Analysis:
-> Swing: Bullish.
-> Internal: Bullish.
Analysis and bias remains the same as analysis dated 23 April 2025
Price has now printed a bearish CHoCH according to my analysis yesterday.
Price is now trading within an established internal range.
Intraday Expectation:
Price to trade down to either discount of internal 50% EQ, or H4 demand zone before targeting weak internal high priced at 3,500.200.
Note:
The Federal Reserve’s sustained dovish stance, coupled with ongoing geopolitical uncertainties, is likely to prolong heightened volatility in the gold market. Given this elevated risk environment, traders should exercise caution and recalibrate risk management strategies to navigate potential price fluctuations effectively.
Additionally, gold pricing remains sensitive to broader macroeconomic developments, including policy decisions under President Trump. Shifts in geopolitical strategy and economic directives could further amplify uncertainty, contributing to market repricing dynamics.
H4 Chart:
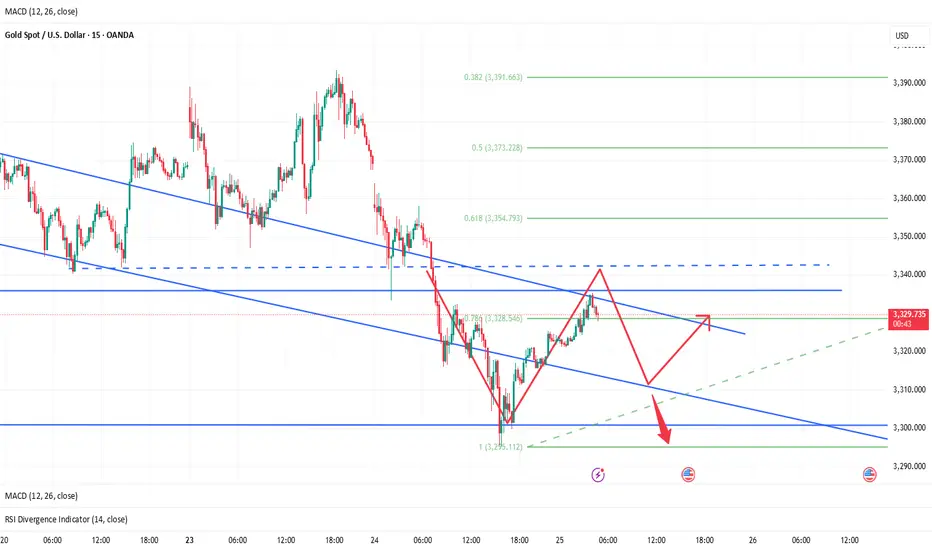
M15 Analysis:
-> Swing: Bullish.
-> Internal: Bullish.
Following previous high, and printing of bearish CHoCH, price has pulled back to an M15 supply zone, where we are currently seeing a reaction. Therefore, I shall now confirm internal high.
Price is now trading within an established internal range.
The remainder of my analysis shall remain the same as analysis dated 13 June 2025, apart from target price.
As per my analysis dated 22 May 2025 whereby I mentioned price can be seen to be reacting at discount of 50% EQ on H4 timeframe, therefore, it is a viable alternative that price could potentially print a bullish iBOS on M15 timeframe despite internal structure being bearish.
Price has printed a bullish iBOS followed by a bearish CHoCH, which indicates, but does not confirm, bearish pullback phase initiation. I will however continue to monitor, with respect to depth of pullback.
Intraday Expectation:
Price to continue bearish, react at either M15 supply zone, or discount of 50% internal EQ before targeting weak internal high priced at 3,451.375.
Note:
Gold remains highly volatile amid the Federal Reserve's continued dovish stance, persistent and escalating geopolitical uncertainties. Traders should implement robust risk management strategies and remain vigilant, as price swings may become more pronounced in this elevated volatility environment.
Additionally, President Trump’s recent tariff announcements are expected to further amplify market turbulence, potentially triggering sharp price fluctuations and whipsaws.
M15 Chart:
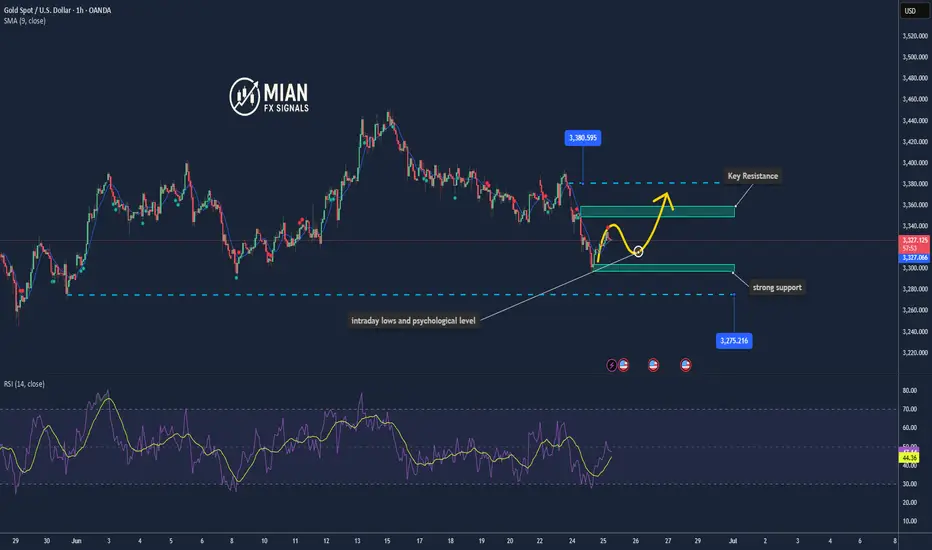
Gold May Dip Short-Term Amid Cautious Fed & Geopolitical Calm📊 Market Overview:
• Gold saw a slight correction as Middle East tensions eased following a ceasefire agreement between Iran and Israel.
• A weaker USD and lower U.S. Treasury yields offered some support to gold prices.
• However, the Fed’s cautious stance on rate cuts and upcoming testimony from Chair Powell continue to weigh on gold sentiment.
📉 Technical Analysis:
• Key Resistance Levels:
– $3,350–3,360 (21/50-day SMAs)
– $3,370–3,385 (Fibonacci zone and swing highs)
• Nearest Support Levels:
– $3,316–3,320 (intraday lows and psychological level)
– $3,300–3,305 (strong support), followed by $3,245–3,275 if broken
• EMA 09: Price is currently trading below the 09 EMA, indicating a short-term downtrend.
• Candlestick Pattern / Volume / Momentum:
– The 15-minute chart shows slight recovery signals, but with weak momentum; RSI is below average and MACD is slightly bearish.
– No strong reversal candlestick pattern detected; small-bodied candles (doji) suggest indecision and selling pressure remains near $3,340.
📌 Outlook:
Gold may decline slightly in the short term, potentially retesting the $3,316–3,320 support zone. A rebound is possible if the USD weakens further or the Fed unexpectedly signals rate cuts.
💡 Suggested Trading Plan:
🔻 SELL XAU/USD at: $3,335–3,340
🎯 TP: $3,330 - $3,325
❌ SL: $3,345
🔺 BUY XAU/USD at: $3,318 – 3,315
🎯 TP: $3,320 - $3,325
❌ SL: $3,312
The current price of gold is 3330-3335, go short directly!Gold rebounded after hitting the bottom of 3295. At present, gold is just a rebound, not enough to reverse directly. Gold rebounds and continues to be short. After all, the daily line has fallen continuously, so the short momentum of gold is still there. In the short term, the rebound of gold is just a repair after oversold. Gold is currently priced at 3330-3335 and is directly short.
The 1-hour moving average of gold continues to be arranged in a short position downward. After gold fell below the previous low of 3340 yesterday, gold has not been able to rebound again. In the short term, 3340 has become the key to long and short positions. In the short term, gold rebounds below 3340 and continues to be shorted. If gold breaks through and stabilizes at 3340 again, then gold may start to fluctuate again. Before breaking through 3340, gold is still weak and continues to maintain a short trend.
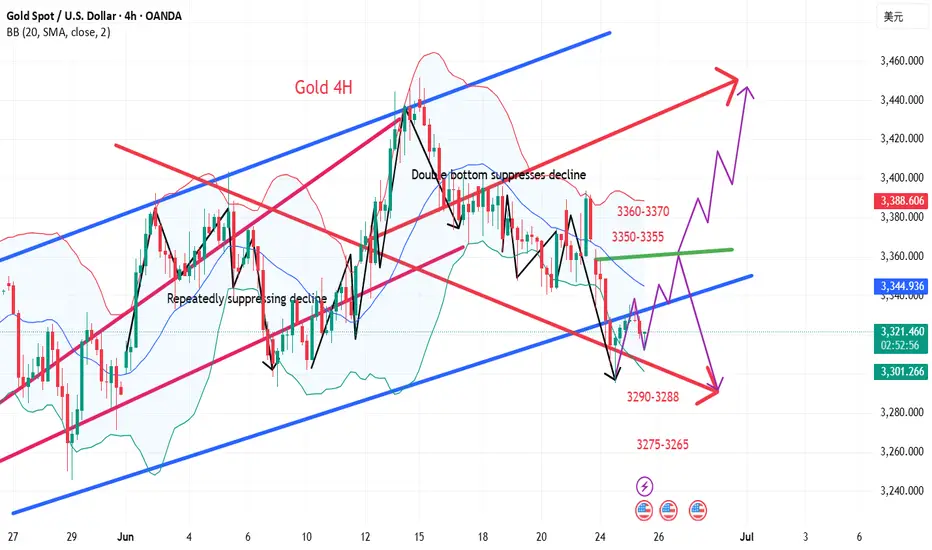
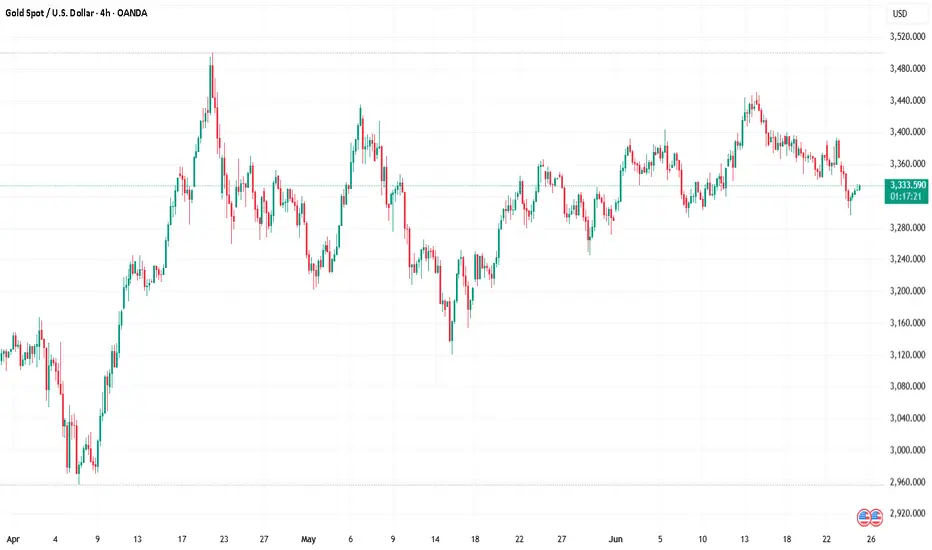
4‑Hour Analysis – Supply & Demand Overview 25 June 20251. Market Structure
XAU/USD currently trades at 3333 and shows clear higher highs and higher lows on the 4‑hour timeframe—reflecting a bullish structure backed by recent swing lows above 3300 and highs nearing 3365
2. Key Demand Zones
DZ1: 3320–3330 – Consolidation region with multiple wicks and price rejections; confirmed buying volume (aligned with ML and 50‑EMA confluence)
DZ2: 3300–3310 – A deeper base with strong reversal history; aligns with psychological round number and 0.382 Fib of recent up-swing
3. Key Supply Zones
SZ1: 3350–3360 – Upper resistance cluster formed by repeated spikes and quick rejections; overlapping 0.5–0.618 Fib from the last retracement
SZ2: 3380–3400 – Broader distribution area with past failed breakouts; significant liquidity shelf noted
4. Why These Zones Matter
Demand zones act as value entry areas where institutional and retail buyers absorb selling pressure, usually followed by swift reversals.
Supply zones represent distribution pockets where buy orders face strong pushback, often leading to corrective moves.
5. Bias
✅ Overall Bias – Bullish (4‑hour) thanks to structural trend (HH/HL), price above key previews like 50‑EMA & 20‑EMA, and consistent demand responses. Only a break below 3320 invalidates bullish tilt.
⚡ 1‑Hour Intraday Setups (Aligned with Bullish 4H Bias)
Buy the Dip (Main Entry)
Zone: 3320–3325
Context: Retest of DZ1, tagging the 4H structure and 1H ascending trendline.
Confirmation: Bullish pin bar or long tail candle + volume surge.
Channel Retest Quick‑Entry
Zone: 3330–3335
Context: Price remediates after a clean breakout above the 1‑hour descending channel.
Confirmation: Trendline bounce or bullish engulfing on the first test.
Supply‑Fade (Aggressive)
Zone: 3350–3355
Context: Approach to SZ1—plays the bearish reaction in a bull market context.
Confirmation: Bearish pin bar, upper wick exhaustion, and slim 1H RSI divergence.
📈 Chart Snapshot & Confluences
DZ1 (3320–3330) aligns with the 0.382 Fib and ascending 1‑hour trendline.
Quick-entry zone (3330–3335) sits close to the 1‑hour 50‑EMA, offering dynamic multi‑timeframe confluence.
SZ1 aligns with higher-term fib and previous supply peaks.
📝 Ready Summary
XAU/USD – 4H Structure: Bullish – higher highs & higher lows.
Major Demand Zones: 3320–3330 (primary), 3300–3310 (secondary).
Major Supply Zones: 3350–3360 (hot zone), 3380–3400 (upper resistance).
Bias: Bullish as long as price holds above 3320.
Intraday Trade Zones:
Buy the Dip: 3320–3325 – look for pin‑bar/volume bounce.
Quick Re‑Entry: 3330–3335 – trendline or 50‑EMA test confirmation.
Supply Fade (Aggressive): 3350–3355 – bearish rejection setup.
Pro Tip: Focus on clean price action signals (wicks, engulfings, volume) within entry zones and confirm with multi‑timeframe confluences (Fib, EMA, trendlines).
Gold is under pressure. Will the trend change?Information summary:
The easing of tensions in the Middle East is the main reason for the suppression of gold. Risk aversion has weakened, and the market has entered a risk-taking mode. Gold prices are well supported near $3,300.
Powell released an important signal: The market expected Powell to strongly refute the possibility of a rate cut, but he remained on the sidelines. The market still generally believes that the July 29-30 meeting is unlikely to initiate a rate cut, and the first rate cut is expected to be in September.
Market analysis:
Gold has fallen for seven consecutive weeks, which has changed the current bull structure in stages, so there is no doubt that gold is expected to fall back as a whole. The early decline was near 3355, which is the current long-short watershed of gold. As long as the adjustment does not break through the 3355 position, the overall short-term adjustment pattern of gold will not change.
The early Asian market did not continue to retreat, but the short-term rebound had a long buying force accumulation, but as long as it did not break through 3355, the market trend was still weak, and it was adjusted by low-level shock correction. Today, there is a high probability of movement around the falling range. The short-term support below is around 3290. If this position is lost, it may touch the turning point around 3275.
Operation strategy:
Go long when the price falls back to around 3315, stop loss at 3305, and profit range 3345-3350.
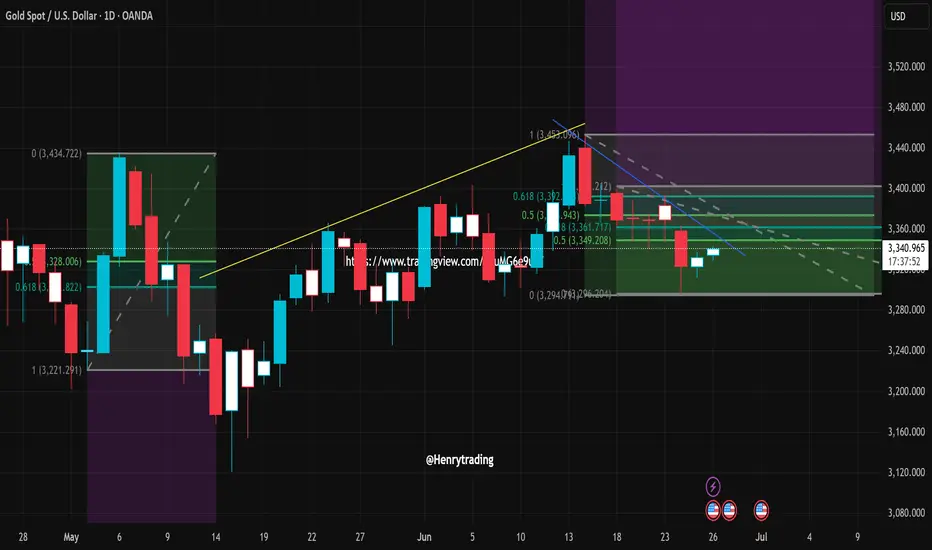
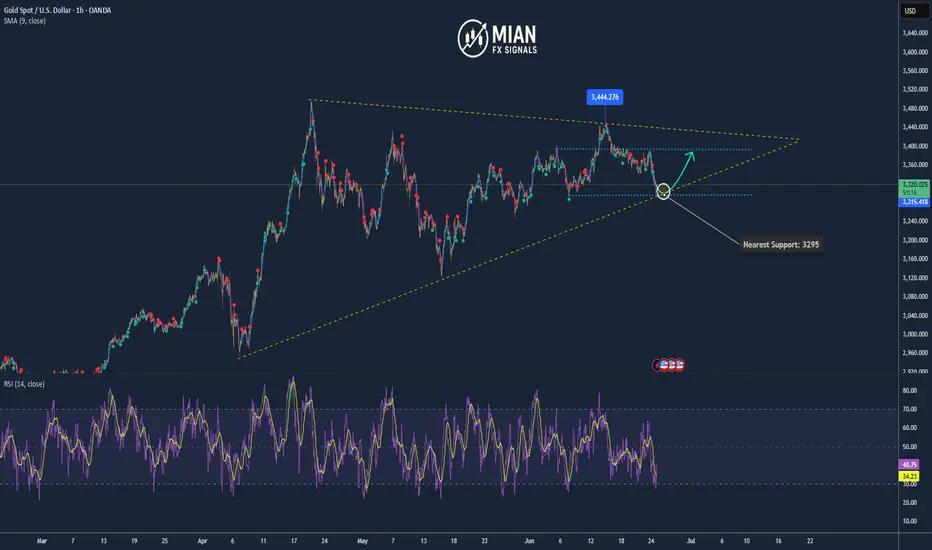
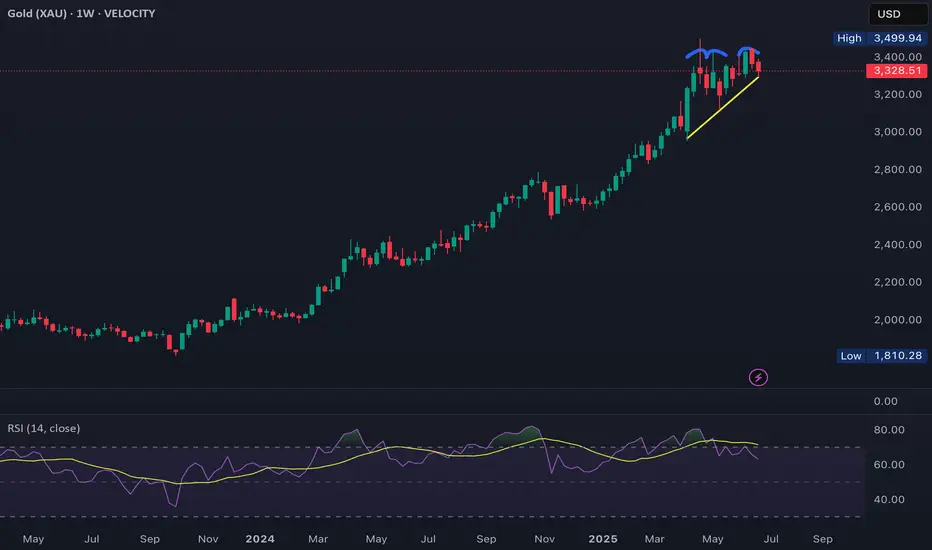
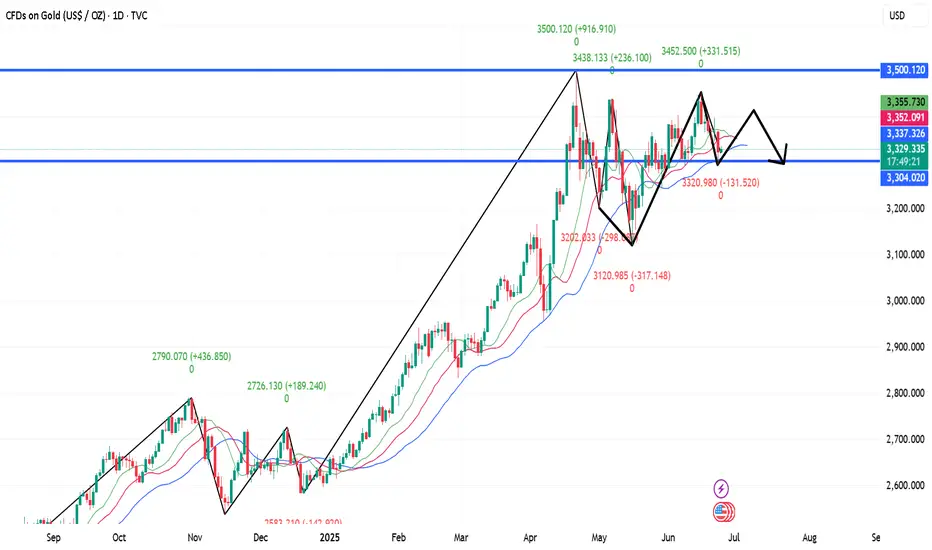
Gold Forming Triple Top – Correction Ahead?Gold is currently showing a triple top pattern while holding at a key trendline support.
With geopolitical tensions easing, US inflation cooling off, and a potential Fed rate cut on the horizon, gold may be set for a correction.
A drop toward the $2,900/oz zone looks likely — this will be a critical support level. A break below it could trigger a long-term downtrend.
Gold today high-altitude low-multiple operation
📌 Gold news
On Tuesday, the spot gold price plummeted, hitting a two-week low. The main reason was that Iran and Israel announced a ceasefire, which suppressed the demand for safe-haven gold. In addition, Fed Chairman Powell made hawkish remarks, which also hit the gold price trend. Short-term long-short game will focus on the PCE inflation data to be released by the United States. If the economic data performs poorly or inflation continues to fall, it may still provide a medium-term rebound opportunity for gold.
📊Comment analysis
Yesterday, gold was weak overall, and the decline and rebound were limited. It fell directly from around 3357 to 3295, and then rebounded according to the news. It ran around 3326 in the morning. From a technical point of view, the daily low trend line support is around 3290, the 4-hour long lower shadow line bottomed out, and three consecutive positive rebounds, the daily line supports the lower track of the Bollinger band, and the Bollinger band tends to be parallel. There is no sign of opening downward, so the short-term decline of gold prices is limited. Consider paying attention to the support of 3294 during the day, and mainly use this position for defense and low long. Pay attention to the important suppression of the middle track 3363 above, and mainly short.
💰Strategy Package
Focus on the support near 3316-3317 in the short term, rely on this position to go long, stop loss 3307, take profit near 3345, and break 3363. If it falls strongly below 3294, then don't consider going long during the day.
Gold operation strategy: long near 3316, stop loss 3307. Take profit 3345
⭐️ Note: Labaron is not 100% correct here, only a steady operation idea, large warehouse for trend, small warehouse for wave, control the proportion by yourself, there is no unprofitable investment, only unsuccessful orders, whether to make money depends on the timing of buying up and buying down, making money depends on opportunities, investment depends on wisdom, and financial management depends on professionalism.
The latest analysis of gold trend on June 25From the perspective of technical analysis, based on the daily level, the gold price is expected to be further under pressure in the future. At the daily level, the current focus is on the 3370 area resistance. The 1-hour line shows that the short-term pressure is at the position of the previous upward trend line retracement. Due to the short-term market volatility and decline, it is necessary to temporarily focus on the current downward trend line area resistance, which is also the daily and four-hour resistance area. The 3330-3315-3310 area will be followed below. If the market is in an extremely weak state, the gold price is expected to test the 3330-3270 area. From the indicator signal, the RSI oscillation around 50 shows that the market is balanced between long and short forces, the MACD red column shrinks, and the fast and slow lines flatten, indicating that the bullish momentum is weakened; the KDJ high dead cross shows that the short cycle may be corrected.
Comprehensive technical analysis, today's short-term operation strategy for gold is mainly rebound short selling, supplemented by low long selling. The short-term focus on the upper side is the 3370 - 3380 resistance line, and the short-term focus on the lower side is the 3330 - 3315 support line.
Buying the Dip or Catching a Knife? My Gold Setup Explained.Entered a long position on XAU/USD from the 1H demand zone following sharp intraday selling into a key support level. With gold hovering near $3,300 and a significant testimony from Fed Chair Powell on deck, the setup aligns with both technical rebound potential and fundamental uncertainty that could fuel upside.
The goal here is to play the liquidity vacuum left after aggressive positioning was cleared, with tight invalidation and asymmetric reward.
Technicals:
• Entry aligned with prior price inefficiency and confluence of multiple demand zones
• 1H structure shows clear deviation below the range with immediate buy-side response
• EMA channel flattening, indicating potential compression ahead of expansion
• First target: $3,352
• Risk-managed with defined stop-loss below $3,260
Execution Note: This is not a “hold forever” trade. It’s an opportunistic reaction to unwind + sentiment imbalance.
Fundamentals
• Gold saw a 25% surge in 2024 due to safe-haven demand and dovish policy, but enters 2025 under pressure from:
▫️ A strong USD
▫️ Higher cost of carry
▫️ Speculators taking profit
• Fed policy remains the core variable:
▫️ A hawkish tone from Powell could weigh on price
▫️ Rate cuts would likely revive bullish momentum
• Central bank demand remains supportive
• Geopolitical tensions (Russia-Ukraine, Israel-Iran) could trigger safe-haven bids again.
Bearish headwinds:
• Waning bullish momentum per RSI divergence
• Reduced rate cut expectations post-election
• Powell’s testimony could revive volatility either way.
This is a short-term tactical long, not a macro bet. With sentiment temporarily overextended and key support defended intraday, this is a high R/R window to exploit Powell-related volatility.
Let’s see how price reacts into $3,350+. Any sustained strength there would open room toward $3,400, while failure would confirm a retest of $3,260s.
Note: Please remember to adjust this trade idea according to your individual trading conditions, including position size, broker-specific price variations, and any relevant external factors. Every trader’s situation is unique, so it’s crucial to tailor your approach to your own risk tolerance and market environment.