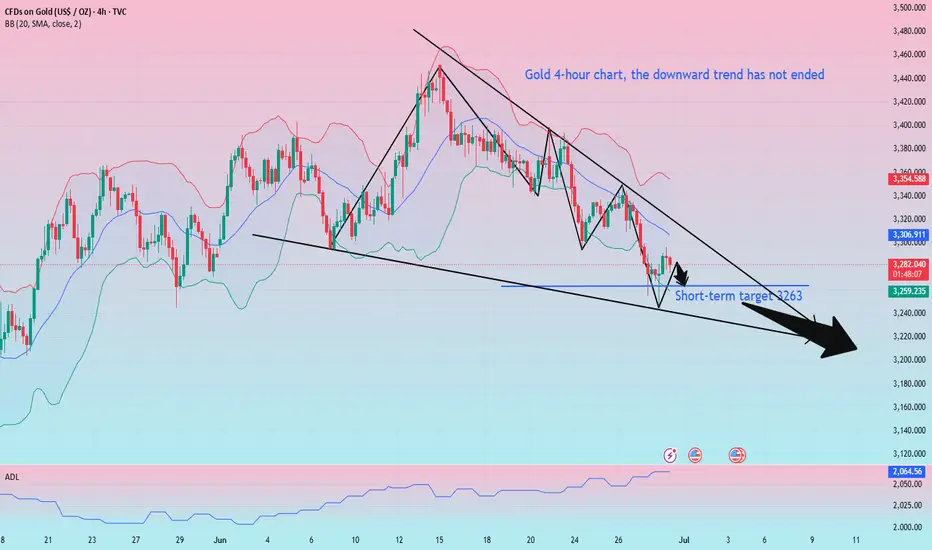
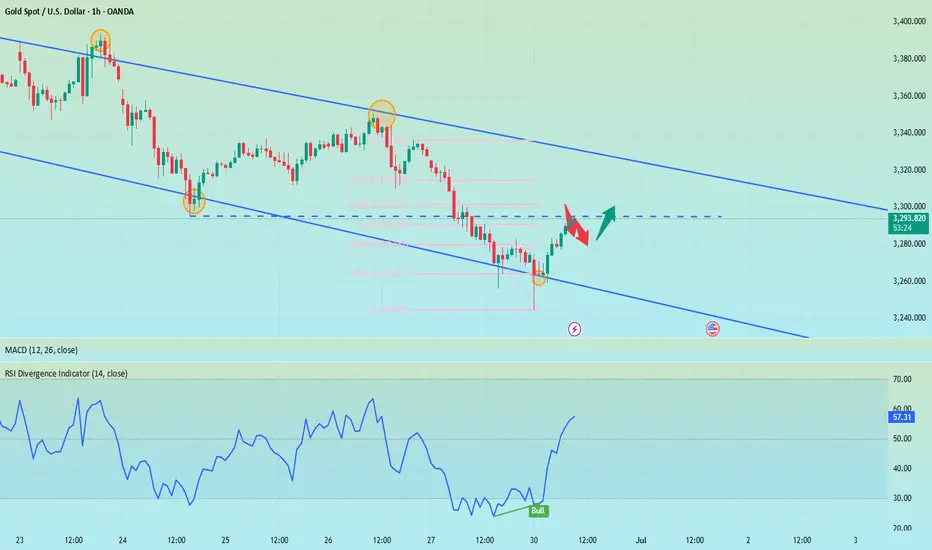
Gold is under pressure at 3296 and may weaken and fall today
I am analyst Yulia, and I always believe that profit is the only criterion for measuring strength. My analysis is never perfunctory, and my trading style is unique. Follow my rhythm, and you will never fail in the annual cycle. Others have already rushed on the road to wealth, but you are still hesitating whether to cross the traffic light at the intersection? Remember, hesitation will lead to failure! Follow my pace, and wealth will be very close to you.
Gold rebounded as I expected during the weekend, but the rebound to 3296 was under pressure. The short-term 60-day moving average and the suppression near the five-day moving average failed to break, so the rebound within the day was limited. It may weaken and fall today, but it belongs to a shock and bearish trend, so consider shorting near 3282-85, stop loss 3291, pay attention to risks.
June 30 gold short-term trading: short near 3283, stop loss 3291, take profit 3263
Goldprice
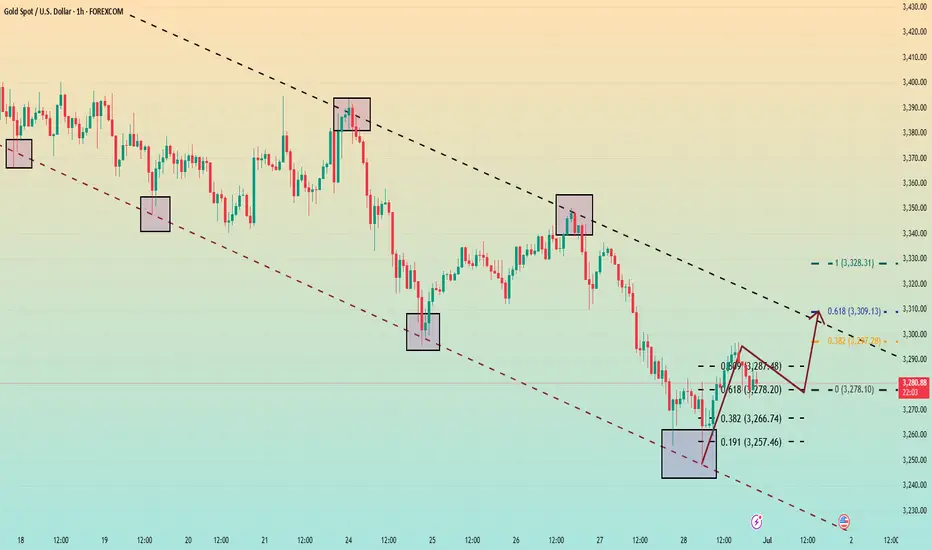
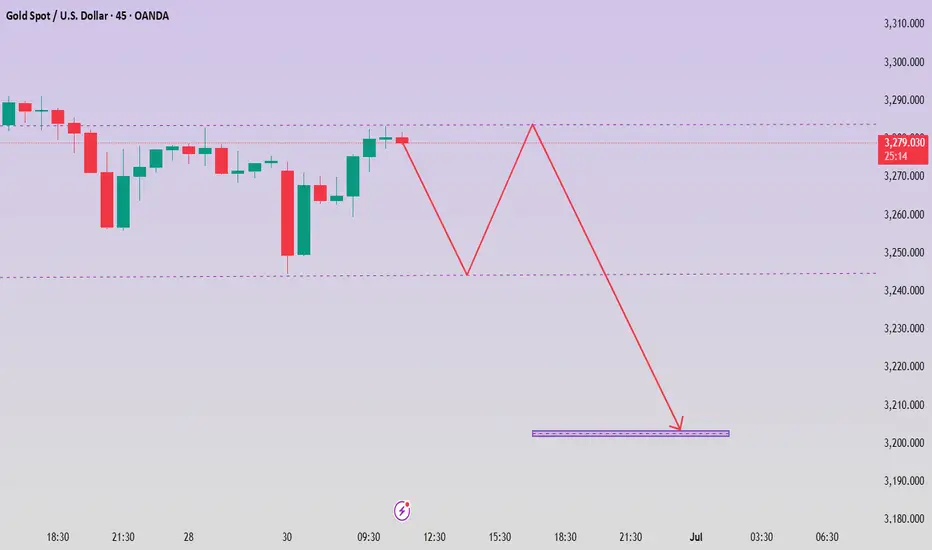
Gold is trading sideways. Has it reached a high point?On the first trading day of this week, after hitting 3247 in the early Asian session, it quickly rebounded to around 3295, and then fell back slightly. It is currently maintained at around 3285.
From the hourly chart, the Fibonacci 0.618 position of this trend from 3247 to 3297 is at 3278. The price has always been above 3278, but it has only fallen below this position in a very short time. If the retracement does not break through the 0.618 position, there is a high probability that there will be a high point in the subsequent trend.
Next, we should focus on the area around 3280. If the price always closes above 3280, then today's high point of 3297 will most likely be refreshed. If the upward trend is opened again, it is very likely to touch around 3310. 3310 is also the current 0.618 position. And it is also the top position of this hourly chart range.
Therefore, we should be cautious when shorting gold above 3280, as there is a high probability that it will reach above 3300.
Aggressive trading can rely on entering the market and going long near 3280, and the profit range is between 3300-3310.
For short strategy trading, Quaid recommends that it is safer to short when the price rebounds near 3310.
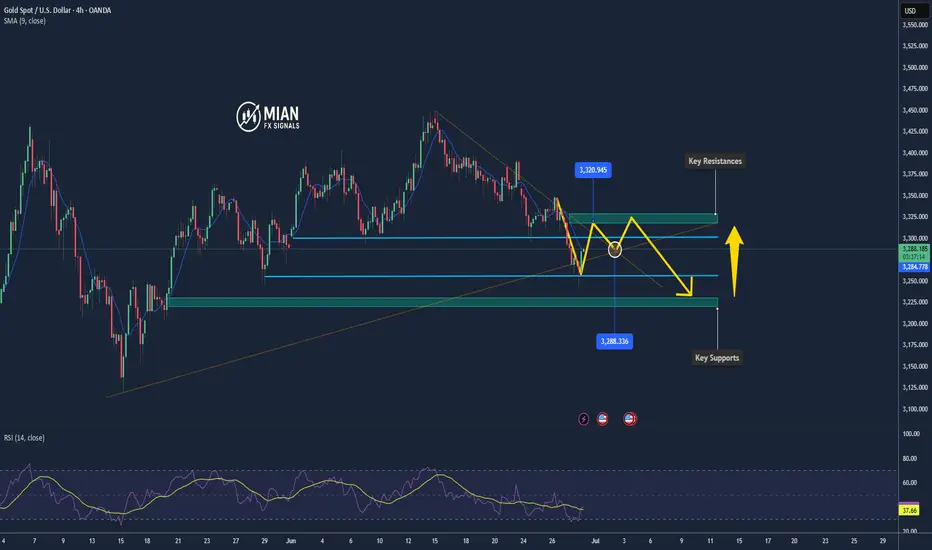
Gold Faces Resistance Near $3,300 Ahead of U.S. Jobs Data📊 Market Highlights:
Gold holds firm above $3,280 supported by expectations of future Fed rate cuts, but upside momentum has stalled as traders await this Friday’s U.S. jobs report. A slight rebound in the U.S. dollar and elevated bond yields are pressuring gold in the short term.
📉 Technical Analysis:
• Key Resistances:
– $3,300 (strong psychological and profit-taking level)
– $3,320 (last week’s high – potential heavy selling zone)
• Key Supports:
– $3,255 (short-term dynamic support – EMA 09)
– $3,230 (major support from previous breakout structure)
• EMA 09: Price remains above the 09 EMA → trend still bullish
• Momentum: The bullish momentum is weakening. A shooting star candle near $3,300 and RSI approaching overbought territory (>70) suggest a possible short-term correction.
📌 Outlook:
Gold may retreat to $3,255 or lower if it fails to break above the $3,300–$3,320 resistance zone. However, the overall bullish trend remains intact as long as price holds above $3,230.
💡 Suggested Trade Setup:
🔻 SELL XAU/USD at: $3,295 – $3,300
🎯 TP: 40/80/200 pips
❌ SL: $3,305
🔺 BUY XAU/USD at: $3,255 – $3,260
🎯 TP: 40/80/200 pips
❌ SL: $3,245
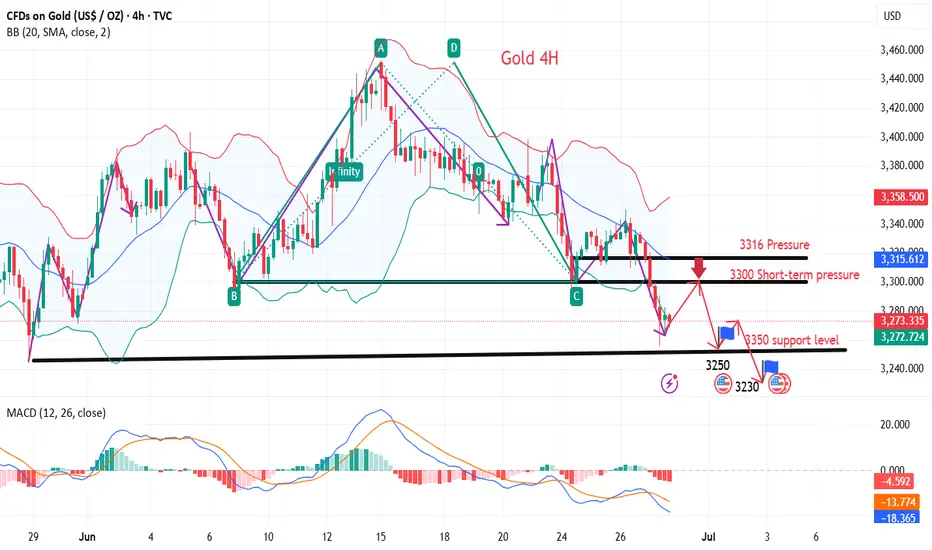
6.30 Safe haven disappears, gold loses its luster!Gold did not break through the upper pressure at midnight last Friday. Gold fell directly after opening in the morning on Friday. The bears broke through the previous 3295 support line, and the lowest reached 3255 in the evening. It closed at around 3274, and the daily line also closed in the form of a big Yin line.
From the 4-hour analysis, the upper short-term resistance focuses on the 3295-3301 line, and the 3316 line is focused on. In terms of operation, it is still rebounding and continuing to be short and follow the trend to fall. The short-term support below focuses on the 3250-3255 line. The overall high-altitude participation tone remains unchanged relying on this range. I will remind you of the specific operation strategy during the session, and pay attention to it in time.
Gold operation strategy:
1. Short gold rebounds at the 3295-3301 line, and short gold rebounds at the 3314-16 line, stop loss at 3326, target 3255-3260 line, and continue to hold if it breaks;

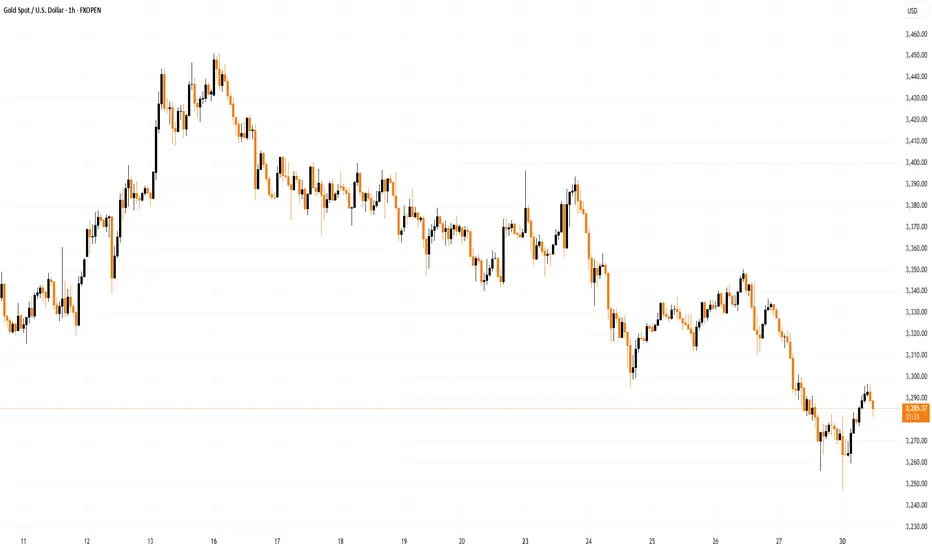
XAU/USD Chart Analysis: Price Retreats to Monthly LowXAU/USD Chart Analysis: Price Retreats to Monthly Low
In mid-June 2025, demand for gold surged following reports of exchanged strikes between Israel and Iran, along with US bombings of Iran's nuclear facilities. As a so-called safe-haven asset, gold prices climbed towards $3,430.
However, by the final day of June, the XAU/USD chart shows that gold had retreated to around $3,250, marking the lowest level in a month.
Why Is the Gold Price Falling?
On one hand, this reflects easing tensions in the Middle East, as a ceasefire—albeit fragile—between Israel and Iran remains in place.
On the other hand, the risk of trade wars is also diminishing. According to media reports:
→ President Donald Trump announced last week that the United States had signed a trade agreement with China and hinted that a “very major” deal with India would follow soon.
→ The US is also close to concluding agreements with Mexico and Vietnam, while negotiations with Japan and many other countries are ongoing.
Technical Analysis of the XAU/USD Chart
Looking at the broader picture, it is worth noting that gold prices in 2025 continue to move within a long-term upward channel (shown in blue), with the following key observations:
→ The channel’s median line acted as resistance (indicated by arrow 1);
→ The line dividing the lower half of the channel in half also showed signs of resistance (indicated by arrow 2).
Now, gold is trading near the lower boundary of the channel – a key support level within the multi-month uptrend. Demand may begin to strengthen here, with long lower wicks on candles on the lower timeframes supporting this view.
A rebound from the lower boundary is possible in early July, but how strong might it be? Note that bears have taken control of the $3,345 level (which has now flipped from support to resistance), and there are signs of a triple top pattern (A-B-C) forming near the $3,430 resistance. This raises the risk of a bearish breakout from the ascending channel.
This article represents the opinion of the Companies operating under the FXOpen brand only. It is not to be construed as an offer, solicitation, or recommendation with respect to products and services provided by the Companies operating under the FXOpen brand, nor is it to be considered financial advice.

Market Analysis: Gold Drops — Traders Eye Macro TriggersMarket Analysis: Gold Drops — Traders Eye Macro Triggers
Gold price started a fresh decline below $3,320.
Important Takeaways for Gold Oil Price Analysis Today
- Gold price climbed higher toward the $3,400 zone before there was a sharp decline against the US Dollar.
- A key bearish trend line is forming with resistance near $3,300 on the hourly chart of gold at FXOpen.
Technical Analysis of Gold Price
On the hourly chart of Gold at FXOpen, the price climbed above the $3,320 resistance. The price even spiked above $3,350 before the bears appeared.
A high was formed near $3,395 before there was a fresh decline. There was a move below the $3,350 support level. The bears even pushed the price below the $3,300 support and the 50-hour simple moving average.
It tested the $3,245 zone. A low is formed near $3,247 and the price is now showing bearish signs. There was a minor recovery wave toward the 23.6% Fib retracement level of the downward move from the $3,393 swing high to the $3,247 low.
However, the bears are active below $3,300. Immediate resistance is near $3,280. The next major resistance is near the $3,300 zone. There is also a key bearish trend line forming with resistance near $3,300.
The main resistance could be $3,320 or the 50% Fib retracement level, above which the price could test the $3,350 resistance. The next major resistance is $3,395.
An upside break above the $3,395 resistance could send Gold price toward $3,420. Any more gains may perhaps set the pace for an increase toward the $3,450 level.
Initial support on the downside is near the $3,245 level. The first major support is near the $3,220 level. If there is a downside break below the $3,220 support, the price might decline further. In the stated case, the price might drop toward the $3,200 support.
This article represents the opinion of the Companies operating under the FXOpen brand only. It is not to be construed as an offer, solicitation, or recommendation with respect to products and services provided by the Companies operating under the FXOpen brand, nor is it to be considered financial advice.
Analysis and layout of gold trend at the end of the month📰 News information:
1. Gold market liquidity at the end of the month
2. Impact of geopolitical situation
📈 Technical Analysis:
From the beginning of the decline of gold near 3338 on Friday to today's lowest point near 3244, gold has fallen by nearly $94. At present, gold has rebounded as expected. In the short term, I think we have two key areas to pay attention to. The first is the position of 3290-3295, which is a 50% rebound, and the second is the upper top range limit range of 3300-3320. Of course, if it breaks through 3280 and then retreats, it can also be long twice, but the current price rebounds, considering the position of the temporary low long position, there is not much trading opportunity. First look at the key areas given to find opportunities for shorting, and pay attention to the opportunity of retreating to 3280-3270 below.
🎯 Trading Points:
SELL 3290-3295
TP 3380-3370
SELL 3300-3310-3320
TP 3290-3280-3270
BUY 3270-3260
TP 3290-3300
In addition to investment, life also includes poetry, distant places, and Allen. Facing the market is actually facing yourself, correcting your shortcomings, confronting your mistakes, and strictly disciplining yourself. I hope my analysis can help you🌐.
OANDA:XAUUSD FOREXCOM:XAUUSD FX:XAUUSD PEPPERSTONE:XAUUSD FXOPEN:XAUUSD TVC:GOLD
6.30 Four-hour resistance determines the strength of the reboundAt the weekly level, the short-term focus is on the adjustment and continued breaking of the weekly support. As time goes by, the weekly support is at the 3285 watershed. At the daily level, after the price broke the daily support last week, the price continued to rely on the daily resistance to bear pressure. At present, the daily resistance is at the 3355 area resistance. Below this position, gold can continue to be shorted. At the four-hour level, the four-hour key position is the key to our emphasis on short-term trends. At present, the four-hour watershed is in the 3300 area, so the focus is on the gains and losses of this position. Before it breaks up, the short-term focus will be on the pressure first, but once it breaks up, it will need to focus on the rebound to the daily resistance. From the one-hour perspective, the bottom rebounded during the early morning session and broke through the high point of the previous trading day’s early morning retracement, so the short-term is still in adjustment. Temporarily pay attention to the gains and losses of the 3300 position, and treat it as the right-side trading method in terms of operation.
Gold on high time frame
"Hello traders, focusing on gold, the price recently swept liquidity around $3,250 and displayed strong signals indicating a potential upward movement. The next target could be around $3,400."
If you need further clarification or have more details to discuss, feel free to share!
GOLD Price Analysis: Key Insights for Next Week Trading DecisionIn this video, I break down last week’s gold price action and give you a detailed outlook for the week ahead. With gold closing around $3,260 and major macroeconomic shifts unfolding—including the Israel-Iran ceasefire talks, rising US dollar strength, and concerns over the US Q1 GDP contraction, we are at a turning point.
📉 Will weakening economic data force the Fed to pivot?
📈 Could this create a fresh bullish wave for gold?
Or will stronger job numbers and inflation data drag gold lower?
✅ What you’ll learn in this video:
✅Key fundamental drivers affecting gold (XAU/USD)
✅Important economic events to watch (Fed Chair speech, NFP, ISM)
✅My technical analysis of gold price levels to watch
✅How to read the current market sentiment like a pro
✅Strategic trading zones for bulls and bears
🔔 Don’t forget to like the video in support of this work.
Disclaimer:
Based on experience and what I see on the charts, this is my take. It’s not financial advice—always do your research and consult a licensed advisor before trading.
#xauusd, #goldprice, #goldanalysis, #goldforecast, #goldtrading, #xauusdanalysis, #technicalanalysis, #fundamentalanalysis, #forextrading, #forexmentor, #nfpweek, #goldoutlook, #tradingstrategy, #chartanalysis, #julyforecast, #fedwatch, #priceaction, #traderinsights, #commoditytrading, #marketbreakdown, #xauusdforecast, #tradethefundamentals, #smartmoneytrading

Gold continues to be weak, but be careful about operations
📣Gold prices fell 2% last Friday, hitting a near one-month low. Optimistic trade-related agreements boosted risk appetite and weakened the attractiveness of gold as a safe-haven asset. This week, the market will usher in a group meeting of major central bank governors around the world (Fed Chairman Powell, European Central Bank President Lagarde, Bank of England Governor Bailey, Bank of Japan Governor Kazuo Ueda, and Bank of Korea Governor Lee Chang-yong). The market will also usher in non-agricultural data. In addition, Powell's remarks on whether to resign may ignite the market this week. Gold prices may fluctuate more around the lower track of the Bollinger Band at $3,270/ounce this week.
Technical analysis:
Last Friday, the K-line had a lower shadow, and the Bollinger Band did not diverge. It is not easy to go short directly in operation, but wait for the rebound to confirm 3295 and the key resistance of ma5 to be short.
💰 Operation strategy: Rebound to 3280-3283 to go short, target 3270-3265, stop loss 3288-3290
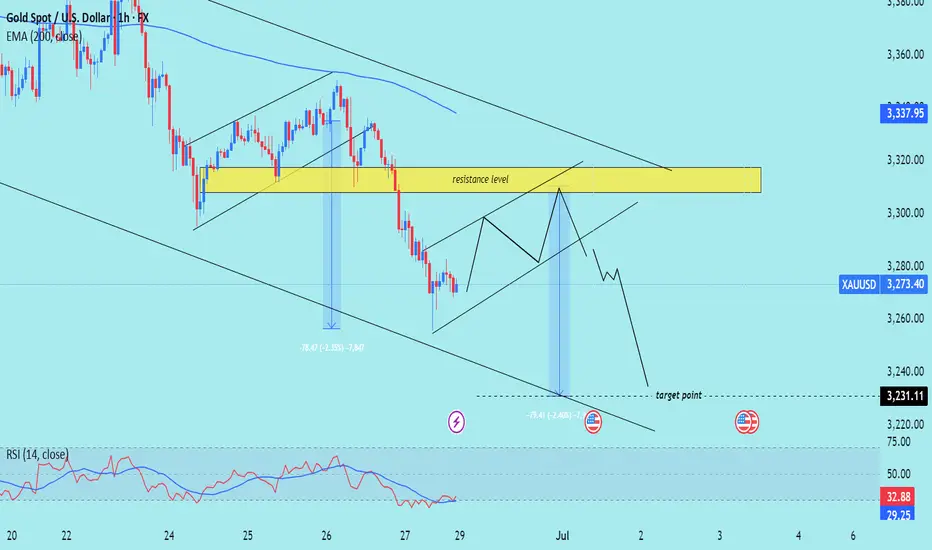
XAU/USD) bearish Trand analysis Read The captionSMC trading point update
Technical analysis of (XAU/USD) on a short-term timeframe, incorporating several key tools and concepts:
---
Overview of the Analysis
Price Level (Current): Around $3,273.40
EMA 200 (Blue Line): Around $3,337.95 (signaling broader trend)
Resistance Zone (Yellow Box): Between approximately $3,300–$3,320
Support/Target Zone: Around $3,231.11
RSI (Relative Strength Index): At 32.88, which is near oversold territory (below 30)
---
Interpretation of Chart Structure
1. Descending Channel:
Price is moving within a downward-sloping channel.
Suggests a bearish trend is in play.
2. Resistance Level (Yellow Box):
Price is expected to retest this area and face resistance.
Confluence of a supply zone and upper trendline, reinforcing its strength.
3. Projected Price Action:
Price may climb back up into the resistance zone.
A rejection is anticipated, leading to another leg down.
The target is around $3,231.11, which matches previous measured moves.
4. Measured Moves (Blue Arrows):
Highlights historical price drops of ~79 points.
Repeating this pattern suggests symmetry and continuation.
5. RSI Indicator:
Currently at 32.88: nearing oversold, but not quite.
No clear bullish divergence, so price could drop further.
---
Trade Idea Summary
Bias: Bearish
Entry Zone: Near $3,300–$3,320 (resistance)
Target: Around $3,231.11
Invalidation: If price breaks and holds above $3,337–$3,340 (EMA 200 and channel breakout)
Mr SMC Trading point
---
Caution/Considerations
Watch for false breakouts above the resistance zone.
Monitor RSI for potential bullish divergence that could invalidate the downside.
Be cautious around the U.S. economic news event icon, which might cause volatility.
plesse support boost 🚀 this analysis)
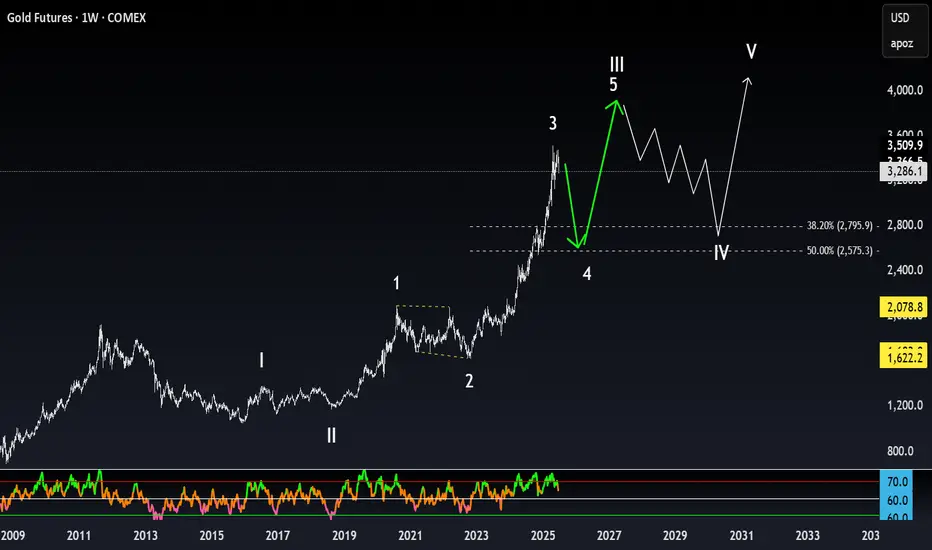
Navigating Gold Futures: Support, Resistance, and ProjectionsCOMEX:GC1!
The chart appears to depict a clear five-wave pattern: I, II, III, IV, and V.
Waves I to III show strong upward movements, indicating bullish sentiment.
Wave IV looks like it could be a corrective phase, with a potential dip before another upward movement in Wave V.
Support and Resistance Levels:
The horizontal lines around 2,800 and 2,575.3 indicate critical Fibonacci retracement levels (38.20% and 50%).
If the price approaches these levels during the correction, they could serve as support, making it a potential buying opportunity.
RSI Indicator:
From the bottom indicator (RSI), we can see fluctuations in momentum, which can aid in timing trades.
Look for interpretations of the RSI: if it trends towards the extremes (overbought/oversold), that could signal reversal points.
Future Projections:
Should the market respect the outlined support levels, Wave V could potentially push towards a new high above 4,000 as indicated by the upward projection.
Market Sentiment:
Overall, the pattern suggests a bullish outlook long-term, but caution is warranted during corrective phases as prices might retrace towards support levels.
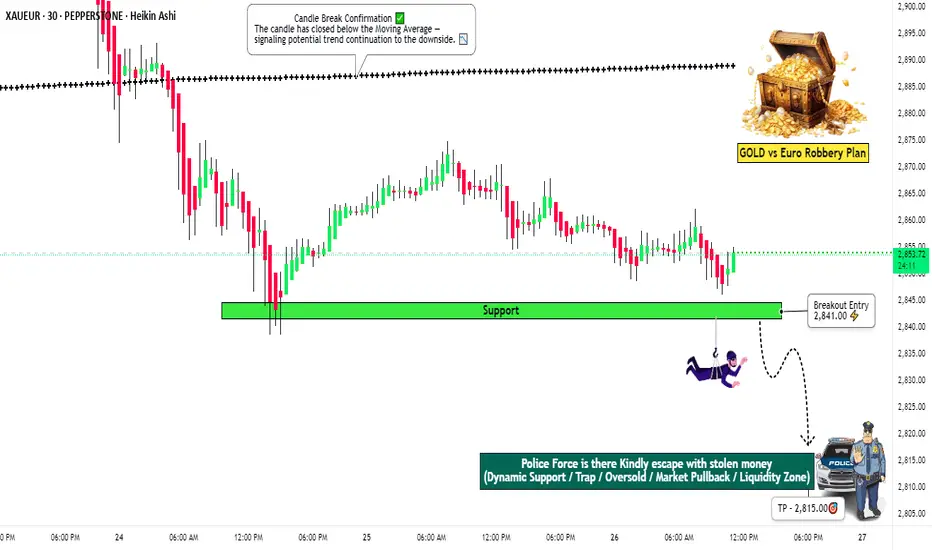
"BREAKOUT ALERT! XAU/EUR Bear Raid – Get In Before The Drop!"🤑 GOLD HEIST ALERT! 🚨 XAU/EUR Bearish Raid Plan (Thief Trading Style) 💰🔥
🌟 Greetings, Market Pirates & Profit Snatchers! 🌟
Based on the 🔥Thief Trading Strategy🔥, we’re plotting a high-stakes bearish raid on XAU/EUR ("The Gold Market"). Our mission? Short the breakout & loot the downside!
🎯 TRADE SETUP (Scalping/Day Trade)
Entry (Sell Zone) 📉: 2841.00 – Wait for Neutral Level breakout, then strike!
Pro Tip: Place sell-stop below support or sell-limit on pullback (15-30min TF).
Set an ALERT! Don’t miss the breakout moment.
Stop Loss 🛑:
"Stop right there, cowboy! 🤠 If you’re entering on a sell-stop, DO NOT set SL before breakout!
Thief SL Rule: Nearest swing high (30min TF) – Adjust based on your risk & lot size.
Rebels, be warned – stray at your own peril! 🔥
Target 🎯: 2815.00 (Lock profits & escape like a pro thief!)
💡 WHY THIS HEIST? (Bearish Triggers)
Technical Setup: Oversold bounce? Trap. Strong bearish reversal brewing.
Fundamentals: Macro risks, COT data, geopolitics – Gold’s under pressure!
News Alert 🚨: High-impact events ahead! Avoid new trades during news – trail stops to protect gains.
💥 BOOST THE HEIST! 💥
Like & Boost this idea to strengthen our robbery crew! More loot = more winning trades. Stay tuned for the next heist! 🚀💰
⚠️ Disclaimer: Trade at your own risk. This is not financial advice – just a strategic raid plan. Manage risk wisely!
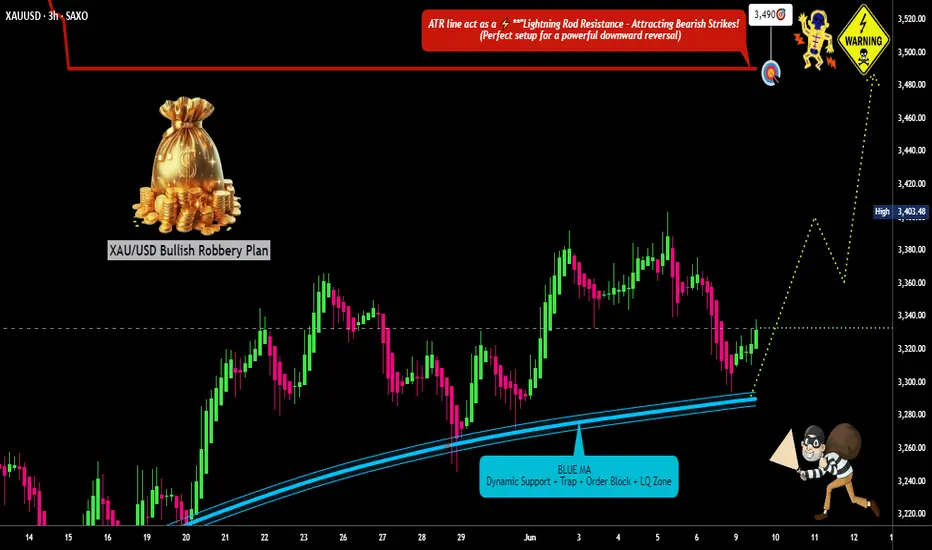
"The Great Gold Heist" – XAU/USD Master Plan🏆 "The Great Gold Heist" – XAU/USD Master Plan (High-Risk, High-Reward Loot!) 🚨💰
🌟 Attention, Market Robbers & Money Makers! 🌟
Hola! Oi! Bonjour! Hallo! Marhaba! 🤑💸
🔥 Based on the legendary Thief Trading Strategy (technical + fundamental heist tactics), here’s our blueprint to STEAL massive profits from the XAU/USD (Gold vs. Dollar) market! 🔥
🎯 The Heist Plan (Long Entry Setup)
Entry Point 📈: *"The vault is UNLOCKED! Swipe bullish loot at any price—but for a cleaner steal, set Buy Limits within 15-30M recent swing lows/highs. ALERT UP! ⏰"*
Stop Loss 🛑: "Thief’s SL hides at the nearest swing low (3H TF: 3250.00) OR below the last daily candle wick. Adjust based on your risk appetite & lot size!"
Target 🏴☠️: 3490.00 (or escape early if the cops—err, bears—show up!)
⚡ Scalper’s Quick Loot Guide:
"Only scalp LONG! Rich? Go all-in. Broke? Join the swing traders & rob slow ‘n’ steady. Use Trailing SL to lock profits!"
📊 Market Status:
XAU/USD (GOLD) – Neutral (But Bullish Sneak Attack Likely! 🐂💥)
"The heist is ON, but watch for traps—overbought zones, consolidation, and bearish robbers lurking!"
🔍 Pro Thief Moves:
✅ Fundamentals Matter! (COT Reports, Geopolitics, Macro Data, Sentiment—check our BIO0 for the full loot list!) 🔗👉🏻☝🏻
✅ News = Danger! Avoid new trades during releases. Trail your SLs to protect stolen cash! 📰🚨
💖 Support the Heist Crew!
"Hit the BOOST BUTTON 💥 to strengthen our robbery squad! More boosts = easier money steals daily!"
🚀 Stay tuned—another heist drops soon! 🐱👤💎
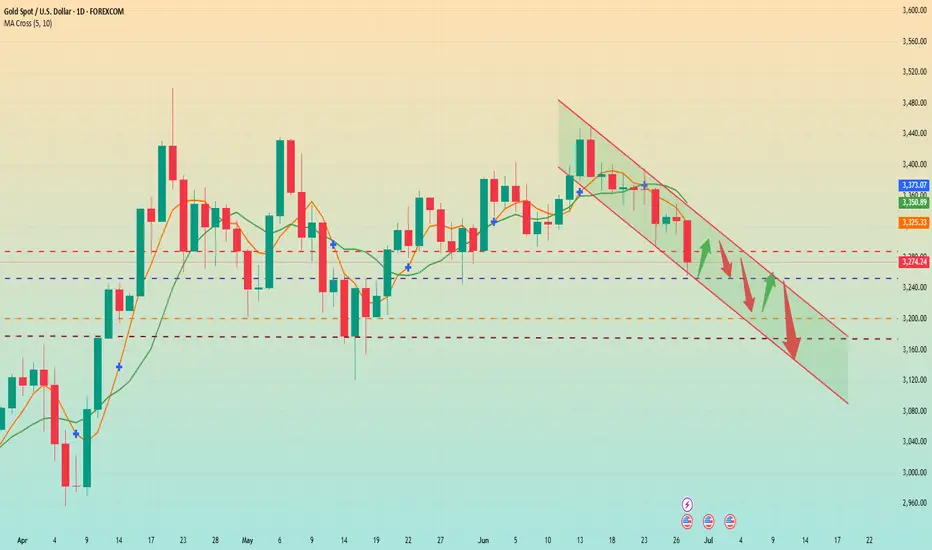
Non-agricultural data is coming. Will it affect the market trendBecause there will be non-agricultural data next week, Quaid thinks that the market will not be in a hurry to perform at the beginning of the week. And Friday is the US Independence Day, and the market will be closed in advance; maybe only Wednesday and Thursday are really needed.
This week, gold closed below 3300, and the daily line was also broken, and gold officially entered a bearish trend.
First look at the monthly line chart
Because next Monday is the last day of June, the monthly line will start to close, so you can still pay attention to the support of the monthly line. The MA5 moving average below the monthly line is currently around 3170. Moreover, with the support of non-agricultural data next week, the possibility of touching around 3170 is not ruled out.
Secondly, from the weekly line chart
The weekly line is basically the same as the monthly line. The MA20 moving average below is also around 3170. So next week, I think we should focus on around 3170. The monthly line and the weekly line resonate, so the probability of touching this position is very high.
Finally, let's look at the daily chart. The daily chart shows a downward trend and the short-term support has been broken. The current support is around 3250. I think there is a high probability of a small sideways consolidation at the beginning of the week. If the market conditions are eager to change, it may rebound slightly and then continue to decline. If it falls below 3250, it will continue to fall towards 3200. If this level is broken, it may hit the low point of 3170-3175.
"Stealing Gold Profits: XAU/USD Long Setup (Risk-Reward Heist)"🔥 GOLD HEIST ALERT: XAU/USD Breakout Robbery Plan (Long Setup) 🔥
🌟 Hi! Hola! Ola! Bonjour! Hallo! Marhaba! 🌟
Attention, Money Makers & Market Robbers! 🤑💰💸✈️
Based on the 🔥Thief Trading Style🔥 (technical + fundamental analysis), we’re plotting a heist on XAU/USD (GOLD). Follow this master plan for a bullish escape near the high-risk ATR zone. Beware—overbought signals, consolidation traps, and bearish robbers lurk! Take profits fast and treat yourself—you’ve earned it! 🏆💸
📈 ENTRY: THE HEIST BEGINS!
Wait for Resistance Breakout (3400.00) → Then strike!
Buy Stop Orders: Place above Moving Average.
Buy Limit Orders: Use 15M/30M pullbacks (swing lows/highs).
Pro Tip: Set a chart ALERT to catch the breakout live!
🛑 STOP LOSS: DON’T GET CAUGHT!
For Buy Stop Orders: Never set SL before breakout!
Thief’s SL Spot: Recent swing low (4H timeframe).
Adjust SL based on your risk, lot size, and order count.
Rebel Traders: Place SL wherever—but you’ve been warned! 🔥
🏴☠️ TARGET: 3480.00
Scalpers: Long-only! Use trailing SL to lock profits.
Swing Traders: Join the robbery crew for bigger gains.
📊 MARKET CONTEXT:
XAU/USD is neutral but primed for bullish moves 🐂. Watch:
Fundamentals (COT Reports, GeoPolitics, News).
Intermarket Trends & Sentiment.
Positioning & Future Targets (Check our bio0 for analysis linkss!).
⚠️ TRADING ALERTS:
News Releases = High Volatility!
Avoid new trades during major news.
Use Trailing SL to protect open positions.
💥 SUPPORT THE HEIST!
Hit the Boost Button 💖→ Strengthen our robbery team!
Profit daily with the Thief Trading Style. 🏆💪🚀
Stay tuned for the next heist—more loot awaits! 🤑🐱👤🎉

GOLDGOLD is about to get ready for a push up, keep an eye from the reaction zone for buy setups.
Disclosure: We are part of Trade Nation's Influencer program and receive a monthly fee for using their TradingView charts in our analysis.
A new golden week, grasp it with the best condition
Good weekend everyone, this week's trading time is over, and next week's trading time will also enter the countdown. No matter how you grasp the market this week, whether happy or sad, Theo hopes that everyone will not bring your mood to the trading environment next week.
After all, next week is also a new beginning of the week. In the new week, everyone should be prepared for a new state. A good state should be persevered, and a bad state should be adjusted. With a good state to grasp the market trend of next week, I believe you can also be invincible and grasp the market better!
📊Technical aspects
Gold did not break through the upper pressure at midnight on Friday. Gold fell directly after opening in the morning on Friday. The bears broke through the previous 3295 support line, and the lowest level in the evening was 3255, closing at around 3274.
The daily line also closed in the form of a big negative line, with an obvious downward trend, and all the previous support will also turn into pressure. The short-term moving average system crossed downward to accumulate energy for the bears. Since the closing did not break through the upper 3300 pressure level, we will continue to rebound and short next week. After all, the technical side is still short, and only by following the trend can we keep up with the rhythm of eating meat.
From the 4-hour analysis, the upper short-term resistance is around 3295-3301, with special attention paid to the suppression at 3316. In terms of operation, the rebound continues to be the main short and the trend looks down. The lower short-term support is around 3250-3255. The overall main tone of high-altitude participation remains unchanged relying on this range.
💰Strategy Package
Short Position:3290-3300,SL:3315,Target: 3240-3250
Next week's market trend analysisShort-term technical analysis of gold next week:
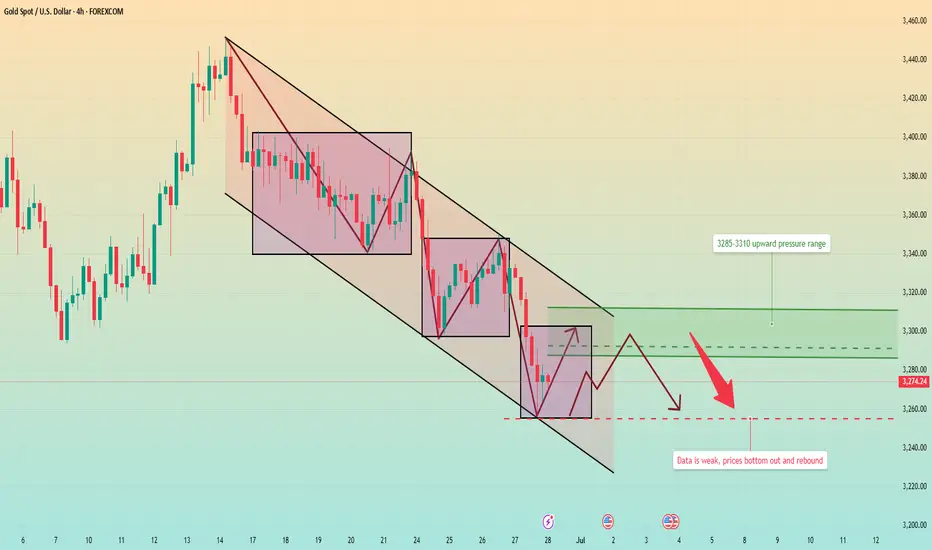
After gold was horizontally consolidated below 3400, it had two relatively large retracements. The short-term downward channel, the upper edge of the channel is currently around 3340, which is also the turning point of the short-term long and short cycles that we need to pay attention to later.
Has the current big rhythm entered a weak position?
Daily level analysis: After reaching 3500, gold is still in a trend of high-level consolidation, and there is a periodic switch between long and short positions, and there is no extremely strong or weak rhythm. In this consolidation process, there are two relatively large retracements: the first from 3500 to 3200 space 300 points, the second from 3435 to 3120 space 315 points. In other words, in the current daily level cycle, the maximum decline is around 300 US dollars. Not exceeding this maximum retracement value, to a certain extent, it is still in the rhythm of high-level correction. According to the range of this space retracement, the limit of the daily retracement is around 3150, with an error of about 20 points. However, the daily range is large, so it is too early to talk about this threshold.
At present, the short-term pressure points of 0.618 and the top and bottom structures are all around 3300. Another point for everyone to pay attention to: in the market with a small cycle of negative decline, once there is a sideways trend. Don't take it as support! The price is consolidating horizontally, which only means that the current bulls are weak in pulling back and the change of weakness must be a strong pullback to break through the big negative. Similarly, the slow rise market is the same.
The first support below in the short term is around 3250. The strong support is at the integer level of 3200. Once this position is reached, it will become a repeated test position like 3400.
Gold fluctuates and rebounds, don't chase shorts at low levels
💡Message Strategy
Yesterday, Thursday, we believed that the easing of tensions in the Middle East, the cooling of market risk aversion, and the hawkish stance of the Federal Reserve, which believed that the possibility of rate cuts should not be overly expected, suppressed expectations of rapid rate cuts, dragged down the dollar, and jointly suppressed the trend of gold.
However, trade uncertainty, geopolitical situation and expectations of rate cuts still support gold prices, which temporarily supports gold's rebound from a three-week low. Therefore, in terms of operations, it is recommended that everyone pay attention to the upper pressure of $3,345, followed by $3,357, and the lower support of $3,325, followed by $3,310.
From the subsequent trend, during the Asian session, gold fell back to $3,330 and stabilized. After the opening of the European session, the gold price rebounded and rose to $3,350 and encountered resistance. After that, gold fluctuated and fell. The decline continued after the opening of the US session, falling to $3,310 and stabilizing. After the rebound of $3,336 and encountering resistance, gold fell again, and continued to fall after the opening of Friday, refreshing the June low to $3,291, and performing weakly in the short term.
Overall, gold rebounded to $3,350 on Thursday and encountered resistance, then fell back to $3,310 and stabilized. It basically operated between the support and pressure levels we gave. On Friday, the gold price tried to break downward, and the short-term downside risk increased.
📊Technical aspects
On the daily chart, gold fell from a two-month high and rebounded from a low in June this week, but as gold prices fell back on Thursday, the short-term trend of gold prices turned downward again. For gold's upper pressure, pay attention to the integer position of $3,300, followed by Thursday's low of $3,310, and the 1-hour Bollinger band middle track of $3,325;
For gold's lower support, pay attention to the current intraday low of $3,291, which is also the lower track of the daily Bollinger band. A downward break may increase the risk of short-term decline. Pay attention to the two lows of $3,270 and $3,250 when gold prices rebounded at the end of May.
The 5-day moving average and MACD indicator cross, and the KDJ and RSI indicators cross. The short-term technical aspect shows that gold prices are at risk of continuing to fall.
💰Strategy Package
Short Position:3275-3295,SL:3315,Target: 3240-3250
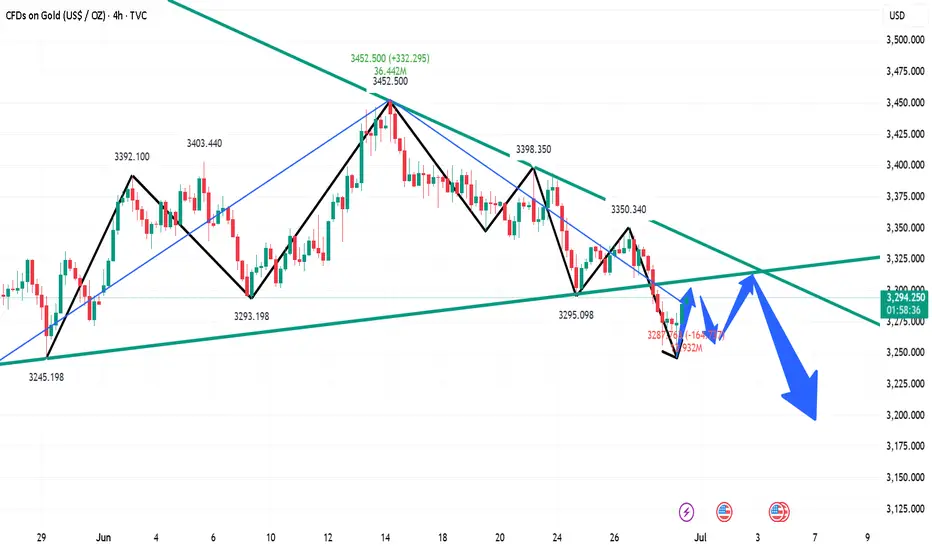
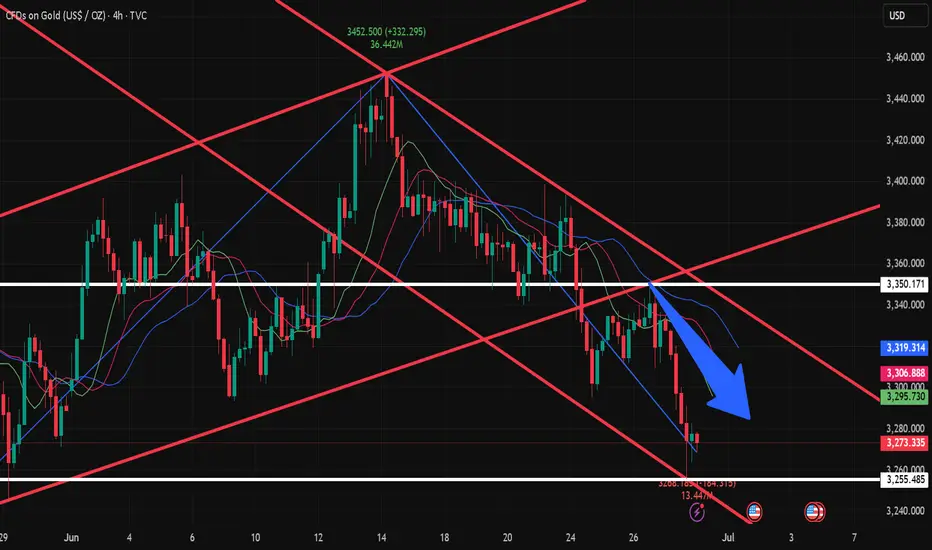
Gold has been falling continuously. Will it continue next week?Market review:
The conflict between Israel and Iran intensified, and gold surged in the early stage, and then continued to fluctuate downward. Affected by the situation in the Middle East and weak data from the United States, it fell severely in three trading days, and most of the other time periods were in the stage of repeated washing.
The first round of decline began at the high point of 3452. Affected by the situation in the Middle East, the price rose rapidly, but the rapid rise led to insufficient upward momentum, and the departure of buyers led to continuous declines in a single trading day. The second round of decline was affected by the easing of the conflict between Iran and Israel, and the US dollar, crude oil, and gold all plunged sharply; the third round of decline was Powell's wait-and-see attitude towards the interest rate cut policy, and some US data were bearish for gold, leading to a new round of decline.
Market outlook for next week:
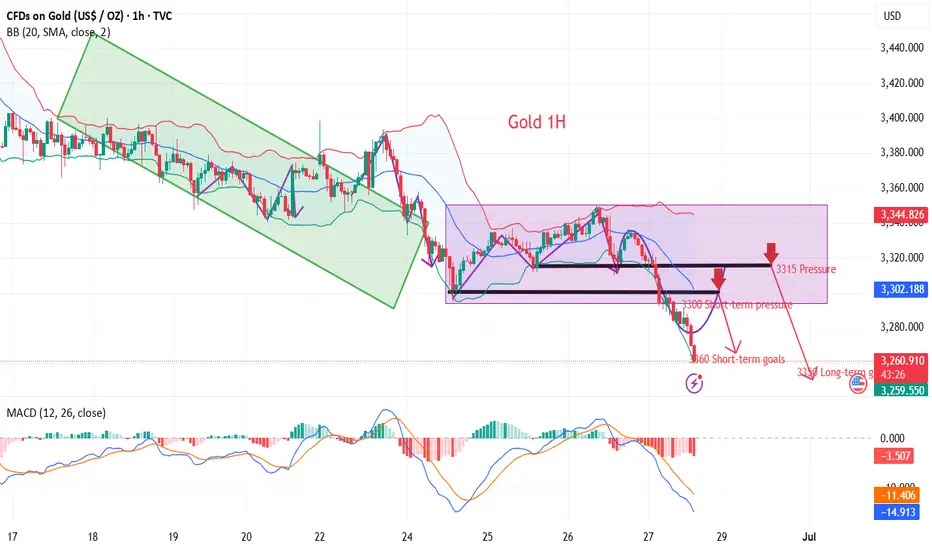
The breaking of the key support bands of 3303 and 3295 means that the downward adjustment has not ended, but after touching the support near 3250, there was a clear bottoming out and recovery. It means that there is strong support below, and the focus of next week's opening is the emergence of price rebound. There were rebounds to varying degrees after the previous two rounds of decline, so this round of decline still needs to be paid attention to. The strategy mainly revolves around shorting on price rebound, with a focus on the upward suppression range of 3285-3310.
If the rebound is small, then at the beginning of next week, it is likely to maintain a small fluctuation in the range of 3270-3285.
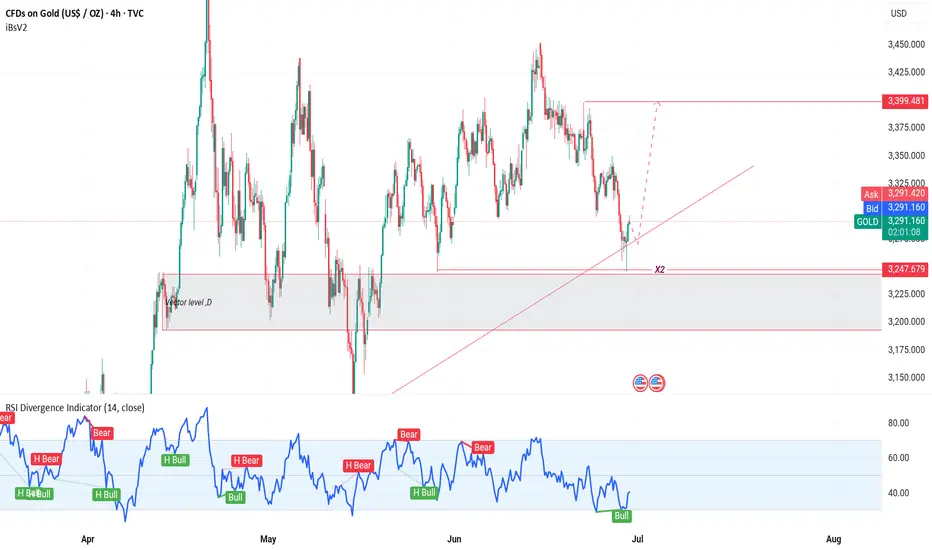
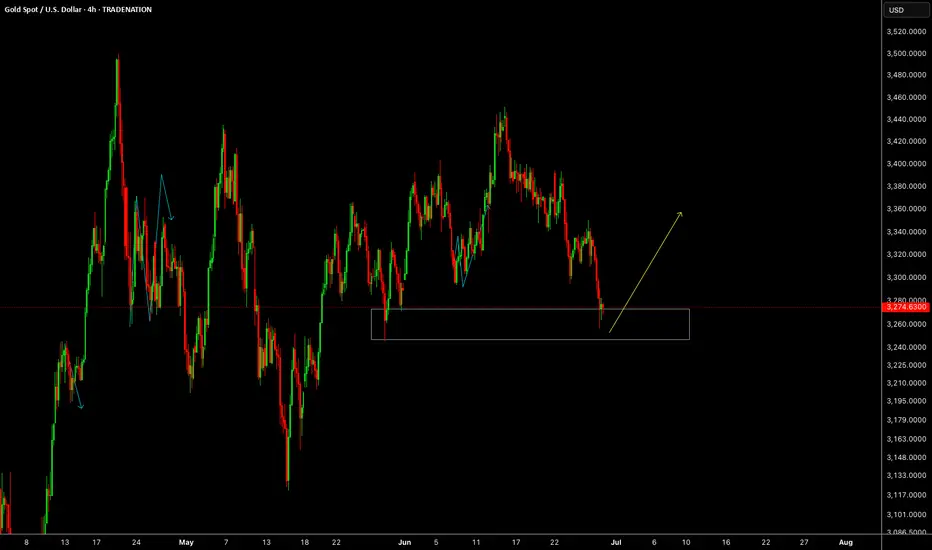
Gold Rebounds After Filling Gap >> Bullish Continuation in SightHello guys!
Gold (XAU/USD) is showing signs of strength on the 4H chart after filling a key gap around the $3,290 level and bouncing off it with bullish intent.
🔹 What I see:
– Price previously broke out of a broad descending channel, flipping the structure bullish
– After forming a rising wedge, Gold corrected lower and filled the gap
– The zone around $3,290 acted as solid support, and the current bounce suggests bulls are regaining control
📈 Outlook:
If this bounce holds and momentum builds, the next area of interest is clearly marked:
🎯 First Target: $3,466 – an area of prior structure and possible supply
📍 Current Price: $3,329
🟢 Bias: Bullish (above $3,290)
🔴 Invalidated below: $3,244
This setup offers a favorable risk-to-reward opportunity if the structure continues holding. Keep an eye on price action near the recent local highs for confirmation.
