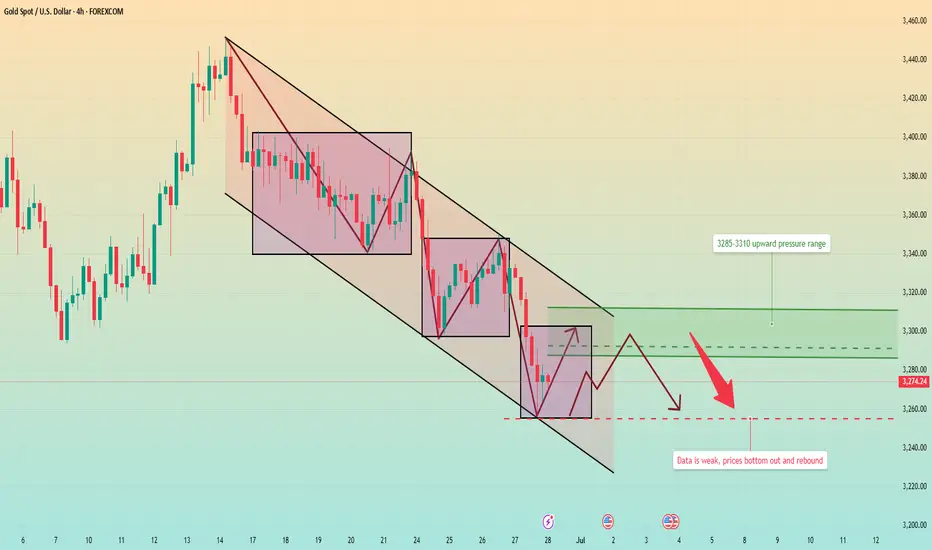
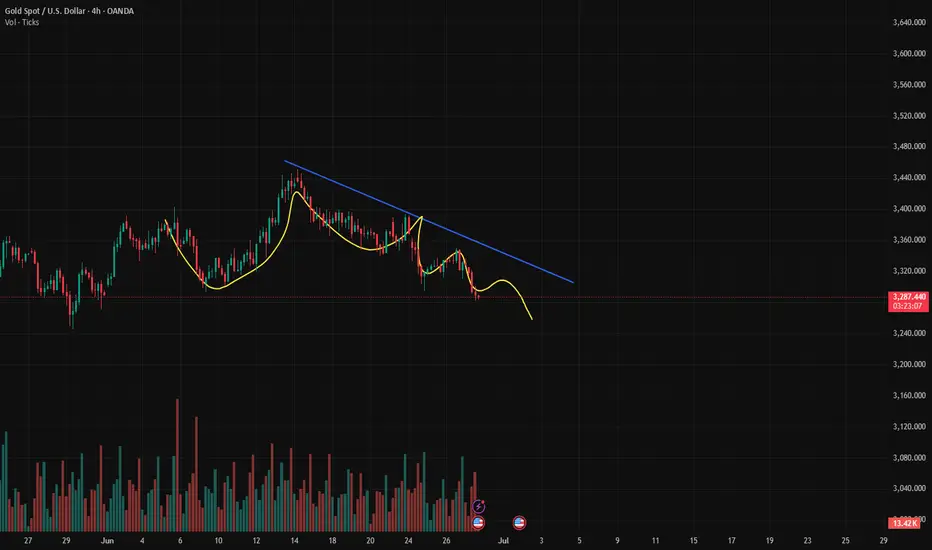
Gold has been falling continuously. Will it continue next week?Market review:
The conflict between Israel and Iran intensified, and gold surged in the early stage, and then continued to fluctuate downward. Affected by the situation in the Middle East and weak data from the United States, it fell severely in three trading days, and most of the other time periods were in the stage of repeated washing.
The first round of decline began at the high point of 3452. Affected by the situation in the Middle East, the price rose rapidly, but the rapid rise led to insufficient upward momentum, and the departure of buyers led to continuous declines in a single trading day. The second round of decline was affected by the easing of the conflict between Iran and Israel, and the US dollar, crude oil, and gold all plunged sharply; the third round of decline was Powell's wait-and-see attitude towards the interest rate cut policy, and some US data were bearish for gold, leading to a new round of decline.
Market outlook for next week:
The breaking of the key support bands of 3303 and 3295 means that the downward adjustment has not ended, but after touching the support near 3250, there was a clear bottoming out and recovery. It means that there is strong support below, and the focus of next week's opening is the emergence of price rebound. There were rebounds to varying degrees after the previous two rounds of decline, so this round of decline still needs to be paid attention to. The strategy mainly revolves around shorting on price rebound, with a focus on the upward suppression range of 3285-3310.
If the rebound is small, then at the beginning of next week, it is likely to maintain a small fluctuation in the range of 3270-3285.
Goldprice
Gold Rebounds After Filling Gap >> Bullish Continuation in SightHello guys!
Gold (XAU/USD) is showing signs of strength on the 4H chart after filling a key gap around the $3,290 level and bouncing off it with bullish intent.
🔹 What I see:
– Price previously broke out of a broad descending channel, flipping the structure bullish
– After forming a rising wedge, Gold corrected lower and filled the gap
– The zone around $3,290 acted as solid support, and the current bounce suggests bulls are regaining control
📈 Outlook:
If this bounce holds and momentum builds, the next area of interest is clearly marked:
🎯 First Target: $3,466 – an area of prior structure and possible supply
📍 Current Price: $3,329
🟢 Bias: Bullish (above $3,290)
🔴 Invalidated below: $3,244
This setup offers a favorable risk-to-reward opportunity if the structure continues holding. Keep an eye on price action near the recent local highs for confirmation.

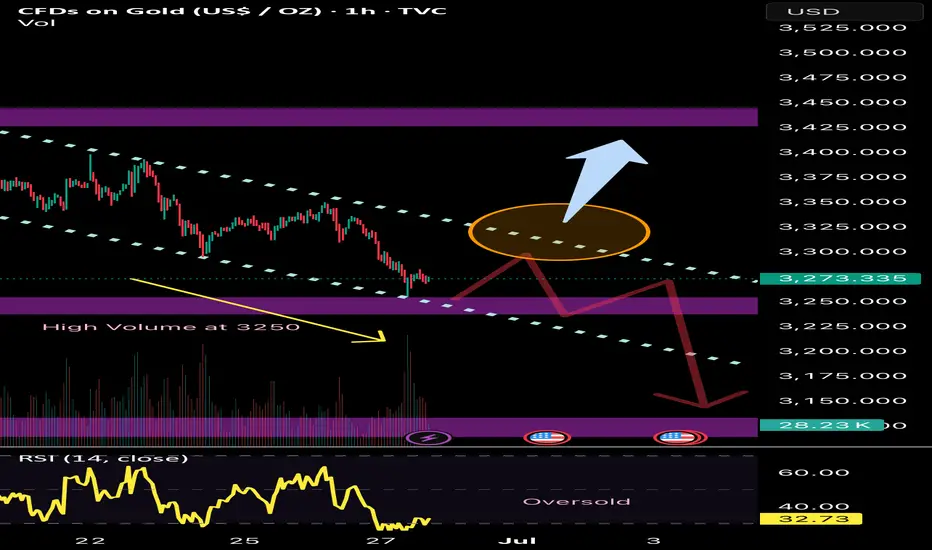
Will the FALL continues?Last trade idea was fulfilled and went into the downside. Targeted 3250. If this 3250 major support area breaks down, we can expect a bigger downside move.
However, there’s a huge buying that happened at that level. It may first have a pullback upwards before it continues its decline. RSI is also at oversold level.
Bullish reversal can be confirmed if 3350 gets broken.
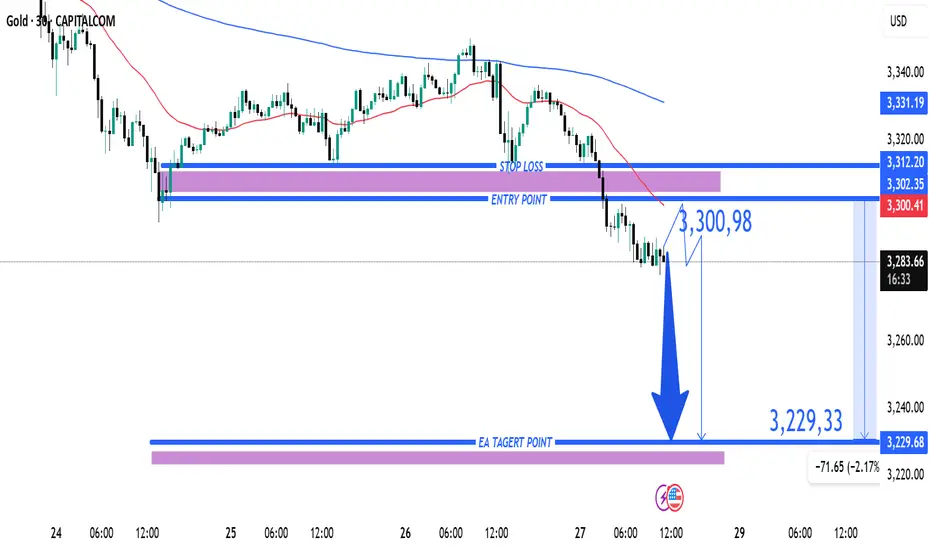
Gold (XAU/USD) Bearish Trade Setup – June 27, 2025Entry Point: Around 3,300.98 USD
Stop Loss (SL): ~3,312.20 USD
Take Profit (TP): 3,229.33 USD
Current Price: 3,286.15 USD
Risk-Reward Ratio: ~1:6.3
(Potential reward ≈ 71.65 pts; risk ≈ 11.22 pts)
Technical Breakdown:
Trend:
The price is in a short-term downtrend, supported by:
Lower highs and lower lows.
Price trading below both 50 EMA (red) and 200 EMA (blue), confirming bearish momentum.
Bearish Breakout:
Price broke below a key support-turned-resistance zone near 3,300–3,302, triggering sell pressure.
Resistance Area:
Strong rejection at 3,302–3,312 zone, which is now acting as resistance.
SL is placed just above this zone to protect against false breakouts.
Target Zone:
TP set at 3,229.33, aligning with a previous support zone — a logical area for price to react.
Strategy Notes:
Bias: Bearish
Entry confirmation: Already triggered.
Risk Management: SL placement is tight and strategic; RR ratio is highly favorable.
Next support below TP: If 3,229 breaks, further downside could follow.
Summary:
This setup shows a well-defined bearish continuation with a clean break of support, a controlled SL above resistance, and a strong RR ratio. A suitable trade for trend-following strategies, but price must not retrace above 3,312 for this idea to remain valid.
Gold Continues to Fall Below $3,300As the week comes to a close, gold is on track for a decline of more than 1.5% during the latest trading session. So far, the bearish bias remains firmly in place in the movements of the precious metal, as demand for safe-haven assets continues to fade, mainly due to the ceasefire agreement in the Middle East conflict, which has helped restore market confidence. Since gold is a classic safe-haven asset, demand has steadily weakened in recent sessions, and as long as this situation holds, selling pressure on gold may continue to intensify.
Uptrend Breaks:
Recent selling activity has played a crucial role, as it has led to a bearish breakout below the short-term trendline, which had been consistently holding on the chart. This breakdown has now opened the door for a lateral channel to form, suggesting that market sentiment has entered a more neutral zone in the short term. If bearish pressure continues, it could pave the way for a more dominant downtrend to take shape in the sessions ahead.
Indicators:
RSI: The RSI line has started oscillating steadily below the 50 level, signaling that downward momentum is beginning to dominate. If the line continues to move away from the neutral 50 level, we could expect more consistent bearish pressure on the chart.
MACD: A similar setup is emerging on the MACD. The indicator's histogram has dropped below the neutral line at zero and is showing persistent negative readings. This signals that selling momentum remains dominant, based on the average strength of the moving averages. If this continues, it would confirm a clear bearish bias.
Key Levels to Watch:
$3,300 – Current barrier: This level aligns with the midpoint of the short-term lateral channel. Price action around this area could reinforce the neutral outlook in the near term.
$3,400 – Key resistance zone: This level marks the historical highs of the gold market. A return to this level would revive the recently abandoned bullish trend and could reestablish a more optimistic outlook.
$3,200 – Critical support: This marks the lower boundary of the short-term channel. A breakdown below this level could trigger a fresh selling trend in the coming sessions.
Written by Julian Pineda, CFA – Market Analyst
XAUUSD/GOLD/SellThe pressure from the bears is too great. In the end, the pressure from above was not broken. Instead, it broke out and fell after being under pressure. The stop loss was hit.
The current price is 3285. After gradually boosting the US dollar index. The trend of gold prices has continued to fall. More importantly, the tariff issue has been eased. At the same time, geopolitical factors are also orderly and stable. This is the news that caused the bears to attack.
History has not become the savior because of repeating itself. Of course, this is also an emergency. In some transactions, the extremely low probability of causing losses is a common problem in transactions. However, our analysis team has stabilized a high trading win rate.
Then the next trading plan is still to focus on the pressure from above. If the London market rebounds above 3300. It is still mainly selling. 3314 is an important level for short-term rebound, and we need to pay attention. Although there is no obvious sign of rebound yet, the release of short-selling pressure has been alleviated because the decline is slow. Today's main trading idea is still to sell at high levels.
The target is to focus on the position of 3264-3248. Remember the risk of buying at low levels. Do not trade independently.
The data is negative. Will the price rebound from the bottom?Gold prices have continued to fall since the high near 3450. This trading day started the downward mode near 3328, and the European session continued to fall, breaking a new low. The negative PCE data also continued the downward mode. So far, it has rebounded after hitting the lowest level near 3255. However, the rebound is small, and the upper pressure is still very strong.
From the 4-hour chart, short-term resistance focuses on the vicinity of 3295-3300, followed by important pressure near 3315. The short-term support below focuses on the vicinity of 3265-3270. The overall strategy of shorting at high positions remains unchanged based on this range.
Operation strategy:
Short at the price rebound near 3295, short covering at the high point of 3315, stop loss 3325, profit range 3370-3360.
At present, the price fluctuates greatly. If you want to try scalping transactions, you can trade with a light position and float up and down 5 points to stop loss or profit in time.
This is the last trading day of this week. I hope you all will gain something and have a happy weekend with your family.
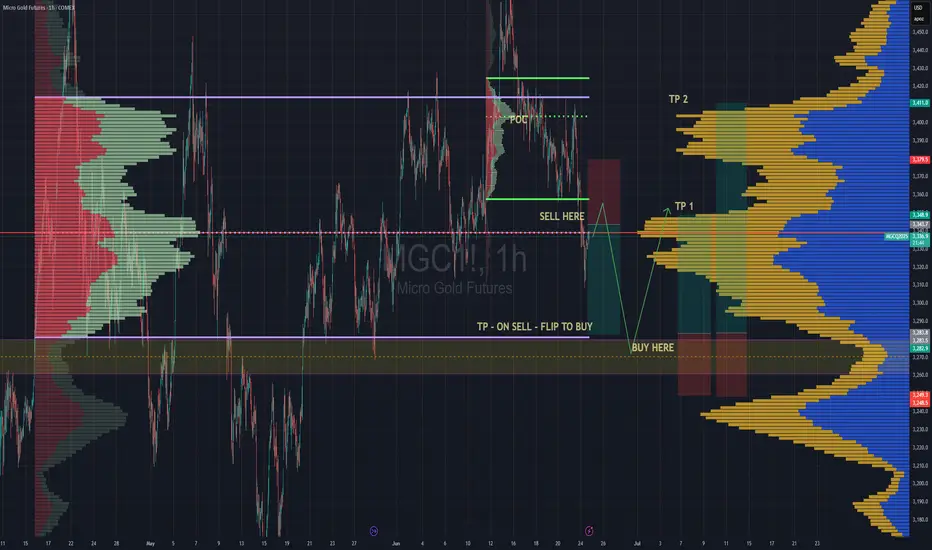
Long & Short Entry Forecast For GoldCooling war tensions seem to be cooling the Gold bullish rally as well.
But we're still in the same range since April 15th and will likely stay in the range until further notice *or the next tweet*
The Sell entry is great now cos we're near the top of the high volume node, so even if we consolidate around that POC this sell entry will still be putting us closest to the top of the node.
Hold your sell and TP at the VAL . We have a very deep low volume area there and its being a point of support since April. So we can place bets with small risk on hoping it holds cos if it doesn't, it wont be pretty. That is still the best place to buy regardless. So manage your risk accordingly
TP 1 for the Buy trade is at the POC , which also happens to be the top of the huge volume node. Totally make sense to take a decent chunk of profit of your position there, then move you stop loss into profit and grab some pop corn. Depending on the news , the best case scenario of for the uptrend is to continue all the way up to TP2 which is at the VAH
Secure the bag :)
Enjoy
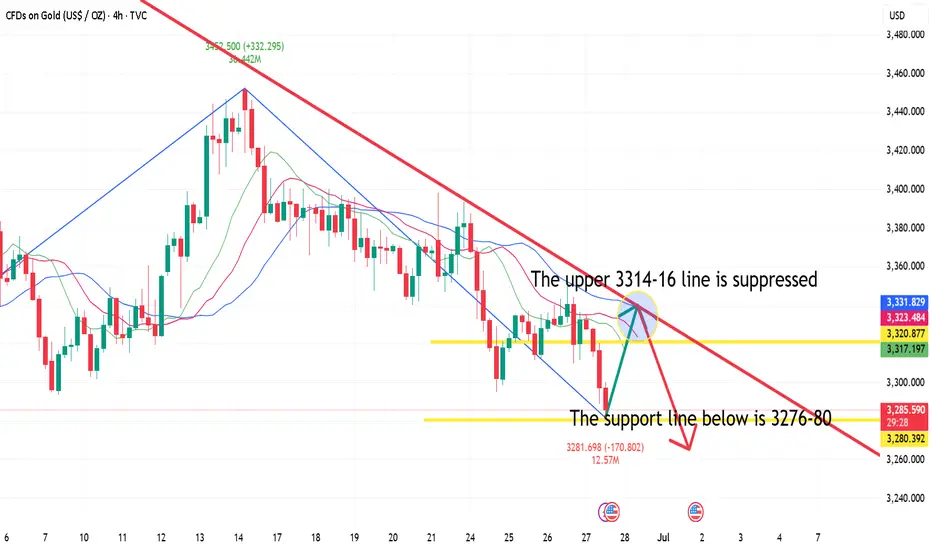
6.27 Gold rebounds and adjusts, don't chase shorts at low levelsGold fell below this week's low of 3295 today. As of now, gold has hit 3285 and is fluctuating. Don't chase the short position and short it when it rebounds. Now you can only wait patiently for the rebound before entering the short position. Be a steady hunter and wait patiently for the appearance of prey!
Gold is now focusing on the short-term suppression of the upper 3301-3306 line, focusing on the suppression of the upper 3314-16 line, and the support below is 3276-80. Short it when it rebounds.
Strategy ideas:
1. Gold rebounds to 3301-3306 line and shorts lightly, rebounds to 3314-16 line to cover short position, stop loss 3324, target 3280-85 line;
Gold fluctuates, operate at the right time!
💡Message Strategy
Trump called Powell "terrible" and said he was considering three or four candidates to replace Powell. Meanwhile, the Wall Street Journal reported that Trump was even considering announcing a potential successor as early as September or October.
The current mainstream narrative in the market is that once Trump nominates a new Fed chairman, market expectations will tend to favor a more "dovish" Fed. This in turn could lead to a weaker dollar, higher U.S. long-term Treasury yields, and higher stock prices.
Powell testified before the U.S. Senate on Wednesday that while Trump's tariffs could trigger a one-off price increase, the risk of sustained inflation is significant enough for the Fed to be cautious about further rate cuts.
Markets are now focused on U.S. GDP data due out that day and will closely watch personal consumption expenditures (PCE) data on Friday for further clues on whether the Fed will cut rates.
On the geopolitical front, a ceasefire between Israel and Iran appeared to hold on Wednesday. Trump hailed the swift end to the 12-day conflict at a NATO summit and said he would seek a commitment from Iran to abandon its nuclear ambitions in talks next week.
📊Technical aspects
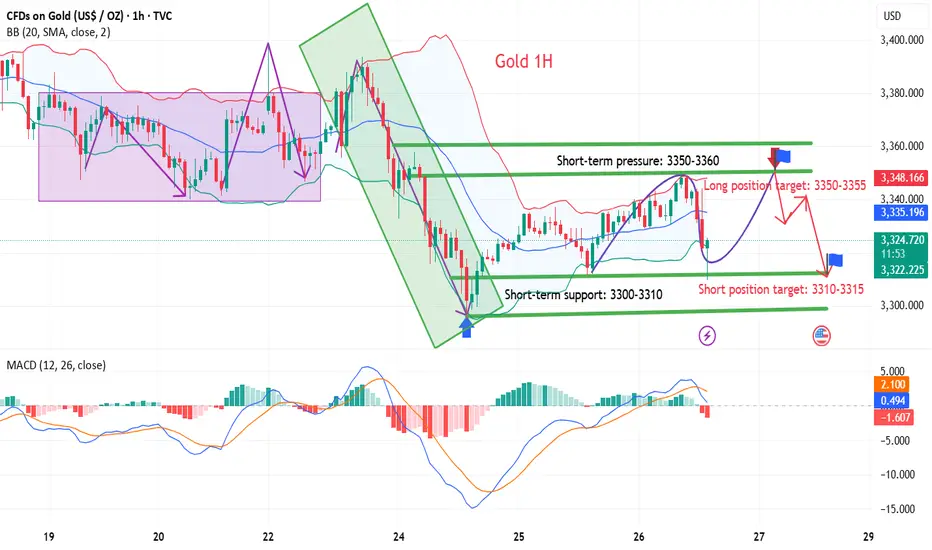
From the 1-hour analysis, the upper resistance is around 3350. The intraday rebound relies on this position to continue the main short-term decline. The lower short-term support focuses on the 3300-3310 integer mark, and the upper pressure focuses on the 3350 mark.
The overall support relies on this range to maintain the main tone of high-altitude low-multiple cycle participation. The short-term long-short strength and weakness watershed is 3370. It is difficult to say that it is strong before the daily level breaks through and stands on this position. Pay attention to the specific operation strategy in time.
💰Strategy Package
Short Position:3340-3350,SL:3320,Target: 3310-3300
Long Position:3310-3320,SL:3290,Target: 3350-3360
Waiting for data release to rebound and short📰 Impact of news:
1. PCE and Consumer Index
📈 Market analysis:
The current price of 3280 has a higher profit and loss ratio advantage. Technical indicators show that the hourly chart is severely oversold. Combined with the top and bottom conversion of 3300 above, there is a 20-point rebound space in the short term. If the PCE data is in line with the trend, gold prices are expected to quickly regain the 3,300 mark. Note that negative data beyond expectations may cause a brief decline.
🏅 Trading strategies:
BUY 3295-3280-3275
TP 3298-3300-3310
SELL 3300-3310
TP 3290-3280-3260-3250
If you agree with this view, or have a better idea, please leave a message in the comment area. I look forward to hearing different voices.
TVC:GOLD FXOPEN:XAUUSD FOREXCOM:XAUUSD FX:XAUUSD OANDA:XAUUSD
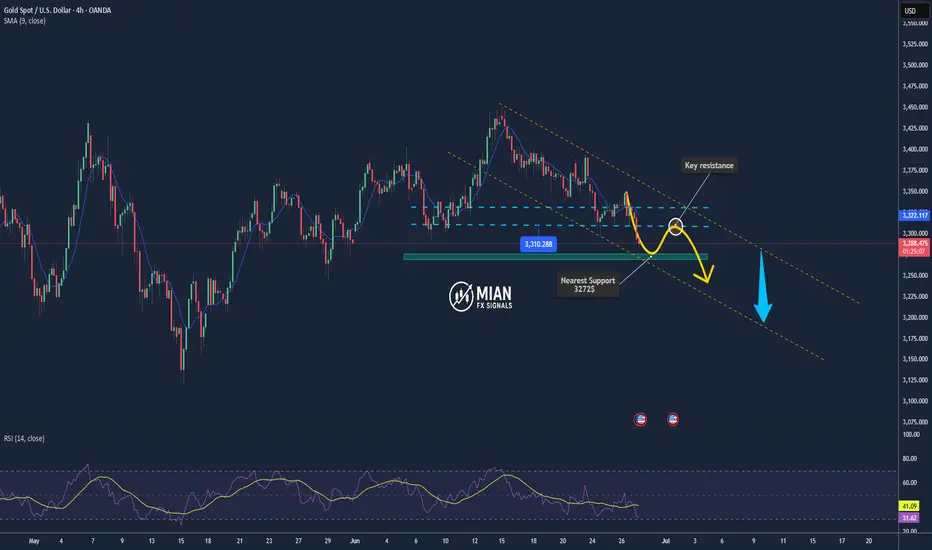
Gold Drops Sharply – Breaks Below the $3,300 Support📊 Market Overview:
Gold has plunged to $3,290/oz, breaking the key psychological level of $3,300 as the US dollar strengthened and Treasury yields ticked higher. Market sentiment has turned defensive ahead of Friday’s US PCE inflation data, with expectations that the Fed may maintain its hawkish stance for longer.
📉 Technical Analysis:
• Key Resistance: $3,310 – $3,325
• Nearest Support: $3,285 – $3,272
• EMA09: Price is currently below the 9-period EMA, confirming short-term bearish momentum.
• Candlestick / Volume / Momentum:
o H1/H4 charts show a series of long bearish candles, with rising volume → strong selling signal.
o RSI is approaching oversold levels (~28), MACD remains in a widening bearish divergence → downward pressure is still dominant.
📌 Outlook:
Gold is in a clear downtrend and may extend its decline toward $3,285 – $3,272 unless a reversal is triggered by weaker-than-expected PCE data or renewed geopolitical tensions. In the near term, any technical rebound is likely to offer sell opportunities rather than a trend reversal.
💡 Suggested Trade Setup:
🔻 SELL XAU/USD
• Entry: $3,300 – $3,305 (on technical retracement)
• 🎯 TP: $3,285 – $3,272
• 🛑 SL: $3,315
🔺 BUY XAU/USD (high risk)
• Entry: $3,272 – $3,277 (short-term bottom catching)
• 🎯 TP: $3,295 – $3,305
• 🛑 SL: $3,262
Gold is weak. Can it continue?Gold is still fluctuating and falling slightly today. Gold is weak, so gold is likely to be short-term. If the price rebounds, it will be a short opportunity.
We need to pay attention to the release of US PCE data later.
From the 1-hour chart
the moving average continues to cross the short arrangement and diverge downward. After gold fell below the early support near 3340, it began to move downward weakly. The current upward pressure is around 3295-3310.
From the daily chart, the price is below the MA20 cycle and the 50 cycle, but remains above the 100 cycle. The technical indicators turned higher, but the momentum indicator is at a neutral level, and the RSI index is around 42.7, which does not point to an upward trend.
Since the upcoming data may have some impact on the price, the price may have a short-term high opportunity. Steady trading is still waiting for the price to rise and then short. Of course, if your trading strategy is more aggressive, you can use a long strategy before the price rises.
Operation suggestions:
Radical: Buy near 3280, stop loss at 3265, profit range 3305-3310.
Conservative: Wait for the price to rise and then bear pressure, sell near 3310, stop loss at 3320, profit range 3290-3285.
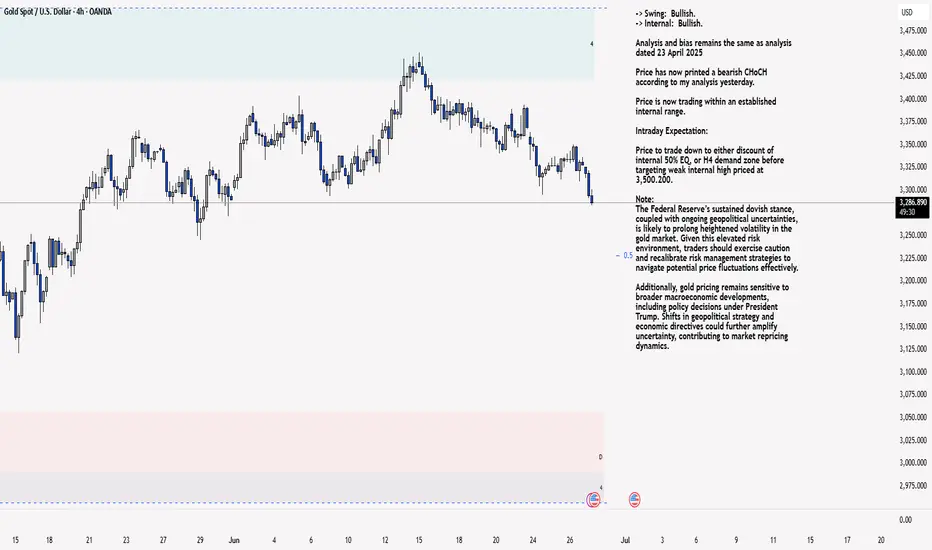
XAU/USD 27 June 2025 Intraday AnalysisH4 Analysis:
-> Swing: Bullish.
-> Internal: Bullish.
Analysis and bias remains the same as analysis dated 23 April 2025
Price has now printed a bearish CHoCH according to my analysis yesterday.
Price is now trading within an established internal range.
Intraday Expectation:
Price to trade down to either discount of internal 50% EQ, or H4 demand zone before targeting weak internal high priced at 3,500.200.
Note:
The Federal Reserve’s sustained dovish stance, coupled with ongoing geopolitical uncertainties, is likely to prolong heightened volatility in the gold market. Given this elevated risk environment, traders should exercise caution and recalibrate risk management strategies to navigate potential price fluctuations effectively.
Additionally, gold pricing remains sensitive to broader macroeconomic developments, including policy decisions under President Trump. Shifts in geopolitical strategy and economic directives could further amplify uncertainty, contributing to market repricing dynamics.
H4 Chart:
M15 Analysis:
-> Swing: Bullish.
-> Internal: Bullish.
Following previous high, and printing of bearish CHoCH, price has pulled back to an M15 supply zone, where we are currently seeing a reaction. Therefore, I shall now confirm internal high.
Price is now trading within an established internal range.
The remainder of my analysis shall remain the same as analysis dated 13 June 2025, apart from target price.
As per my analysis dated 22 May 2025 whereby I mentioned price can be seen to be reacting at discount of 50% EQ on H4 timeframe, therefore, it is a viable alternative that price could potentially print a bullish iBOS on M15 timeframe despite internal structure being bearish.
Price has printed a bullish iBOS followed by a bearish CHoCH, which indicates, but does not confirm, bearish pullback phase initiation. I will however continue to monitor, with respect to depth of pullback.
Intraday Expectation:
Price to continue bearish, react at either M15 supply zone, or discount of 50% internal EQ before targeting weak internal high priced at 3,451.375.
Note:
Gold remains highly volatile amid the Federal Reserve's continued dovish stance, persistent and escalating geopolitical uncertainties. Traders should implement robust risk management strategies and remain vigilant, as price swings may become more pronounced in this elevated volatility environment.
Additionally, President Trump’s recent tariff announcements are expected to further amplify market turbulence, potentially triggering sharp price fluctuations and whipsaws.
M15 Chart:
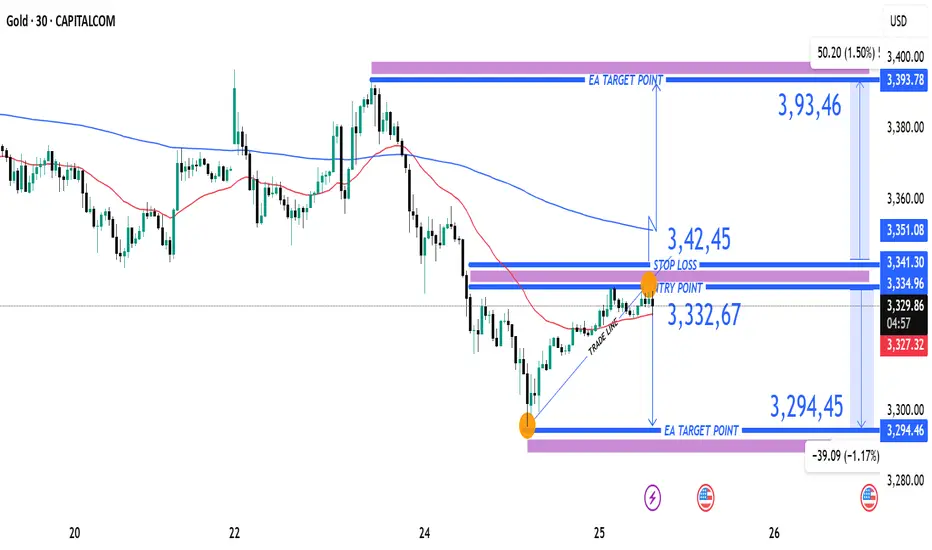
XAUUAD Reversal Setup Short Trade Opportunity Below Resistance Current Price: 3,327.56 USD
Entry Point: 3,332.67 USD
Stop Loss: 3,342.45 USD
Take Profit Levels:
Target 1 (Downside): 3,294.45 USD (-1.17%)
Target 2 (Upside): 3,393.78 USD (+1.50%)
🔧 Technical Indicators & Tools
Trade Line: Upward sloping trendline connecting higher lows, supporting recent bullish structure.
Moving Averages:
Red: Short-term (likely 50-period EMA)
Blue: Long-term (likely 200-period EMA)
Price is still trading below the long-term MA, suggesting broader bearish pressure.
Resistance Zone: 3,334.96–3,341.30 — a key supply area marked in purple.
Support Zone: 3,294.45 — identified as a previous demand level.
⚖️ Risk-Reward Analysis
Short Setup:
Entry: 3,332.67
Stop Loss: 3,342.45 (Risk ~10 USD)
Target: 3,294.45 (Reward ~38 USD)
R:R Ratio ≈ 1:3.8, which is favorable for a short trade.
📌 Summary
Bias: Bearish intraday
Setup Type: Short-sell at resistance zone
Confirmation: Price rejection or bearish candle near 3,334–3,342 zone
Invalidation: Break and close above 3,351.06 (upper resistance)
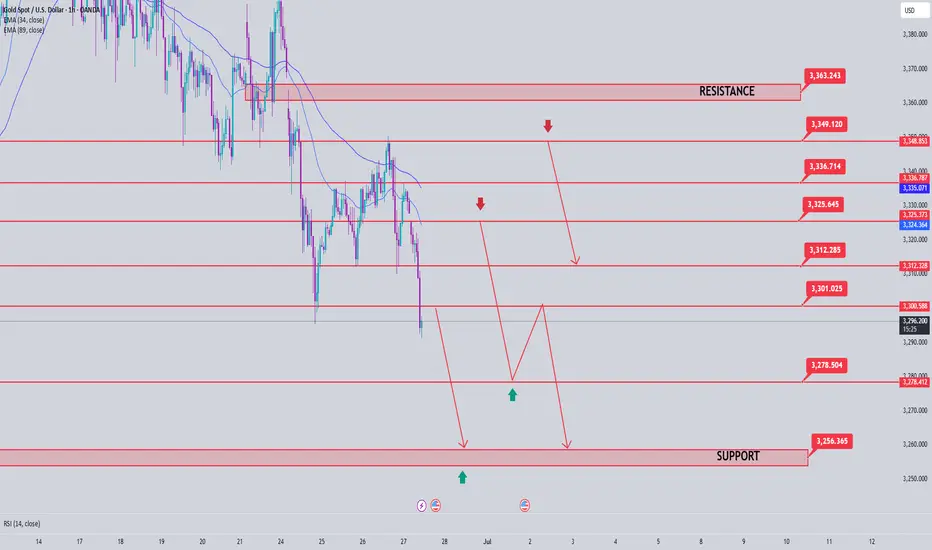
Gold Price Analysis June 27Daily Trend Analysis:
The price has reacted strongly at the 3348 level, forming a clear and sustainable bearish structure. The 3296 zone is now a critical level — a confirmed breakout below this area could lead to a deeper decline, especially with limited potential for recovery on Friday.
Today, the bearish trend is likely to face less resistance compared to the bullish side. As such, a move toward the support zones at 3278 and 3255 is highly probable.
Any bullish retracement during the European session should be viewed as a good opportunity to look for SELL setups, targeting 3278 and 3255.
As previously analyzed, SELL zones are clustered around key resistance levels. Traders should closely watch price reactions in these areas for potential entry signals.
🔹 Breakout key level: 3296
🔹 Support zones: 3278 – 3255
🔹 Resistance zones: 3300 – 3312 – 3325 – 3336 – 3348 – 3363
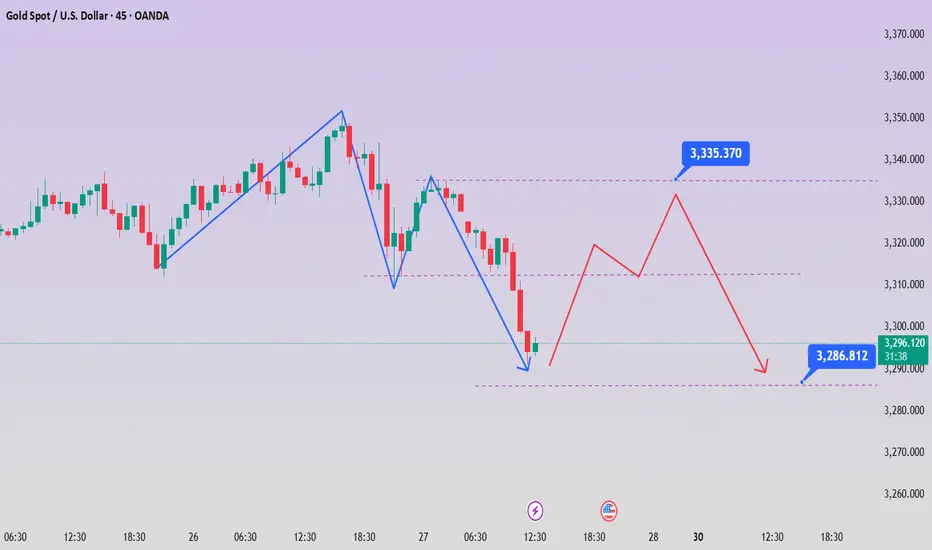
Gold fluctuated and fell, and the rebound was directly short
📣Gold News
Due to the easing of the situation in the Middle East, gold has fallen in the past few days, and the market has been eagerly looking forward to the interest rate cut, because the tariffs in the Trump era may push up inflation, but it has not come yet. "
On Thursday, the U.S. Department of Labor and Commerce issued key economic data, including initial jobless claims and the final value of real GDP in the first quarter. The number of initial jobless claims was 236,000, a decrease of 9,000 from 245,000 in the previous week, better than the market expectation of 245,000. At the same time, as of June 14, the number of continued unemployment claims in the week increased by 37,000 to 1.974 million, a new high since November 2021. Gold stopped below the moving average today. Gold did not continue the small positive line rise, and the decline continued during the U.S. trading period.
Today, focus on the continuation of short positions, comprehensive Labaron believes that gold is bearish today. For today's operation, consider rebound shorting as the main, and low long as the auxiliary.
📣 Pay attention to the resistance of 3330-3345 US dollars above
📣 Pay attention to the support of 3300-3280 US dollars below
💰 Go long near 3295-3285, target 3310-3320
💰 Go short near 3330-3340, target 3000-3290
If you have just entered the market, you are confused about the market of gold, oil and silver, and you always do the opposite operation direction and the entry price is unstable. I hope Labaron's article will help you.
Gold breaks down. It may reach a low point.From the current market daily chart
The absolute support of gold is around 3280. Gold is basically in the process of maintaining this daily trend support line. Therefore, I personally think that around 3280 is a long-short dividing line for gold. If gold falls below 3280 on the daily line, it is very likely that the decline will just begin. On the contrary, be careful. If 3280 does not fall below, there is still a possibility of rebounding.
In the 4-hour chart, from the high point of 3450 to now, the 0.382 position is just around yesterday's high point of 3350. The 0.618 position is at 3325, and the final 100% position is around 3280. 3280 also coincides with the daily chart.
Therefore, gold must at least test around 3280 today, and it is not ruled out that there will be lower positions.
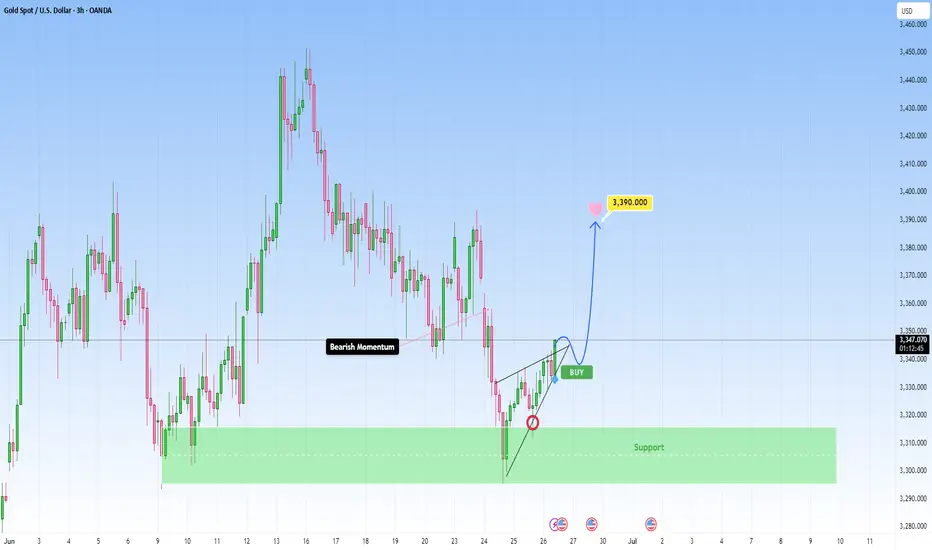
GOLD drops sharply to 3300 and found important support areaThe recent bearish momentum on GOLD has met a good support zone and at present we started to see early signs of bullish interest returning, right after we got a beautiful rejection from the zone.
Currently I’m expecting for the price to bounce to the target near 3,390 . If this bullish push continues with strong volume and momentum, I’ll be locking in that bias and planning my entry accordingly. I could get involved right here for a more aggressive entry. It’s a bit riskier, but if the structure confirms, I’m more than happy to take the shot, as sometimes the best trades come when you trust your setup.
This is not financial advice.
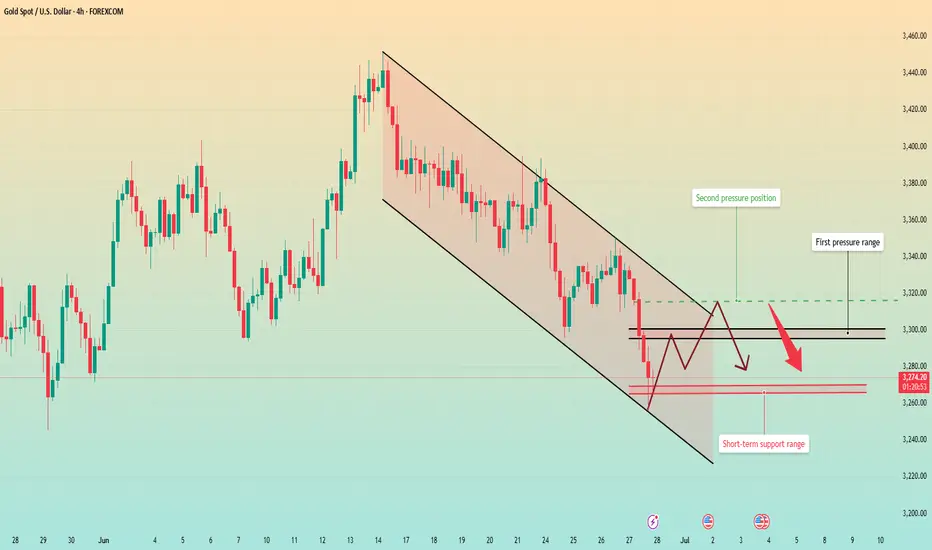
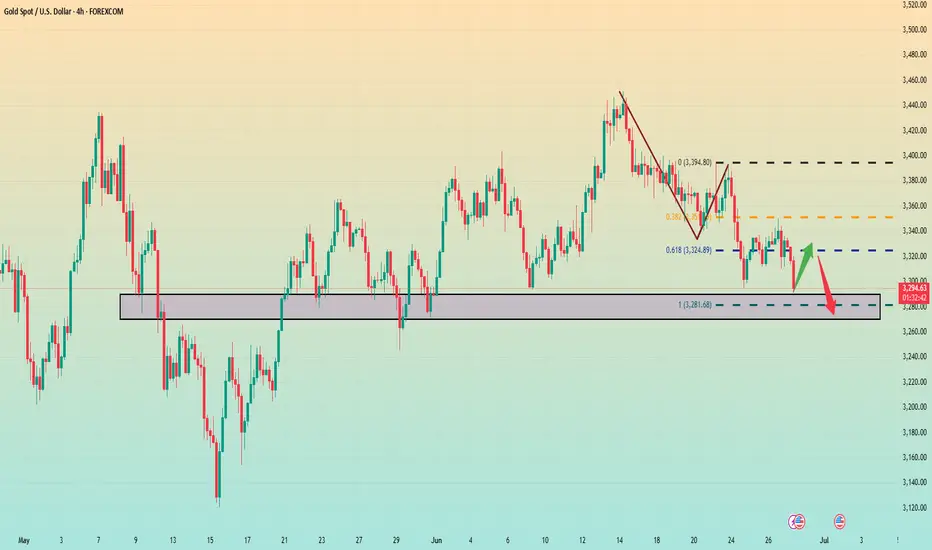
Gold Breaks Trendline – Deeper Correction Ahead?Gold (XAUUSD) has just broken below its short-term ascending trendline formed since mid-May. The candle closed around $3,333, confirming a bearish engulfing pattern and highlighting growing selling pressure after multiple failed attempts to reclaim the $3,383–$3,399 resistance zone (Fibonacci 0.5–0.618).
Key Levels to Watch:
- Immediate Support: $3,315 (tested twice before)
- Main Resistance: $3,383–$3,399 (Fibonacci zone)
- Major Resistance: $3,435–$3,451 (May high zone)
If $3,315 fails to hold, gold could retest $3,285–$3,270, with deeper downside toward $3,222.
Technical Overview:
- The ascending trendline is now broken.
- Bearish engulfing candlestick confirms momentum shift.
- Price rejected sharply from Fibonacci 0.618 – $3,399.
Trade Setups to Consider:
Sell Opportunity: Short near $3,360–$3,383; stop loss above $3,400; targets at $3,315 and $3,270.
Speculative Buy: Watch for reversal patterns near $3,315; stop loss below $3,300; short-term target $3,350–$3,365.
Caution: This week brings major U.S. economic events (GDP, PCE, Fed speeches). Trade reactively, manage risk tightly, and avoid overleveraging.
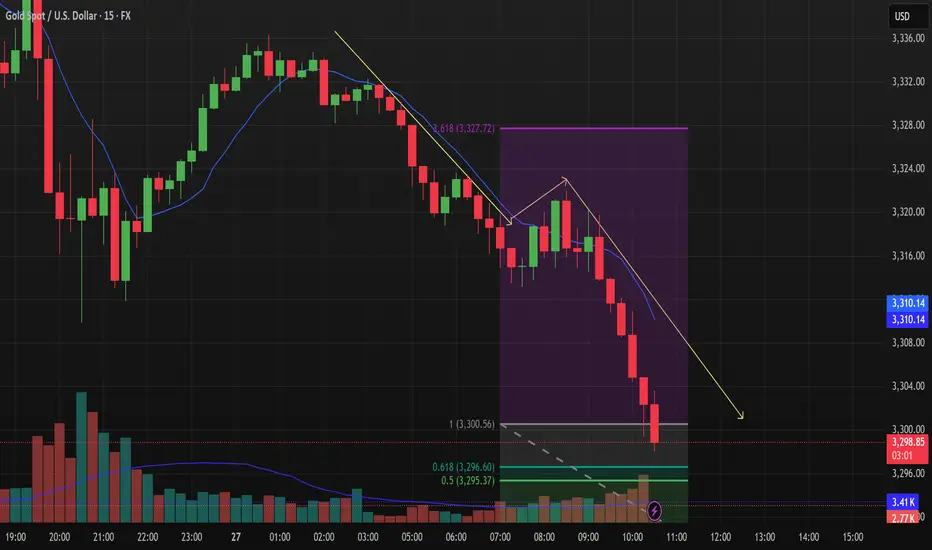
XAUUSD: Bearish Trend, Key Support at $3,295Market Overview
In today’s trading session (26/06/2025), XAUUSD shows continued downward momentum. Gold prices are currently hovering around $3,302.05, with a slight drop of 0.01%. The intraday price range has been tight, between $3,330.00 and $3,350.00, indicating a battle between the buyers and sellers around the short-term equilibrium zone.
Recent price action suggests that after a brief recovery, gold is once again encountering resistance at the $3,350.00 level. In the coming hours, a decisive breakout either above this resistance or below current support will dictate the market’s next move.
Key Technical Levels to Watch:
Support Levels: The first significant support is at the $3,295.37 level (50% Fibonacci retracement), with the next support at $3,296.60 (61.8% Fibonacci retracement), followed by a crucial level at $3,300.56.
Resistance Levels: The primary resistance area lies around $3,350.00, with the second resistance at $3,327.72, which coincides with the 3.618 extension of the previous price swing.
Price Action Analysis
As seen in the chart, XAUUSD is currently trading below both the 50-period (blue) and 200-period (yellow) moving averages, indicating a strong bearish trend. The price action is forming a series of lower lows and lower highs, reinforcing the downtrend.
Bearish Trend Continuation: A break below the support at $3,295.37 could signal further downside towards $3,290.00 or even $3,275.00. The yellow trendline indicates the overall bearish direction, and any failure to hold above $3,300.00 could trigger additional selling pressure.
Fibonacci Retracement Levels: Price is testing the 50% and 61.8% Fibonacci levels. A rejection at these levels could cause a pullback towards lower support zones, confirming the bearish outlook for the short term.
Volume Analysis
The volume chart shows relatively low volatility, with decreasing volume during the price pullbacks. This suggests that there is not enough buying interest to push the price higher, and the market may be more inclined towards bearish continuation in the near term.
Market Sentiment
Currently, the market is undecided. The recent price action suggests that traders are waiting for a confirmation of direction. The next few hours are critical in determining if the downtrend will continue or if we will see a short-term bounce at one of the key support levels.
Trading Strategy
Short Position: A break below $3,295.37 would be an excellent opportunity to short XAUUSD with a target at $3,290.00, and further down to $3,275.00.
Long Position: Only consider long positions if XAUUSD manages to break above $3,350.00 decisively, with the next target near $3,375.00.
Conclusion
XAUUSD remains under pressure, and unless there’s a strong reversal at support levels, the bearish momentum could continue in the short term. Traders should monitor the key levels mentioned above closely to adjust positions accordingly.
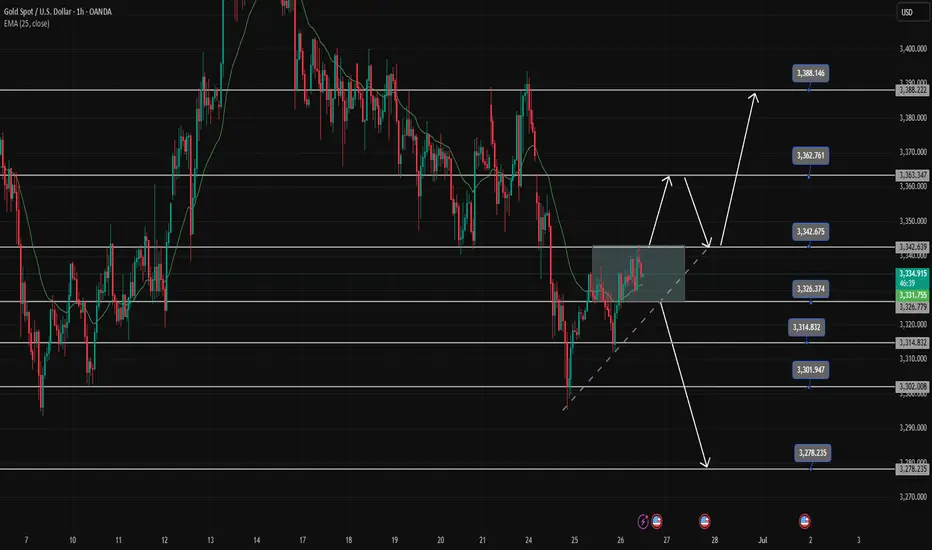
Gold Trading Strategy June 26✏️ D1 candle shows a recovery but not significantly. Gold is currently reacting at the key resistance zone of 3342.
The immediate support zone that the price is heading toward is 3326. This forms a breakout range between 3326 and 3342.
A bullish channel may form if there is a strong price reaction at 3326. Conversely, if 3326 is broken, it could confirm a continuation of the downtrend targeting 3302 during the European and US sessions today. The bearish target could even extend to 3278.
📈 Key Levels
Breakout Range: 3326 - 3342
Support: 3326 - 3314 - 3302 - 3278
Resistance: 3342 - 3363 - 3388
📊 Recommended Trade Setups
BUY: 3302–3300 | SL: 3297
SELL: 3363–3365 | SL: 3369
6.27 Risk aversion dissipates and gold prices adjust! The range As the Middle East war came to an end, the risk aversion sentiment in the global financial market subsided, the risk aversion funds dissipated, and the three major bullish markets of gold, crude oil, and silver all fell downward; at the same time, the US dollar index broke a new low !
Fundamentals:
1: The Middle East war has been temporarily paused, and both sides have entered the adjustment phase; however, irreconcilable contradictions may become the starting point of the next war at any time; although it has ended for now, we must not slack off. Once the two sides are on the verge of a war again, risk aversion will sweep the world again; this is not impossible;
This Middle East war came suddenly and ended suddenly; it was like a child's play washing the global financial market; therefore, the possibility of a resumption of war cannot be ruled out in the future;
At present, in the overall market:
1: In the short cycle, the gold price fluctuates downward, so in the short term, the short-term decline is seen, and the fluctuation is downward;
2: In terms of trend, the range is temporarily contracted, the BOLL of the daily K is contracted, the speed slows down, and the overall range is back to the range of fluctuations; there is no obvious long and short trend, and it returns to the range of fluctuations;
Today's technical trend chart:
1: In 4 hours, the stochastic indicator crosses downward, which is a main empty signal; in terms of form, it is temporarily under pressure from the central axis track of the 4-hour BOLL, and the empty trend continues downward, and the form tends to continue to oscillate downward; therefore, it is recommended to choose the high-altitude approach for 4 hours;
2: In the daily K, the stochastic indicator continues to cross downward, which is a empty signal; in terms of form, it is temporarily a broken Yin and Yang pattern, with no obvious trend; BOLL forms a contraction, the range of 3417-3277, the range is mainly in an oscillating trend, and the strong and weak dividing point is near 3347;
Comprehensive: The daily K is mainly in an oscillating trend, so it is recommended to deal with it according to the oscillating trend, choose to buy low and sell high; the reference pressure position is near 3347, the support position is near 3295 and 3278; the second pressure position is 3390-3400 pressure position; continue to choose the oscillating approach, and play a oscillating treatment of buying low and selling high;
