Non-farm data is expected to help gold recover from its decline! Gold prices rose sharply in the Asian and European sessions yesterday, and fell in the US session. The roller coaster-like trend at the end of the day gave up all the gains during the day, falling below the 3350 mark and touching the 3339 line. The daily pattern showed a trend of first rising sharply and then falling sharply. The technical daily chart has been alternating between positive and negative for four consecutive trading days. The New York market fell sharply and tested the 7-day moving average, but the price is still running above the 10-day moving average/7-day moving average.
The Bollinger Bands on the short-term four-hour chart closed, the RSI indicator's middle axis flattened, and the hourly chart's four-hour moving average was glued. From a technical perspective, gold intraday trading is arranged with a volatile mindset, and the intraday range is arranged with reference to 3328/3388. Today's fundamentals focus on the non-agricultural employment data released by the New York market. The previous value was 177,000, and the market estimate was only 130,000. According to the estimate, it is bullish for gold/silver.
This year has always emphasized that 2025 is a strong year for gold, and gold may enter an acceleration period of long-term structure this year. Tariff trade policies, geopolitical tensions, the Federal Reserve's interest rate decision, the decline in confidence in U.S. debt, and the increase in global central bank purchases have all affected the trend of gold as a strong safe-haven tool, and gold will have room to rise. Therefore, as long as the overall environment remains unchanged, gold is still an absolute bullish trend. Therefore, no matter how it is adjusted, now is an opportunity to enter the long position.
Gold fluctuated in the 3332-3392 range in the first three days of this week. During this period, our high-altitude and low-multiple layout was completed as expected. Then, today gold will remain in this range and fluctuate upward. If it rises above 3400 and stabilizes, it will look to 3500 above; if it breaks through 3330, it will look to 3280 below. Pay attention to the fluctuations before the release of non-agricultural data. Non-agricultural data will cause an increase in liquidity, so try to avoid it.
Key points:
First support level: 3342, second support level: 3328, third support level: 3303
First resistance level: 3376, second resistance level: 3388, third resistance level: 3410
Operation ideas:
Buy: 3340-3343, stop loss: 3332, target price: 3360-3370;
Sell: 3387-3390, stop loss: 3400, target: 3370-3360;
Goldpriceaction

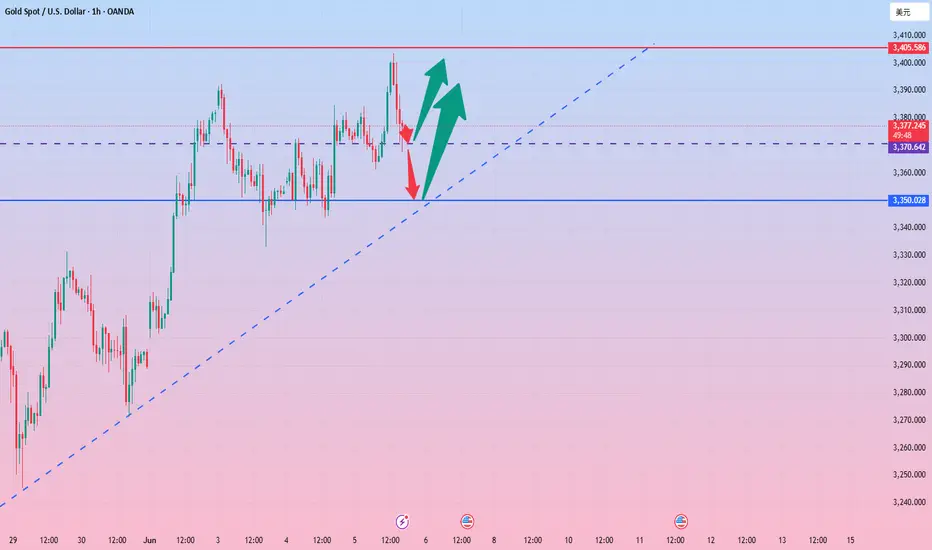
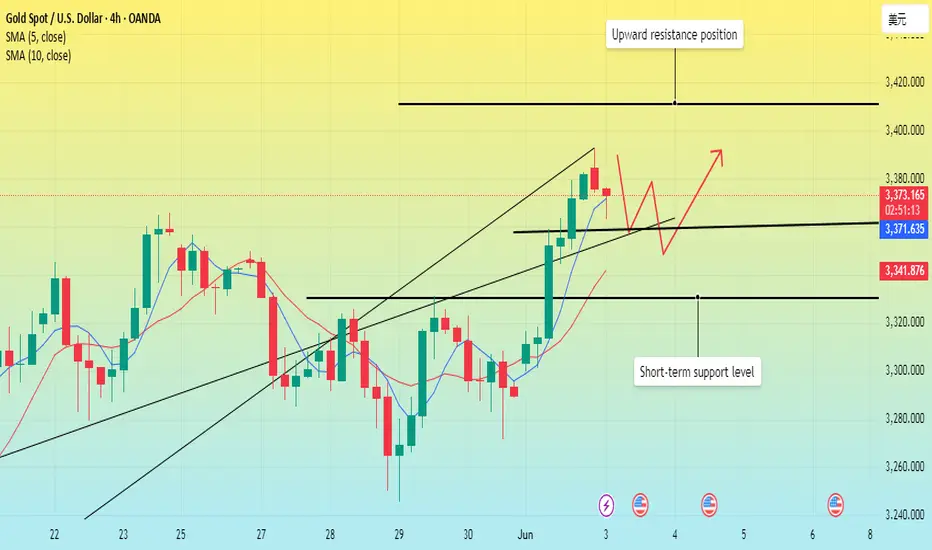
Today’s gold strategy: go long on support and short on pressure!Today, there is a high probability that the volatile bullish trend will continue. In terms of operation, we should seize the opportunity of short-term bullish. The key support level of the daily line is around 3350-3355. If it falls back to this level, you can arrange short-term bullish with a light position. If the market is strong and there is no obvious correction, you can enter the long position in advance at the 3370 line. Pay attention to the upper resistance level of 3400-3405. Once it breaks through effectively, wait for the opportunity to arrange short positions after the surge. In the volatile market, both long and short positions have opportunities. Don't chase the rise and sell the fall. Be sure to wait patiently for the right time to enter the market and strictly control the position.
Gold operation suggestions: short gold rebounds around 3400-3405. Go long gold when it falls back to around 3350-3360. Go long at 3370 first if it is strong and does not pull back.
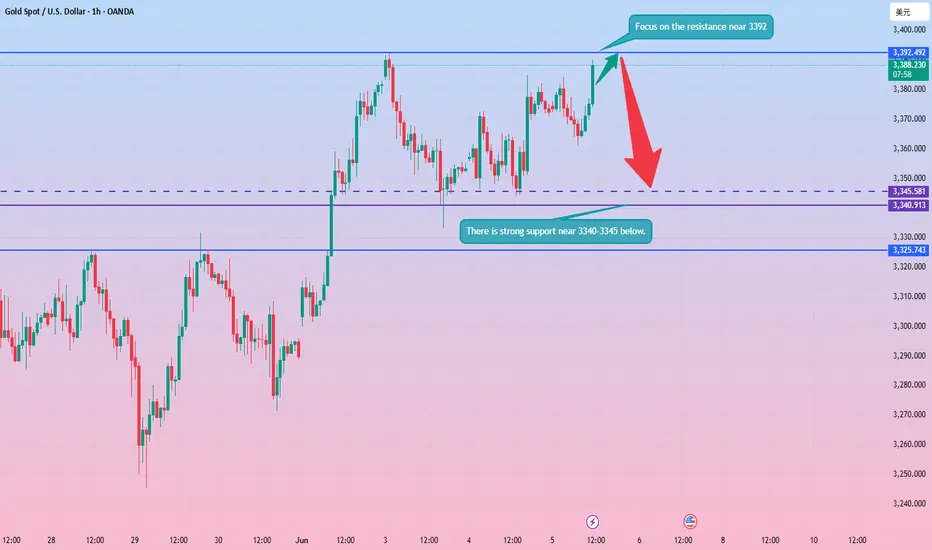
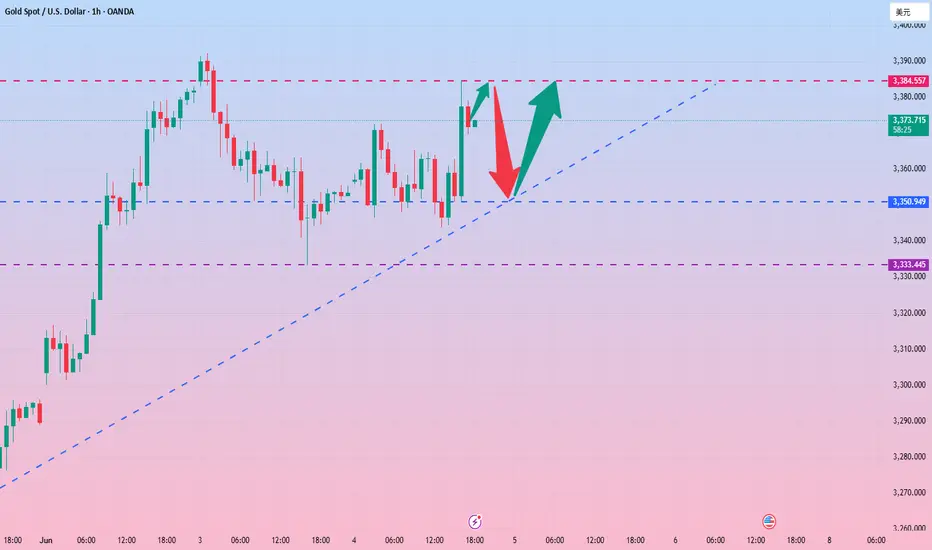
Double top pressure appears Gold short-term bearishThe current price shows a sign of hesitation after experiencing a sharp rise. The bulls hit a high of 3384 twice and then pulled back. The high point and yesterday's high point formed a double top suppression. Two attempts to test Monday's high of 3392 failed, indicating that the bullish momentum has weakened. The short-term high-altitude strategy for gold is mainly used. Pay attention to the key support of 3340-3345 below. If it is effectively broken, it may fall to the 3325 trend line conversion support level below. In terms of operation, it is recommended to rely on the double top pressure of 3384-3392 to arrange short orders at highs. Market volatility may intensify before the release of non-agricultural data.
Gold operation suggestions: short gold near 3384-3392, target 3370-3360.
US market fluctuates around 3400-3370, short first
📌 Driving events
Heightened tensions between China and the United States have also fueled the bullish momentum of gold prices. As the upcoming trade negotiations between Washington and Beijing are full of uncertainty, investors have sought safe-haven assets such as gold.
Adding to the market's nervousness, President Donald Trump signed an executive order to double the import tariffs on steel and aluminum from 25% to 50%, effective June 4. The move came a few days before Trump's much-anticipated call with Chinese President Xi Jinping, further fueling concerns about escalating trade frictions.
📊Commentary and analysis
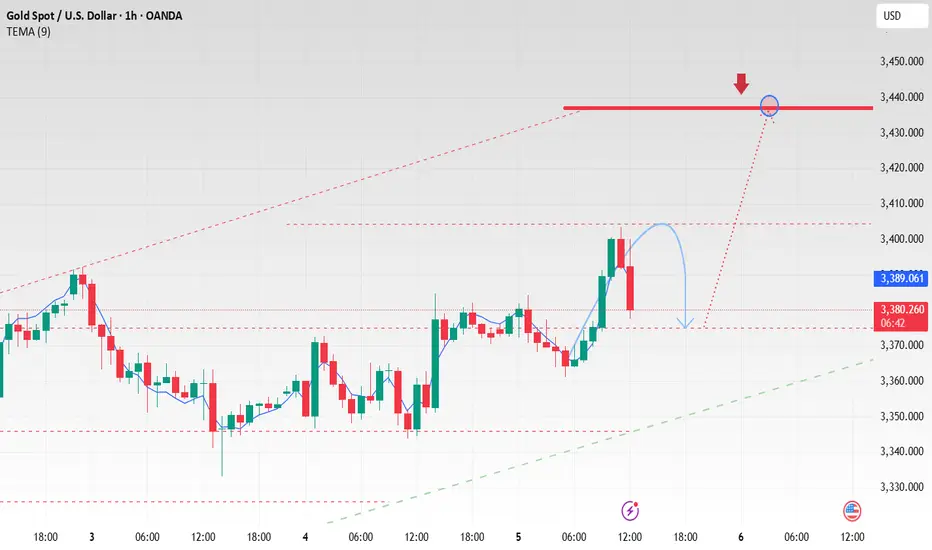
Gold failed to fall back to 3353 during the day, and the lowest point was 3360, and it ushered in an increase, and the highest point was 3403. In the short term, 3403 was suppressed, or it may fall back, and then it fell into volatility again. The idea is to suppress short positions around 3403, stop loss at 3413, and stop profit at 3380-3372. Short-term trading, pay attention to risks.
June 5th US gold short-term trading: short near 3400, stop loss 3413, light position, take profit 3375
Short near 3372, stop loss 3360, take profit 3400
⭐️ Note: Labaron hopes that traders can properly manage their funds
- Choose the number of lots that matches your funds
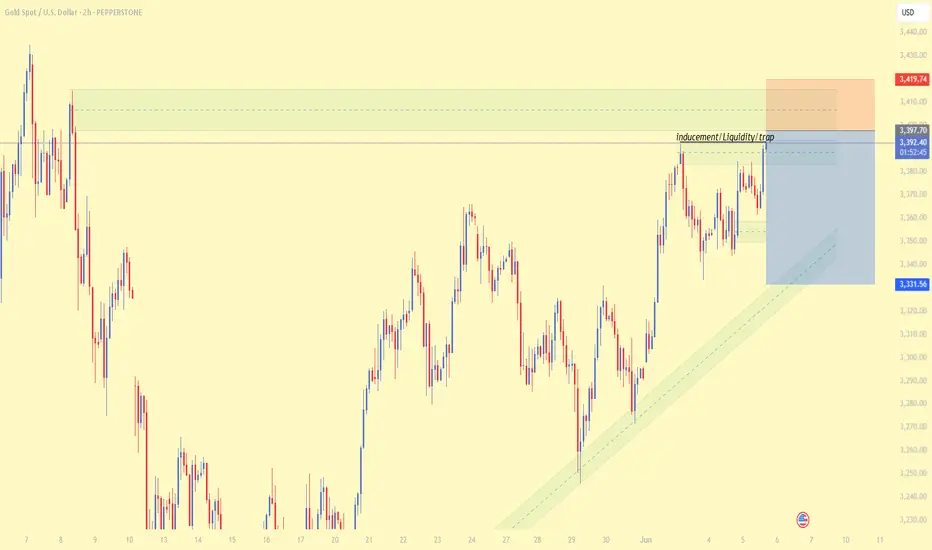
Gold Price ActionHello traders, hope you're all doing well!
Here's a straightforward setup that could yield 100–200 pips with ease.
Price has entered the inducement or "trap" area, but the true sell zone lies just above.
Look to enter short positions from that higher level and aim to capture some solid pips.
Gold points to 3400, madness before data release.Market analysis:
Gold fell slightly to around 3361 in early trading on Wednesday. After falling to around 3346, it quickly rose to around 3372, then was blocked and fluctuated and fell. It fell to 3344 in the European session and then rebounded. It rose strongly to 3384 in the US session and fluctuated above 3370 in the late trading.
The daily line of gold showed a trend of alternating yin and yang. But the overall trend was upward. The 5-day moving average and the 10-day moving average formed a golden cross and extended upward, which provided moving average support for the gold price, allowing gold to maintain a strong and volatile trend. At present, the 5-day moving average is around 3352, and the 10-day moving average is around 3335. The first thing to pay attention to is the resistance of Tuesday's high of 3392. If the gold price can break through this resistance level, it is expected to continue the bullish trend.
In terms of points, first pay attention to the support near MA5/MAA10 below, and focus on the support of MA20 moving average. The downward exploration on Tuesday and Wednesday both defended the MA20 moving average position. Above this, it is treated as a strong shock. Secondly, pay attention to the support near 3335, which is the low point on Tuesday and the key to the short-term structure. Secondly, pay attention to the support near 3335, which is the low point on Tuesday and the key to the short-term structure. First pay attention to the resistance near 3395 above, and then pay attention to the resistance near 3415 and 3430, which are the previous high points.
Operation strategy:
Short near 3395, stop loss 3410, profit range 3380-3360
Long near 3360, stop loss 3350, profit range 3375-3380-3390-3400.

Although the market fluctuates, the rhythm is not chaotic.Today's public strategy suggested shorting gold at 3365, and accurately predicted the retracement of the resistance level again. The brothers who followed up again reaped good rewards. Then arranged long orders in the 3344-3345 range, and exited the market at 3360 after the market fell and rebounded; then arranged short orders at 3360-3361, and fell again under pressure, and successfully took profits at the target of 3350. Although the short-term fluctuations were large, we finally managed to grasp the rhythm steadily and reaped ideal profits.
Judging from the current trend, as long as the short-term gold market is above 3330, gold will still be in a strong bullish trend. On the contrary, if it falls below the closing line near 3330, it will break the trend line, and the subsequent market will most likely form a weak shock pattern. Therefore, the current operation is actually very simple. As long as the 3330 position is not broken, you can rely on the 3330 area to enter the market and do more. Pay attention to the support near yesterday's low point of 3333 below, and pay attention to the resistance near 3380-3390 above.
Gold operation suggestions: It is recommended to short gold with a light position near 3380-3385, with a target of 3370-3360, and go long near 3345-3350 when gold falls back, with a target of 3360-3370.
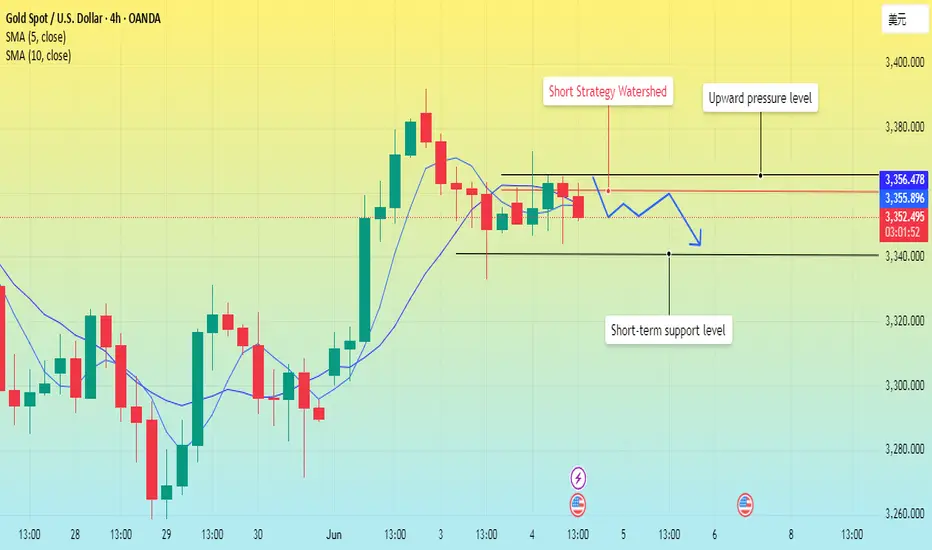
Gold fluctuates. It is expected to retreat.Gold continued its strong performance on Monday in the early trading yesterday and reached a high of around 3391 before starting to fall all the way. It was weak and downward in the European trading. The US trading quickly fell back to around 3335 and then rose again. However, it touched the 3372 line again in the morning and continued to fall, forming a large range of fluctuations.
Affected by the ADP data, although the positive impact is large, it is very likely to be just an illusion given to the market, not to achieve a strong effect. The key pressure position above is maintained at around 3360, which may play the role of a watershed between long and short positions, and the strong pressure above will also be maintained at 3365; the support position below is around 3340. Once this position is broken, the room for decline may be expanded in the later period.
Although the MA5-day and 10-day moving averages have the intention of forming a golden cross, they have not completely released the energy of the bulls, making the market more unpredictable for the bears. In the correction of the bulls' strong upward movement, there was no further effort. Perhaps this is one of the signs of bull exhaustion. The current channel position formed from 3391 also gives the bulls enough pressure. Only by breaking through this position again can a strong upward trend be achieved.
Operation strategy:
Short near 3360, stop loss 3370, profit range 3345-3330.
If the direction is unclear, don’t panic, respond flexibly!Gold has been showing a daily yin-yang alternating pattern since last Wednesday, but the overall rising rhythm has not been broken. The MA5-day moving average and the MA10-day moving average formed a golden cross and continued to extend upward. The arrangement of this moving average system provides a certain support momentum for the gold price. During the day, we need to focus on the support effect of the moving average. The current 5-day moving average is near 3340, and the 10-day moving average is near 3325. These two positions constitute an important support area for the short-term gold price correction. In terms of upper resistance, first pay attention to yesterday's high of 3392. If the gold price can break through this resistance level, it means that the upward momentum is strong, and it is expected to continue to be strong to 3400-3420, further opening up the upward space.
From the 4-hour chart, as long as the short-term gold market is above 3330, then gold is still in a strong bullish trend. On the contrary, if it falls below the closing line near 3330, then it is a broken trend line, and the subsequent market is likely to form a weak shock pattern again, so the current operation is actually very simple. As long as the 3330 position is not broken, you can rely on 3330 to enter the market and do more. Focus on the support near yesterday's low of 3333 below, and focus on the resistance near 3375-3380 above.
Gold operation suggestions: It is recommended to short gold near 3365-3375, with a target of 3350. Go long gold when it falls back to 3335-3345, with a target of 3360-3370.

Gold price returns to 3400?
📣 Gold Information
Gold prices gave up some of Monday's gains on Tuesday, falling more than 0.80% as strong U.S. labor market data reinforced expectations of a strong economy and put pressure on the non-yielding metal. As of writing, XAU/USD was trading around $3,348, hitting an intraday high of $3,392.
Investor sentiment picked up after the latest U.S. Job Openings and Labor Turnover Survey (JOLTS) showed a sharp increase in job openings in April, indicating a continued tight labor market. The optimistic data came this week, which will see a series of key employment reports released, including the ADP employment change data for May released on Wednesday and the much-anticipated non-farm payrolls data on Friday, both of which could affect expectations of Fed policy.
📊Comment Analysis
Gold prices maintain bullish momentum, tariff momentum coupled with current unfavorable economic data
💰Strategy Package
🔥Sell Gold Area: 3411-3413 SL 3418
TP1: $3400
TP2: $3390
TP3: $3380🔥
Buy Gold Area: $3332-$3330 SL $3325
TP1: $3345
TP2: $3358
TP3: $3370
⭐️ Note: Labaron hopes that traders can properly manage their funds
- Choose a lot size that matches your funds
- Profit is 4-7% of the capital account
- Stop loss is 1-3% of the capital account
Asian session main long and auxiliary short operation
📣Gold information
There are two main reasons for the rise in international gold prices: First, global trade frictions have intensified. Trump said that he would raise tariffs on steel and aluminum. The EU strongly opposed it and prepared to implement countermeasures. Brazil is also ready to counter, and the market is worried that the United States will resume the "big stick" of tariff policy; second, in terms of geopolitical conflicts, the market is worried that the conflict between Russia and Ukraine will escalate again. Overall, the medium- and long-term rise in gold has not changed, and there is still uncertainty as to whether it can successfully break through the resistance level in the short term.
📊Comment analysis
Today, we need to pay attention to the support effect of the moving average. The current 5-day moving average is near 3340, and the 10-day moving average is near 3325. These two positions constitute important support areas for the short-term correction of gold prices. In terms of upper resistance, pay attention to yesterday's high of 3392. If the gold price can break through this resistance level upward, it means that the upward momentum is strong, and it is expected to continue the strong trend and further open up the upward space.
In terms of points, pay attention to the support near yesterday's low of 3333 below, and the resistance near 3360 and 3370 above.
💰Strategy Package
🔥Sell Gold Zone: 3365-3370 SL 3375
TP1: $3355
TP2: $3340
TP3: $3325
🔥Buy Gold Zone: $3325-$3330 SL $3320
TP1: $3345
TP2: $3355
TP3: $3365
⭐️ Note: Labaron hopes that traders can properly manage their funds
- Choose the number of lots that matches your funds

Gold-Asian market rises, what is the trend?Event summary:
On Wednesday in the Asian market, spot gold fluctuated slightly and is currently trading around $3,370/ounce.
There are two reasons for the strong rise in the Asian market: 1. Ukraine directly blew up 41 Russian fighter jets; 2. The tariff storm re-emerged, and Trump is expected to impose a 50% tariff on steel and aluminum. The tense international situation and tariff storm have become important factors that disrupt the market.
Market analysis:
The four-hour chart shows that the current price is still running above the middle track of the Bollinger Band channel, and the MA10-day moving average and the 5-day moving average are running above 3,340. Due to the wide fluctuations in the market, short-term participation is the main option. Intraday callbacks are still mainly low and long.
Gold rebounded directly in the early trading, and the center of gravity of the low point of the rebound is also constantly moving up. From the current market, the short-term gold price has stabilized above the top and bottom conversion position of 3,340, and it also remains above the rising trend line, and the bulls are strong.
In the early trading, the gold price fell back to the lowest level of 3346, and it formed a Yang-enclosing-Yin pattern, which means that the bulls' energy is relatively strong. We only need to pay attention to two points in the early trading, namely the key level of 3330 and the short-term support level of 3346. If it falls back to around 3350 during the trading session, we will start to go long.
Operation strategy:
Short at 3375, stop loss at 3385, target 3340-3320;
Long at 3345, stop loss at 3333, target 3370-3400;
Gold prices have fallen back, so it's time to take action.I reminded all traders in the morning to be alert to the risk of gold falling back today. Now it has successfully reached the point I predicted in the morning; it's time to adopt a long strategy.
From the daily chart of gold:
The current price has fallen back to around 3335, which happens to be the support position of the daily trend line. This is why we are bearish on gold.
As long as the US stock market closes above 3335, gold will still be in a long trend. On the contrary, if it falls below the closing line of 3335 today, it will break the trend line, and the subsequent market may be more complicated. Therefore, the current operation can adopt a long strategy. Long positions are entered near the support level.
If gold once again stabilizes above 3,400, then there is a possibility that it will reach a new high.
Operation strategy:
Enter the market at the current price, stop loss 3330, profit range 3350-3365.

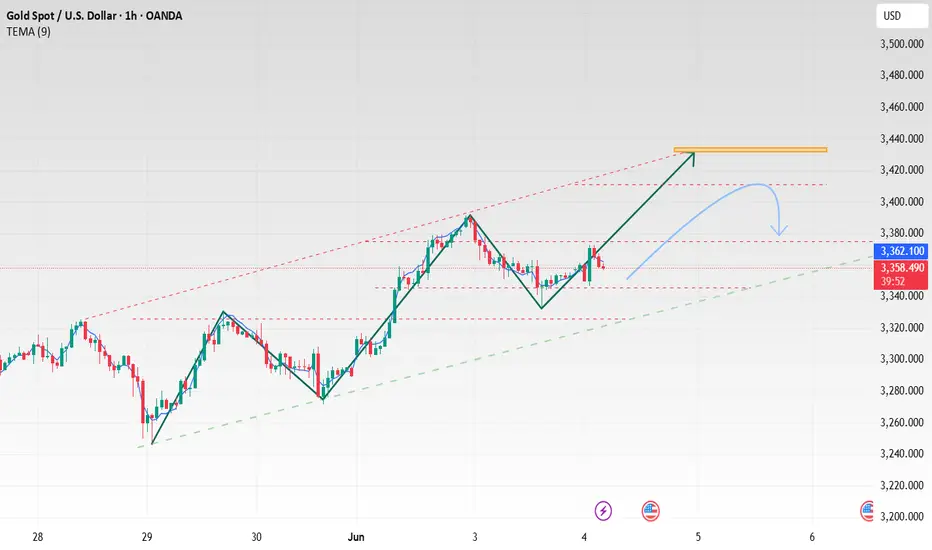
Gold is taking a break, the next wave will be even stronger.Gold opened at 3382 today and rebounded to 3392 for a technical decline adjustment. So far, gold has hit a low of 3351. Currently, gold continues to fluctuate around 3360. We will pay attention to the support situation at 3345-50 below. If it does not break through, we will look for opportunities to go long.
Judging from the current trend of gold prices, the overall bullish trend remains, and there is still the possibility of further upward movement in the short term. The support below focuses on the 3345-3350 area, which is an important defensive position for short-term bulls. If it falls back to this area and stabilizes during the day, you can continue to rely on this position to arrange long orders, and the bullish thinking remains unchanged. Pay attention to the 3395-3400 first-line pressure above. If this range is effectively broken, the gold price is expected to hit the previous high and further open up the upward space. From the daily level, the market is still in the "low-long" rhythm of the trend, and it is expected to maintain a volatile upward trend in the short term. The recent market fluctuations are large. In terms of operation, it is necessary to strictly control the position and pay attention to risk prevention.
Gold operation strategy recommendation: Go long when gold falls back to 3345-3355, target: 3380-3390.

Prices exploded. Beware of falling support.Information summary:
Russia and Ukraine held a second round of peace talks on Monday. The two sides only agreed on the exchange of prisoners.
No breakthroughs have been made on the proposed ceasefire agreement that Ukraine, its European allies and Washington have called on Russia to accept.
Umerov said Ukraine proposed more talks before the end of June, but believed that only a direct meeting between Zelensky and Putin could resolve the differences between the two sides on several key issues. Secondly, Trump's tariff issue has escalated global trade tensions, and the intensification of the Russian-Ukrainian conflict has also caused geopolitical risks to rise rapidly.
Market analysis:
Gold has stretched directly from 3290 at the beginning of the week to a high of 3391, a $100 increase.
From the perspective of the daily gold line, it is indeed in a bullish trend, breaking through several important pressure levels. But I think all traders need to be wary of chasing more at high levels.
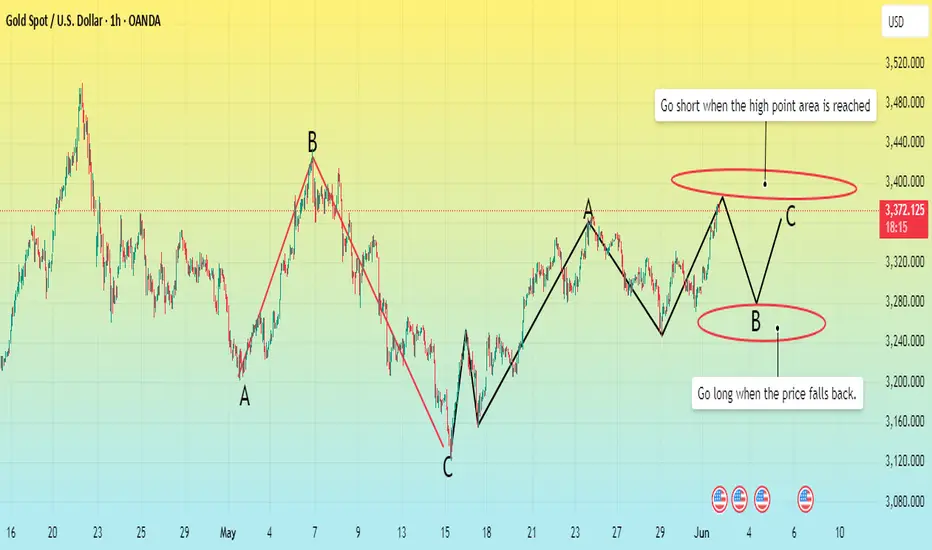
The daily trend of gold started from 3120. 3120-3365 is the a wave, 3365-3242 is the retracement of the b wave. So the current trend from 3242 is the rise of the c wave. After breaking through 3340 on Monday, gold has reached 3396 near the 618 position.
At present, if gold cannot stand above 3400, it is very likely to maintain the consolidation in the 3396-3340 range.
Especially before the release of non-agricultural data this week, such a large fluctuation range. Be sure to be alert to the possibility of continuing to fall back to the support of 3340-3330.
Operation strategy:
If the price falls back to around 3340-3350, go long, stop loss at 3330, and profit range at 3370-3380.
Of course, if you prefer aggressive trading, you can choose a short strategy at 3370-3380, stop loss at 3390, and profit range at 3340-3330.

After the price surge, has the trend of gold changed?Gold opened slightly higher in the Asian morning on Monday and then rose. It basically maintained a slow and volatile rise throughout the day. It rose to around 3383 before the close, and the daily line closed with a big positive line.
The current 5-day moving average and the 10-day moving average form a golden cross and extend upward. This signal indicates that the short-term trend is strong. In the short term, we need to focus on the moving average support. The 5/10-day moving average support is in the 3330-3325 area. As long as the price remains above this area, it can be treated as strong. The upper resistance level needs to pay attention to the previous secondary high point of 3438.
In terms of points, the lower support level first looks at around 3360, which is the previous high point of the short-term. After breaking through, we need to pay attention to the top and bottom conversion. The second is the 3330-3325 area support. Pay attention to the top and bottom conversion. If the price falls back strongly, we need to pay attention to the 3300 mark support. This is the current support area of the trend line formed by the low point connection of gold since the rise of 3120.
The upper resistance level is around 3410, followed by the resistance in the 3448-3458 area. This area is the current resistance area of the rising channel formed by the high point since the rise from 3120.
Operation strategy:
Short at current price, stop loss at 3390, profit range 3360-3340;
Long at price drop to around 3340, stop loss 3325, profit range 3345-3360.
Gold surges, what is the subsequent trend?Weekly chart analysis:
From the weekly chart, gold has been pushed upward for five waves from the starting position of 1614. The current market is in the extended wave of wave 3. Gold has adjusted downward from the high point of 3500. The current market is divided into two situations.
In the first case, assuming that the high point of 3500 has completed the 3rd wave, then 3500 will adjust downward for 4 waves. The three-wave ABC structure within the 4th wave regards 3500-3120 as wave A, 3120 upward as wave B, and there is another wave C decline after wave B to complete the 4th wave adjustment, and then the 5th wave will rise. Therefore, after the market rises, pay attention to the C wave decline at any time.
In the second case, assuming that the 3rd wave has not been completed yet, 3500 is still in the internal adjustment of the extended wave of wave 3. At present, the three-wave ABC adjustment of 3500-3120 has ended, and a new round of upward rise from 3120 may complete the last wave of the 3rd wave. Therefore, after the market rises above 3500, it will face the 4th wave decline at any time.
Hourly chart analysis:
In the 1-hour chart, no matter how the market operates, the current market trend is in a state of shock. Affected by the increased risk aversion due to the weekend news, the market rose sharply after opening on Monday. So what will the trend be after the surge? I think that after the rise, try not to chase the rise, but look for high positions to short, and wait for the market to adjust downward before going long.
Operation analysis:
Currently, the upper resistance is 3385-3405, and the lower support is 3350-3330. Short-term operation suggestions: short at the high point area of 3385-3395, stop loss at 3410, profit range 3360-3350, and continue to look down at 3330-3320 if it breaks. It is recommended to continue to look above 3400 if 3350 is not broken.
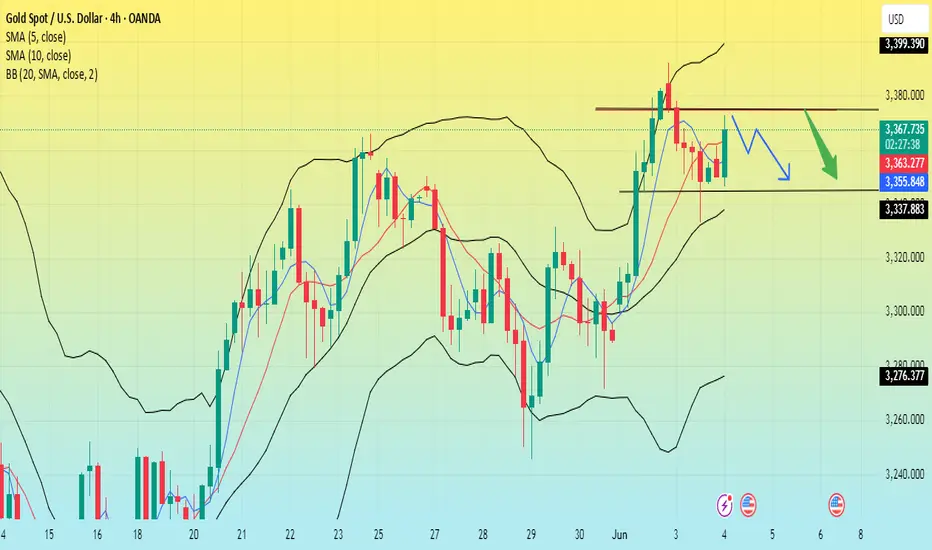
Short position opportunity at 3366 suppression pointAt present, the focus of gold is on the previous high point of 3360-3366. If the rebound fails to effectively break through this range, you can consider entering a short position. Although gold is in a high-level oscillation stage, you should not blindly chase more. If the upper suppression continues to be effective, there is a risk of a technical correction. If you encounter confusion in operation, please feel free to communicate at any time; if the current gold operation is not ideal, I hope to help you avoid risks and reduce investment detours. I look forward to your contact.
From the perspective of the 4-hour cycle, the upper resistance focuses on the 3360-3366 line, and the short-term support below focuses on the 3320-3325 area. It is recommended to keep operating in line with the trend and follow the main trend unchanged.
Operation strategy: When gold rebounds to the 3360-3366 line and fails to break through, arrange short positions, and target the 3320-3325 range.

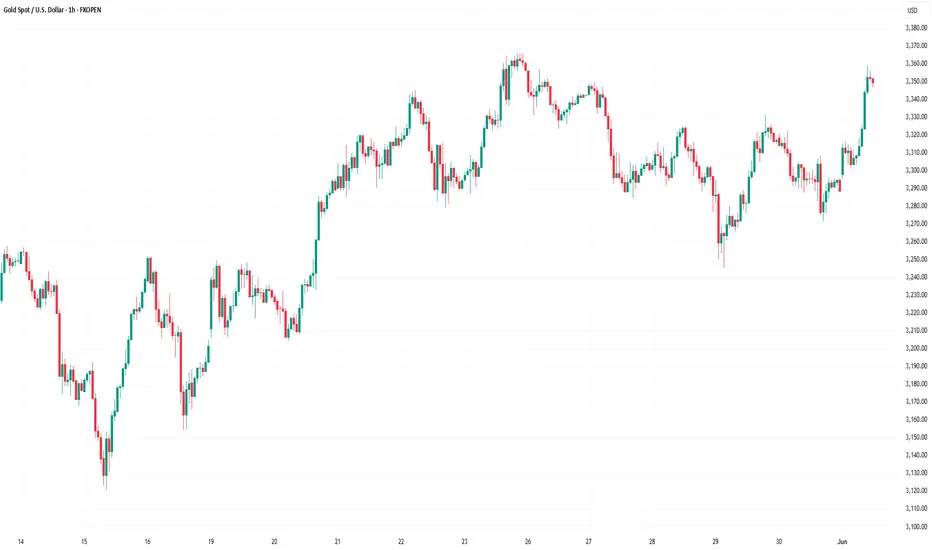
Market Analysis: Gold Price Could Gain Bullish PaceMarket Analysis: Gold Price Could Gain Bullish Pace
Gold started a fresh increase above the $3,300 resistance level.
Important Takeaways for Gold Price Analysis Today
- Gold price started a steady increase from the $3,250 zone against the US Dollar.
- A connecting bearish trend line is forming with resistance at $3,318 on the hourly chart of gold at FXOpen.
Gold Price Technical Analysis
On the hourly chart of Gold at FXOpen, the price found support near the $3,250 zone, formed a base, and started a fresh increase above the $3,280 level.
The bulls cleared the $3,300 zone and the 50-hour simple moving average. There was also a move above the 61.8% Fib retracement level of the downward move from the $3,331 swing high to the $3,271 low. The RSI is now above 50 and the price could aim for more gains.
Immediate resistance is near the 76.4% Fib retracement level of the downward move from the $3,331 swing high to the $3,271 low at $3,318. There is also a connecting bearish trend line forming with resistance at $3,318.
The next major resistance is near the $3,330 level. An upside break above the $3,330 resistance could send Gold price toward $3,382. Any more gains may perhaps set the pace for an increase toward the $3,400 level.
Initial support on the downside is near the $3,300 zone. If there is a downside break below the $3,300 support, the price might decline further.
In the stated case, the price might drop toward the $3,270 support. The next major support sits at $3,250. Any more losses might send the price toward the $3,220 level.
This article represents the opinion of the Companies operating under the FXOpen brand only. It is not to be construed as an offer, solicitation, or recommendation with respect to products and services provided by the Companies operating under the FXOpen brand, nor is it to be considered financial advice.
Trade conflicts are re-emerging, will gold rise?Information summary:
Gold prices rose slightly in early Asian trading on Monday, affected by the long-term uncertainty of tariffs and international geopolitical conflicts, which increased the demand for safe-haven assets.
Trump made a statement earlier that China had violated the Sino-US trade negotiation regulations in a big way; then the US Treasury Secretary assured that the United States would never default. This has once again led to tensions in Sino-US trade relations, and investors are also cautious about this news.
This news has undoubtedly disrupted the international market and supported the rise in gold prices.
Traders need to pay attention to the May ISM manufacturing report to be released by the United States today, which may affect the new trend of gold.
Trading analysis:
I think the repeated emotions of the United States on tariffs will cause gold prices to rebound after a downward adjustment, and then fall slightly.
If gold cannot break through the upward 3350 cycle pressure level strongly and stabilize above this position. Then the price will fall back below this position.
Operation strategy:
Long at 3340, stop loss at 3330, take profit at 3350.
Short at 3350, stop loss at 3365, profit range is around the early support level of 3300-3390.
If you want to trade steadily, you can continue to wait and see for some time, because there are too many black swan events in the Asian market today, and the market is full of uncertainty.

The international situation is turbulent, how is the trend of goInformation summary:
On June 1, Russia and Ukraine continued to clash. Ukrainian drones attacked several Russian military airports, including military bases in eastern Siberia, more than 40 aircraft were damaged, and the loss was about 2 billion US dollars. This was the first time that a military base in Siberia was attacked by a drone. Murmansk Oblast was also attacked by a drone on the same day.
However, on the same day, Russia and Ukraine planned to hold a second round of ceasefire negotiations in Istanbul on June 2. The United States said that it was not informed of the Ukrainian attack in advance. Russia and the US Foreign Minister discussed the negotiation plan by phone. The Hungarian Prime Minister revealed that the mediation in 2024 was unsuccessful, and the two sides had obvious differences on the timing of the ceasefire.
The current situation is complicated, the prospects for peace talks are unclear, and market risk aversion and economic data (this week's employment report, central bank interest rate decision, etc.) have become new focuses.
Gold trend analysis:
From the daily chart, the current daily support position is around 3280. This position is the key to the gold band trend. Since the price has broken upward recently, it has stepped back many times and finally closed above the daily support, so the position of the daily support is still the key. Before falling below this support level, the price will most likely maintain a range of 3320-3280 US dollars.
Operation strategy:
Buy near 3280, stop loss 3270, profit position 3320.

The volatility is an illusion, and gold is brewing major changesGold fluctuated downward in the Asian session on Friday, while it remained in the range of 3287-3303 in the European session. Although it tried to break through the short-term pressure level of 3300-3306 many times, it has never been able to stand firmly. I arranged to go long at 3288-3289 in advance, notified to enter the market at the point, and finally reached the target of 3303 perfectly, earning 15 points of profit! Quick, accurate and ruthless, with the right idea, profit-taking is as easy as drinking water! Therefore, it is recommended that we continue to pay attention to the short-term support of 3290-3285 below. If the price fails to break through the support range like in the early trading, you can consider trying to enter the long position.
Given that today is Friday, the market volatility may be "demon-like", so you need to be extra cautious in operation and pay close attention to the changes in the market. At the same time, you must keep in mind the principle of "taking profits for safety"-lock in profits in time when you can see them, and don't easily bet on trends that you don't understand. If your current gold operation effect is not ideal, I hope my analysis can help you avoid some detours. Welcome to communicate at any time!
Today, the monthly, weekly and daily lines closed simultaneously. At the same time, the PCE data will be released during the US trading session, and the market volatility may intensify.
From a technical point of view, 3285 is also the key to long and short today. If gold does not break 3285 today, the strength of gold bulls is expected to continue, and there is still room for gold to move upward. If gold continues to fall and falls below 3285, then gold may begin to fluctuate in a large range. The upper resistance is in the 3320-3330 area, and the focus is on the 3335-3340 line of suppression. Pay attention to the 3290-3285 line of support below, and the key position below is in the 3280 area. If it breaks below the 3280 area during the day, the market is expected to fall again to the 3265-3250-3240 area.

The dollar is strong, will gold break through the consolidation?At the beginning of this week, the US dollar index fell to a one-month low due to Trump's sudden change in the direction of the EU policy. Subsequently, due to the contest between Trump and the US Trade Court ruling, the prices of gold and the US dollar fluctuated greatly.
I think the US dollar will start to rise next week with the help of non-farm payrolls data. I am afraid that a new round of price fluctuations is coming.
If the US dollar is to have a new upward trend in June, gold will also be affected. Judging from the current daily line of gold, the overall trend is also to be adjusted downward.
The high point of gold in May was 3438, and the low point was 3120. I also drew the Fibonacci dividing line in the figure. The most critical position is 3317 at the 0.382 position and 3280 at the 0.5 position.
Gold is still maintaining a consolidation of 3317-3280. Although there have been breakthroughs above and below, they are all within the daily range. Next week, as long as gold can close below 3280 on the daily line, it will start a correction trend step by step. The first target below is around 3250, and the second is 3180-3200.
As long as the daily line of gold can close below 3180, then we will usher in a big bearish trend at the daily level. On the contrary, the daily line of gold cannot close above 3317 again. In a better situation, it may touch around 3340 again and then retreat again.
The bad result is that it directly breaks through the pressure level and stands above the 3340 trend line. If this happens, the price of gold may move towards a new high.
