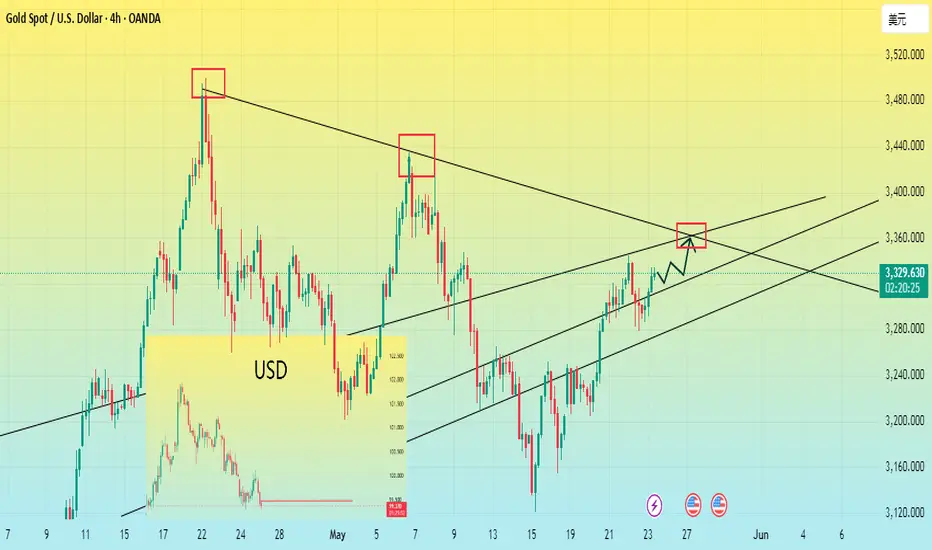
Short term is still dominated by short positions!Although the easing of trade tensions in the short term has led to a correction in gold prices, the three core factors supporting the strength of gold still exist: expectations of loose global monetary policy, rising geopolitical risks, and the long-term weakening trend of the US dollar. In particular, the market expectation that the Federal Reserve may maintain loose monetary policy will continue to provide momentum for gold to rise.
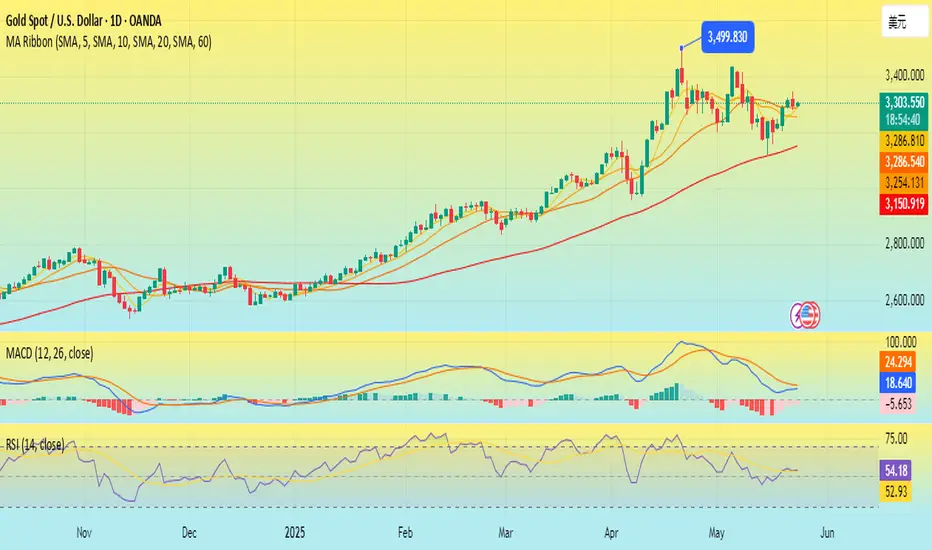
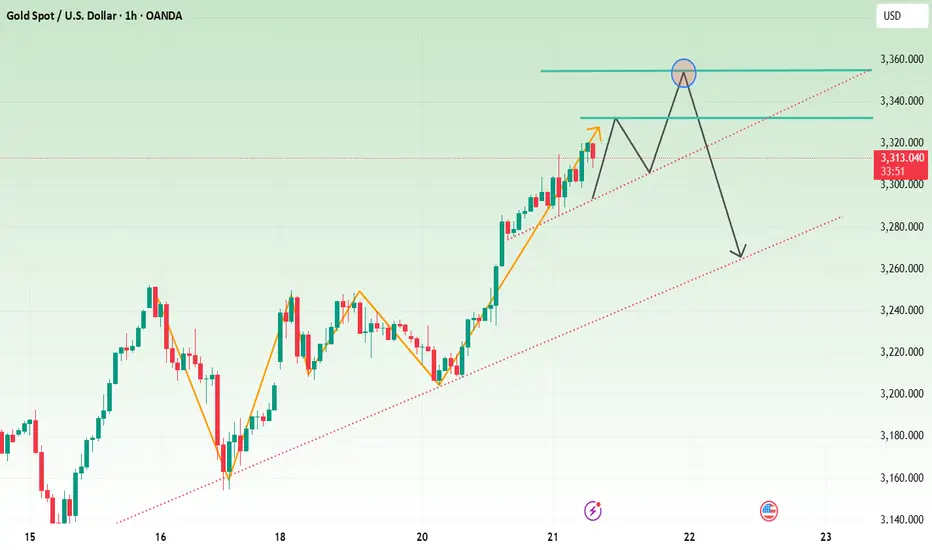
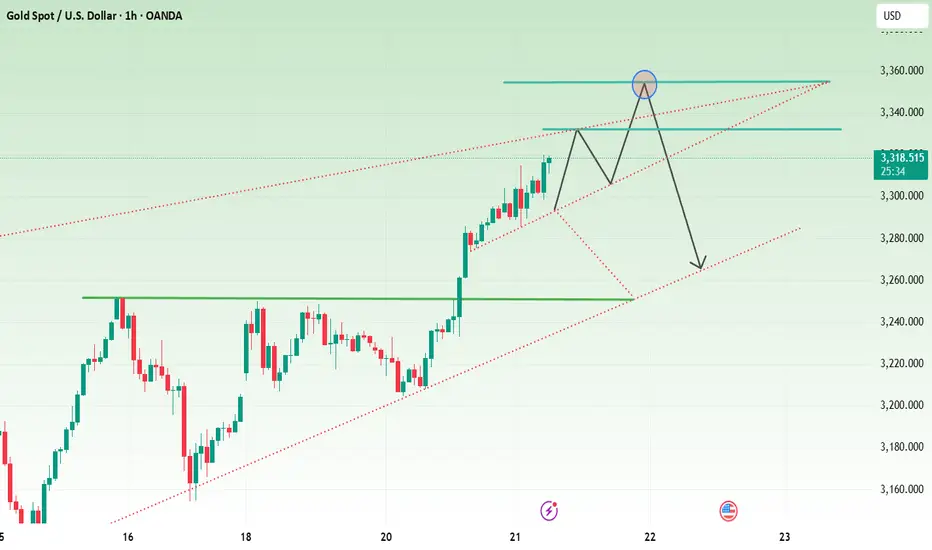
From the daily chart, the price of gold has shown a clear upward trend since this year. Although there have been several corrections in the middle, the bulls still control the medium and long-term market. After the previous rise in the H4 cycle, it is not so strong now. Instead, it is a volatile trend. The Bollinger band is closed, and the trend strength still needs market stimulation to rise again.
The 1-hour moving average of gold has begun to turn, so the rising strength of gold bulls has been suppressed. The high point of the 1-hour rebound of gold has been getting lower and lower, and the low point has also begun to fall. The 1-hour gold has begun to fluctuate downward. The downward trend of the gold rebound is suppressed near 3340. Gold rebounds near 3340 and can still be shorted.
Goldpriceaction

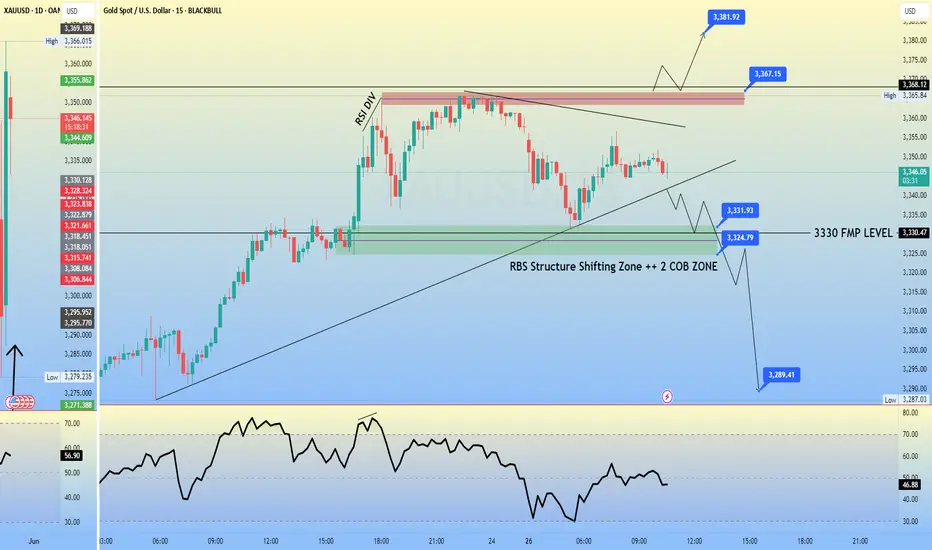
GOLD M15 Intraday Chart For 26 May 2025GOLD M15 Intraday Chart just posted as you can see that there are important zone
right now market is in range so you can do couple of scalping trades in Support & Resistance range
furthermore there are 2 breakout scenarios mentioned, kindly check carefully then trade
Remember Trade always with SL
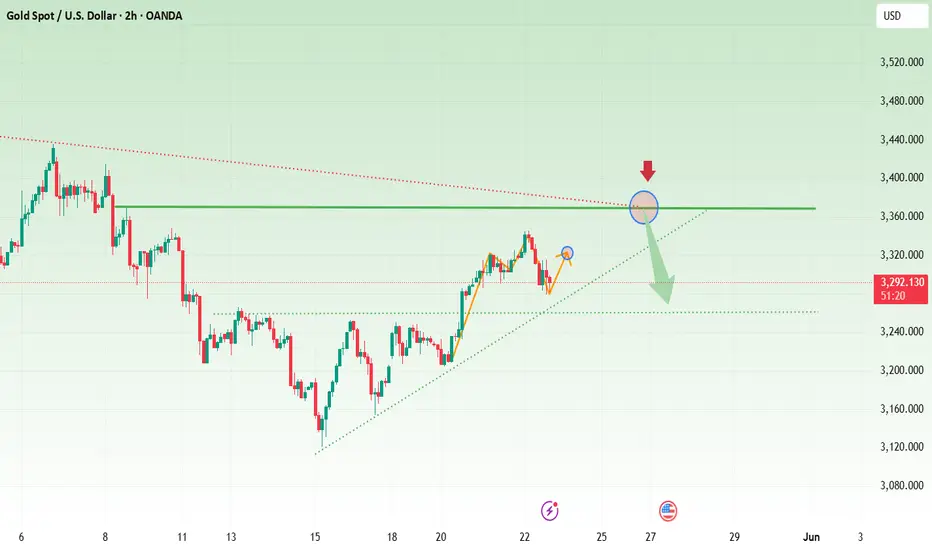
Going long on pullbacks remains the mainstream.Fundamentals: Risk aversion is still the mainstream in the current market; risk aversion funds and risk aversion sentiment are still dominant in the gold market; although risk aversion and bullish sentiment have weakened at the war and trade war levels; the overall global fundamentals have not returned to their original state; behind various small fundamentals, there is still the possibility of triggering various risk events
Gold continued to rise on Friday due to the rise in risk aversion caused by tariffs, and the price of gold continued to rise to around 3365, and the daily line closed with a full big positive line again. If gold can successfully break through and stabilize in the 3360-3365 range in the future, the bull market is expected to regain its dominant position.
From the perspective of the 4-hour cycle, the price of gold continues to rise based on the unilateral moving average. Although there is a temporary divergence in the current indicators, in terms of form, the price of gold has achieved a short-term break. Next Monday, it is necessary to focus on the support strength of the 3345-3335 position, and the upper pressure range is maintained at 3365-3375. Do not blindly chase the rise before successfully breaking through and stabilizing. In terms of operation strategy, it is recommended to wait for the opportunity to step back, buy on dips, and continue to be bullish on gold prices. If gold can continue its strong performance next week, it is expected to test the previous high of 3430-3440 again.

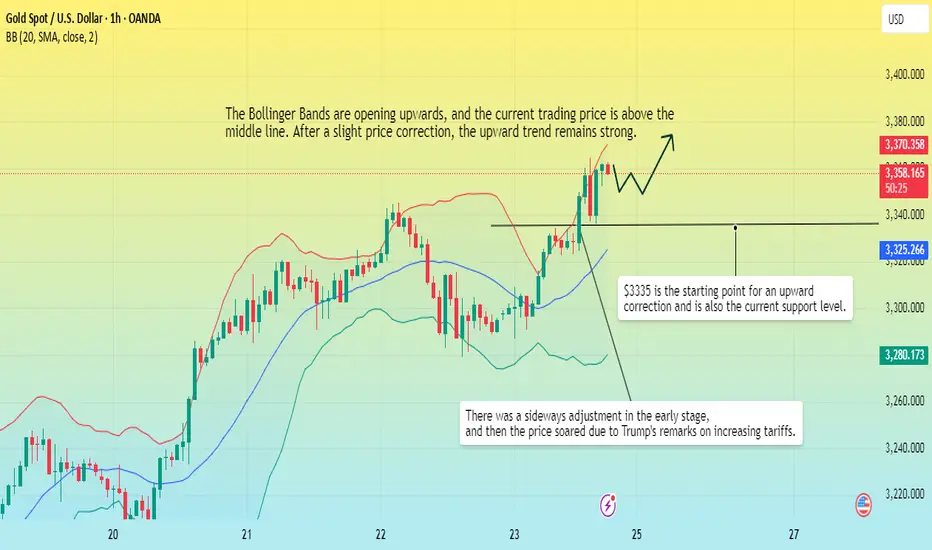
Tariffs are on the rise again, gold is jumping.Information summary:
The Trump administration has once again launched a tariff war, threatening to impose a 50% tariff on the EU from June 1, and said that the negotiations between the United States and the EU have made no progress. Because the timing of this threat is quite delicate. Just earlier this week, the EU just submitted a new framework proposal to the US to restart bilateral trade negotiations. This directly led to a jump in gold.
Faced with the tough stance of the United States, the EU is not without countermeasures. It is reported that the EU has formulated a contingency plan. If the negotiations fail, it will impose additional tariffs on US exports worth 95 billion euros in response to Trump's "reciprocal" taxation and 25% tariffs on automobiles and some parts, which will inevitably cause further impact on the market.
Market analysis:
Today, the European session was under pressure at 3335 and the correction method was adopted. This correction method can better show that the price is strong, and the bulls are not willing to give the bears too many opportunities. Therefore, the layout should be aggressive. The stronger the market, the less likely it will fall back. At the same time, the correction of the strong market will definitely not break the low for the second time.
Operation strategy:
Short near 3375, stop loss at 3380, and target 3350-3340.
The price fell back to around 3335, and we will adopt a long strategy based on the downward trend.
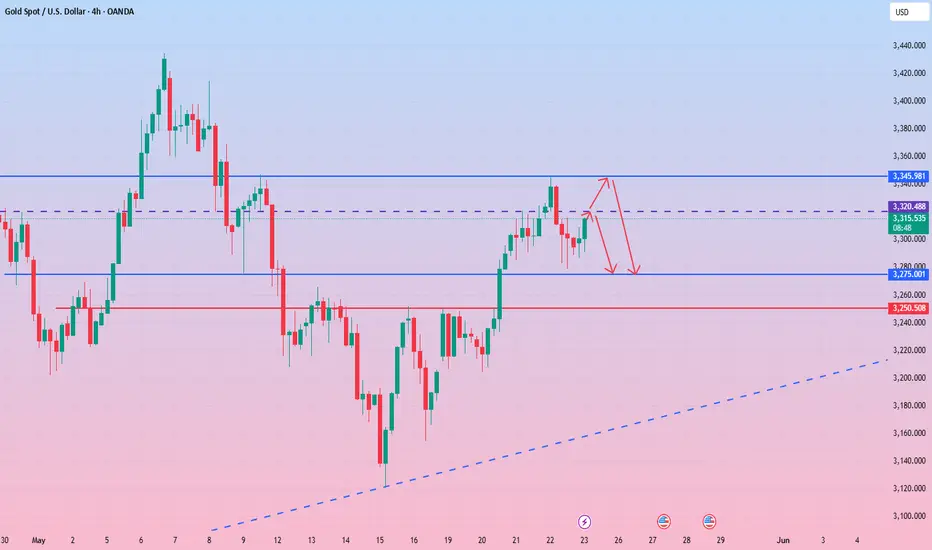
Plan ahead Sell high and buy low to take the lead.Yesterday, the technical side of gold rose first and then fell. We directly arranged 3327 long orders to take profit and exit at 3340. After further accelerating to break through the 3345 mark, it fell under pressure and fell rapidly. We also successfully shorted at 3341, and the target successfully reached 3330-20. The European session continued to fall and broke through the 3300 mark and continued to fall to around 3280 to stabilize and rebound. We went long at 3280, and the target was 3300-3306. The daily K-line closed at a high and fell back to oscillate in the middle. The overall gold price was suppressed and oscillated at the 3345 mark in the short term. Yesterday's three orders also reached the take-profit target as expected.
From the 4-hour market analysis, today's upper short-term resistance is around 3315-3320. If the upper pressure 3315-3320 is not broken, shorting can also be done. Focus on yesterday's high pressure of 3345. The support level below is still 3280-3275. If it breaks down, pay attention to 3255-3250. Continue to rely on this range to maintain the main tone of high-altitude low-multiple cycles during the day. Observe more and move less in the middle position, be cautious in chasing orders, and wait patiently for key points to enter the market.
Operation suggestions:
1. Go long when gold falls back to 3285-3275, and look up to 3300 and 3315.
2. Go short when gold rebounds to 3340-3345, and look down to 3325 and 3315.
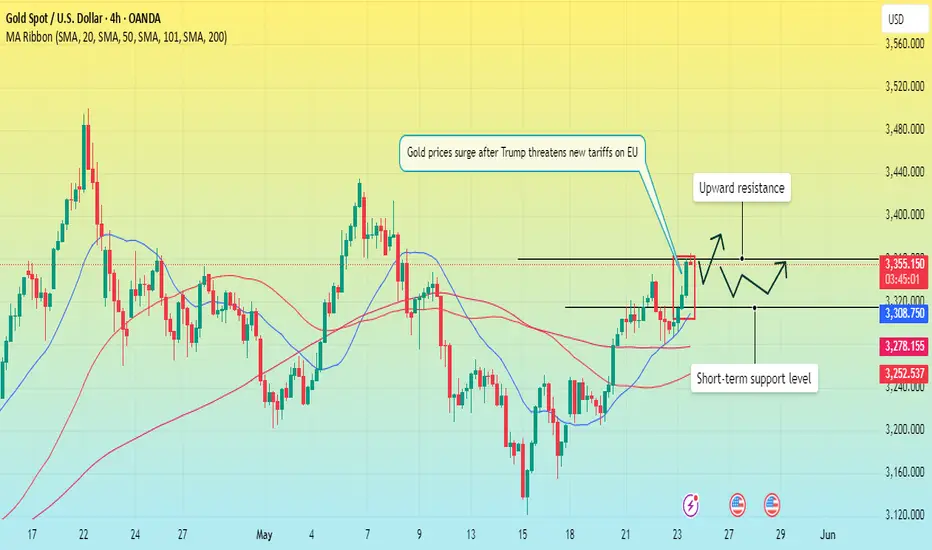
Tariff threat. Gold prices rose sharply?Information summary:
Gold prices climbed in the short term during trading after Trump threatened to impose new tariffs on the European Union, as this increased market uncertainty and increased demand for safe-haven assets. Trump said in a post on Truth Social that he suggested a 50% tariff on the European Union starting June 1, and complained that trade negotiations were stalled.
After the news came out, gold prices rose rapidly, breaking the $3,345 resistance level, but did not stabilize above the $3,365 resistance level I predicted in the morning; it reached a high of around $3,360 and then fell back slightly.
I think the short-term gains have been too large, and if there is a rapid adjustment, the amplitude will also be large.
Technical analysis:
From the 4-hour chart, gold prices continue to trade above all moving averages, and the 20-day moving average has broken through the 100-day and 200-day period moving averages. At present, indicators show that the upward momentum is not very strong.
If the price breaks through the 3365 resistance level strongly, it may hit the cycle high of around 3380.
Because of the weekend, if the resistance level fails to be broken strongly, the price may adjust in the range of 3360-3330 US dollars, and a new trend needs to be found.
Will gold continue to rise? Be alert on Friday.On Thursday, the US dollar rebounded after three consecutive days of decline and once returned to above the 100 mark, but failed to stand firm here. It is still maintaining at the 100 mark for consolidation. Due to the strengthening of the US dollar, gold began to retreat after hitting a high of 3345 yesterday, and once lost the 3300 US dollar mark, with the lowest reaching around 3280.
First of all, from the current 4-hour chart of gold:
In the Asian session, the lowest gold touched around 3290, and then rebounded. As of now, the highest reached around 3330. At present, 3310 should be a relatively important support position for gold. If it can be maintained above 3310, then gold may continue to rise. It can also be seen from the figure that once it continues to rise, 3345 is likely to be refreshed, and the highest should be around 3360.
From the 1-hour chart:
3280-3330 range, around 3310 is exactly the current 618 position. Therefore, if gold cannot pull back below 3310 again, it is highly likely that it will continue to reach a new high.
Secondly, as time goes by, the early low of 3290 can no longer be touched, and the current support is already near 3300. That is to say, it cannot fall below 3300 again. Once it falls below 3300, gold will refresh the low of 3280 and continue to fall.
Operation strategy:
If it can retreat to 3310 and stabilize, then we will go long at 3310.
On the contrary, if it falls below 3310, then we will focus on 3300. Once it falls below 3300, the trend will go down.
Then you can short at 3290-3300, and the profit range is around the early intensive trading area of 3260-3250.
XAU/USD 23 May 2025 Intraday AnalysisH4 Analysis:
-> Swing: Bullish.
-> Internal: Bullish.
Analysis and bias remains the same as analysis dated 23 April 2025
Price has now printed a bearish CHoCH according to my analysis yesterday.
Price is now trading within an established internal range.
Intraday Expectation:
Price to trade down to either discount of internal 50% EQ, or H4 demand zone before targeting weak internal high priced at 3,500.200.
Note:
The Federal Reserve’s sustained dovish stance, coupled with ongoing geopolitical uncertainties, is likely to prolong heightened volatility in the gold market. Given this elevated risk environment, traders should exercise caution and recalibrate risk management strategies to navigate potential price fluctuations effectively.
Additionally, gold pricing remains sensitive to broader macroeconomic developments, including policy decisions under President Trump. Shifts in geopolitical strategy and economic directives could further amplify uncertainty, contributing to market repricing dynamics.
H4 Chart:
M15 Analysis:
-> Swing: Bullish.
-> Internal: Bearish.
Analysis and bias remains the same as yesterday's analysis dated 22 May 2025.
In my analysis from 12 May 2025, I noted that price had yet to target the weak internal high, including on the H4 timeframe. This aligns with the ongoing corrective bearish pullback across higher timeframes, so a bearish internal Break of Structure (iBOS) was a likely outcome.
As anticipated, price targeted strong internal low, confirming a bearish iBOS.
Price has remained within the internal range for an extended period and has yet to target the weak internal low. A contributing factor could be the bullish nature of the H4 timeframe's internal range, which has reacted from a discounted level at 50% of the internal equilibrium (EQ).
Intraday Expectation:
Technically price to continue bullish, react at either premium of internal 50% EQ or M15 demand zone before targeting weak internal low priced at 3,120.765.
Alternative scenario:
Price can be seen to be reacting at discount of 50% EQ on H4 timeframe, therefore, it is a viable alternative that price could potentially print a bullish iBOS on M15 timeframe.
Note:
Gold remains highly volatile amid the Federal Reserve's continued dovish stance and persistent geopolitical uncertainties. Traders should implement robust risk management strategies and remain vigilant, as price swings may become more pronounced in this elevated volatility environment.
Additionally, President Trump’s recent tariff announcements are expected to further amplify market turbulence, potentially triggering sharp price fluctuations and whipsaws.
M15 Chart:

Dangers and opportunities for gold? Trend change?In early Asian trading, spot gold fluctuated in a narrow range and is currently trading around $3,300. After rising in the first three trading days of this week, gold prices briefly hit a two-week high of $3,345 in Asian trading on Thursday, then fell sharply and finally closed around $3,294. This rapid change hides the fierce struggle between the strengthening of the US dollar, the turmoil of US bonds and geopolitical changes.
The rebound of the US dollar is the biggest pressure for the rise in gold prices.
Another major pressure on the gold market comes from the sharp fluctuations in US bond yields. The 30-year US bond yield hit a 19-month high, reflecting the market's deep concerns about the $3.8 trillion in new debt. The cold auction of $16 billion in 20-year US bonds on Wednesday further confirmed the judgment that the demand for sovereign bonds is undergoing structural changes.
The current gold market is being pulled by multiple forces. In the short term, the technical rebound of the US dollar and the selling of US bonds do pose pressure. But in-depth analysis shows that the pressure of currency depreciation brought by the $3.8 trillion fiscal expansion, the safe-haven demand caused by the damaged credit of US debt, and the risk of stagflation are three factors that are building long-term support for gold.
I think the shadow of global bond market turmoil will become a potential factor for the bullish gold market.
There are relatively few economic data during Asian trading hours. The focus should be on the annualized total number of new home sales in the United States in April after seasonal adjustment and the speeches of Federal Reserve officials, as well as news related to the geopolitical situation and the international trade situation.
I will also analyze the latest international news and its impact on gold prices for you as soon as possible.
Short-term operation strategy:
First rise: short near 3345, stop loss 3255, profit range 3280-3270.
First fall: long near 3275, stop loss 3265, profit range 3300-3310.
Gold bulls push prices to around 3355
📌 Driving events
Gold prices rose more than 0.50% and held above the $3,300 mark, driven by renewed safe-haven demand and rising geopolitical tensions in the Middle East. As of writing, gold/USD is trading around $3,317, rebounding from an intraday low of $3,285.
Market sentiment remains fragile, with US stocks falling into negative territory and US Treasury yields slightly higher. All eyes are on the upcoming vote on President Trump's tax reform plan. According to estimates by the Congressional Budget Office (CBO), the plan could lead to an approximately $3.8 trillion expansion of the US national debt. Uncertainty about the fiscal outlook continues to stimulate demand for gold as a defensive asset.
📊Comment Analysis
Gold price recovery is good, pay attention to the 3358 price area, adjust downward, and continue to accumulate funds around 3300
💰Strategy Package
🔥Sell gold area: 3358-3360 SL 3365
TP1: $3350
TP2: $3337
TP3: $3322
🔥Buy gold area: $3284-$3276 SL $3270
TP1: $3300
TP2: $3320
TP3: $3340
⭐️ Note: Labaron hopes that traders can properly manage their funds
- Choose the number of lots that matches your funds
- Profit is 4-7% of the fund account
- Stop loss is 1-3% of the fund account
[20250522] - Gold Overview1️⃣ Market Overview:
📌 Recent Closed: 3315
📌 Bullish sentiment confirmed above (3265)
📌 Key reversal threshold: (3296)
2️⃣ Key Observations:
✅ Price above (3253) suggests continued bullish bias.
✅ Recent High 3320—watch for a strong breakout or exhaustion.
✅ Next liquidity Range: 3337 (upside), 3264 (downside).
3️⃣ Potential Scenarios:
🔹 Bullish Continuation: Closing above 3320 confirms momentum toward 3337.
🔹 Bearish Exhaustion: Failure to hold 3296 could trigger a reversal toward 3253.
🔹 Invalidation: 💡 A break below 3296, failing Bull POC (3265), would shift sentiment bearish.
4️⃣ Entry & Target Levels:
🔹 Bullish Entry:
✔️ Price holding above 3296 strengthens bullish sentiment.
✔️ A confirmed break above 3320 opens room for a run toward 3337 liquidity zone.
🔹 Bearish Entry:
✔️ If price fails to sustain above 3296, watch for confirmation near 3253 VAH.
✔️ A strong rejection leads price toward next liquidity at 3264.
🎯 Targets:
Upside: 3320 breakout leads toward 3337 liquidity zone.
Downside: Failure at 3296 opens movement toward 3264 liquidity support.
📢 Your Thoughts? Drop a comment and let me know what you think! 🚀

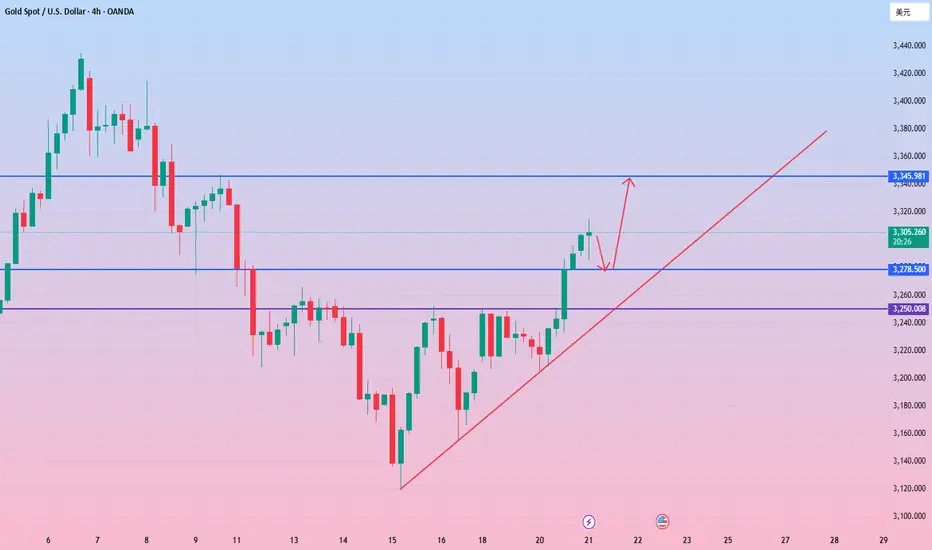
Grasp the core strategy of trend tradingGold continues to be bullish and will go to the area near the gap of 3325. At that time, the short-term may be blocked and fall back. If it breaks, look at the area near 3340-3345. In the 4H cycle, relying on the moving average to support the rising stage, and the Bollinger is in an open state, there is still room to see above. The support for the fall back is to pay attention to the top and bottom of the small cycle of 3285, followed by the low point of 3274, but there will not be too much retracement in the strong position. In terms of operation, the main fall back is long, and gradually look at 3325 and 3345. Shorting can only be entered at key points, and fast in and out without fighting.
Operation suggestion: Go long on gold near 3285-74, look at 3315 and 3325! If it is extremely strong, go long on the support of 3298-3295!

Trend trading is the core strategyGold opened at 3290 and rebounded, reaching 3314 and retreating. Last night, gold broke through the box and oscillated, so it is reasonable to continue to move up. The gold moving average continues to cross upward and diverge. The strength of gold bulls is still there. The decline of gold is an opportunity to continue to go long. Gold is now at the top and bottom conversion position of 3275-85. Gold falls back to 3275-3285 and continues to go long. Gold has repaired the gap of the previous gap. In the short term, pay attention to the suppression of 3315-21. Try not to chase the high position. We will intervene in the long position when it falls back.
Today, the support below is around 3275-85, and the upper short-term focus is on the 3315-21 line. If it does not break, you can short. The important resistance is 3340-45. The short-term long-short strength and weakness watershed is 3253-60. The daily level stabilizes above this position and continues to maintain the same low-long rhythm. Shorting can only enter the market at key points, and enter and exit quickly, and do not fight.
Gold operation strategy:
1. Go long when gold falls back to around 3275-85, with a target of 3300-3320.
2. Go short when gold rebounds around 3340-45, with a target of 3320-3300.
Gold breaks upward, space opens up
📌 Driving events
Internationally, US media reported that US intelligence agencies found that Israel was preparing to attack Iran's nuclear facilities, and gold and crude oil both soared in the short term.
Recently, the Iran nuclear talks and the Russia-Ukraine talks were carried out simultaneously, and the market risk aversion sentiment fluctuated greatly
📊Comment analysis
While the medium and long-term outlook continues to be bullish on gold's performance this year, short-term operations are mainly based on news. Pay attention to light positions and maintain flexibility in short-term operations.
💰Strategy Package
🔥Buy Gold Zone: 3310-3315 SL 3307 Scalping
TP1: $3318
TP2: $3325
TP3: $3330
🔥Sell Gold Zone: 3354-3356 SL 3361
TP1: $3345
TP2: $3332
TP3: $3320
🔥Buy Gold Zone: $3252 - $3250 SL $3245
TP1: $3260
TP2: $3270
TP3: $3280
⭐️ Note: Labaron hopes that traders can properly manage their funds
- Choose the number of lots that matches your funds
- Profit is 4-7% of the fund account
- Stop loss is 1-3% of the fund account
Gold breaks through 3300, where is the next stop
📌 Driving events
Beth Hammack, president of the Federal Reserve Bank of Cleveland, stressed that the current US government's policies make it increasingly challenging for the Federal Reserve to effectively guide the economy and fulfill its dual mission of maintaining price stability and full employment. She also warned that the risk of a stagflationary environment (characterized by stagnant growth and persistent inflation) is rising. In contrast, Alberto Musalem, president of the Federal Reserve Bank of St. Louis, recently said that the current monetary policy stance is still appropriately adjusted.
Despite rising US Treasury yields, gold has struggled to gain support, indicating that higher yields alone are not enough to drive safe-haven demand under the current circumstances.
However, global monetary easing policies may provide support for this precious metal. In the latest moves during the Asian trading session, the People's Bank of China (PBoC) cut its benchmark interest rate, followed by the Reserve Bank of Australia (RBA) unexpectedly cutting the cash rate from 4.10% to 3.85% - moves that usually support non-yielding assets such as gold.
📊Comment Analysis
Spot gold prices have extended gains in recent intraday trading, taking advantage of its stability above EMA50 and trading along a bullish trend line on a short-term basis, strengthening its ability to reach the main resistance level of $3,300 and break it. Some weak signals have appeared on technical indicators. We noticed that a negative overlap signal has formed on the RSI, and after reaching overbought levels, this indicates that a temporary adjustment is needed on the upward action. Therefore, gold has reduced some of its early gains and waited for clearer signals to continue the bullish trend.
💰Strategy Package
🔥Sell Gold Zone: 3354-3356 SL 3361
TP1: $3345
TP2: $3332
TP3: $3320
🔥Buy Gold Zone: $3252 - $3250 SL $3245
TP1: $3260
TP2: $3270
TP3: $3280
⭐️ Note: Labaron hopes that traders can properly manage their funds
- Choose the number of lots that matches your funds
- Profit is 4-7% of the fund account
- Stop loss is 1-3% of the fund account
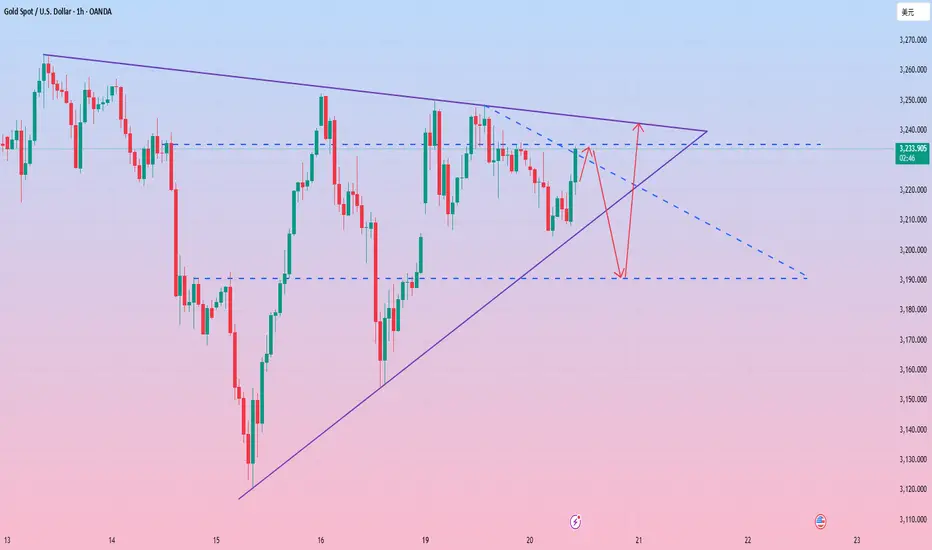
Rebound firmly short-sellingThe US dollar index continued to fall yesterday, breaking through the 100 integer mark, but the gold price did not break through the key resistance level. In the short term, we need to be alert to the risk of gold price correction. In addition, the three major US stock indexes have continued to rise recently, but the market risk appetite has decreased. We need to be alert to the market panic and liquidity tightening that may be caused by the stagnation of the US stock market's rise, which will put pressure on the gold market. Technically, the gold price was blocked at the important pressure level of 3250 yesterday, and the support below was at the 3200 mark. In the short term, it is still mainly range-bound. At present, the upper resistance is 3226-3233, and the lower support is 3189-3184. In terms of operation, it is recommended to rebound short and supplemented by callback long.
Operation strategy 1: It is recommended to rebound short at 3228-3235, and the target is 3210-3193.
Operation strategy 2: It is recommended to pull back to 3189-3185 and go long, and the target is 3215-3235.
Perfect grasp of key points Insight into market trendsWith the downgrade of the U.S. credit rating and the recent weak U.S. economic data, market expectations for a U.S. interest rate cut have increased. The U.S. dollar index has plummeted and is once again facing the 100 mark. Risk aversion sentiment has rebounded again, and gold has once again been sought after. It opened higher in the Asian session. However, we have mentioned the repetitiveness of sentiment many times recently, so we remind you not to chase the rise too much. We remind you to short near 3245, long at 3209, and short again near 3245. Both long and short positions are very accurate, giving perfect entry opportunities and successfully taking profits.
Judging from the current trend, gold is under pressure again in the European session near 3248, and the US session has fallen back. The short-term strength has turned into a wide sweep again. Focus on the gains and losses of 3230. If it falls below or looks at the gap area of 3206-3203, go long if it falls back and does not break. The upper pressure is still focused on the area near 3253-60. Short-term fluctuations are increasing. If there is any adjustment, we will notify you in time.
Operation suggestion: Go long in gold near 3206-03, look at 3230 and 3252!

Gold bottomed out and rebounded, US market ideas!
📊Comment analysis
During the European and American markets, the market rebounded to 3249. Before the rebound, it was mentioned that the first resistance today was around 3251, followed by the defense point of 3265. As expected, gold plunged slightly near the resistance level of 3251, and fell to 3227 at its lowest.
💰Strategy package
Short at the current price of 3239-40, add shorts near 3242 and 3245, stop loss 3253 target 3200-3165
⭐️ Note: Labaron hopes that traders can properly manage their funds
- Choose the number of lots that matches your funds
- Profit is 4-7% of the fund account
- Stop loss is 1-3% of the fund account
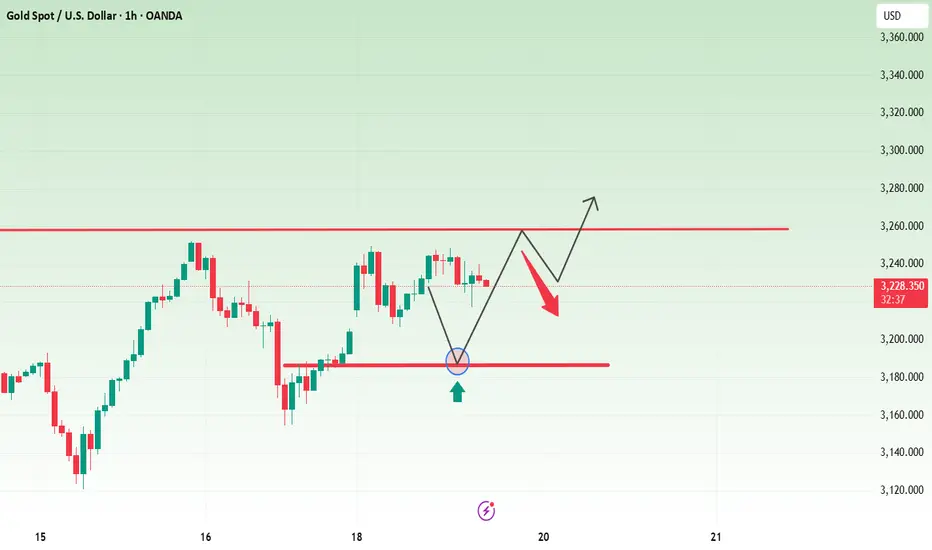
Gold Price Targets Fresh GainsGold Price Targets Fresh Gains
Gold price started a fresh increase above the $3,210 resistance level.
Important Takeaways for Gold Price Analysis Today
- Gold price started a steady increase from the $3,120 zone against the US Dollar.
- A connecting bullish trend line is forming with support at $3,210 on the hourly chart of gold at FXOpen.
Gold Price Technical Analysis
On the hourly chart of Gold at FXOpen, the price found support near the $3,120 zone. The price formed a base and started a fresh increase above the $3,150 level.
The bulls cleared the $3,200 zone and the 50-hour simple moving average. There was also a spike above the 50% Fib retracement level of the downward move from the $3,347 swing high to the $3,120 low. The RSI is now above 50 and the price could aim for more gains.
Immediate resistance is near the 61.8% Fib retracement level of the downward move from the $3,347 swing high to the $3,120 low at $3,260.
The next major resistance is near the $3,295 level. An upside break above the $3,295 resistance could send Gold price toward $3,350. Any more gains may perhaps set the pace for an increase toward the $3,385 level.
Initial support on the downside is near the $3,210 zone. There is also a connecting bullish trend line forming with support at $3,210. If there is a downside break below the $3,210 support, the price might decline further.
In the stated case, the price might drop toward the $3,155 support. The next major support sits at $3,120. Any more losses might send the price toward the $3,060 level.
This article represents the opinion of the Companies operating under the FXOpen brand only. It is not to be construed as an offer, solicitation, or recommendation with respect to products and services provided by the Companies operating under the FXOpen brand, nor is it to be considered financial advice.
Perfectly hold the pullback and continue to buy.Gold opened at around 3240 and then rushed to 3252 and then retreated. In the evening, we also gave a short position near the rebound to 3240. After all, there is a lot of pressure from above, and the technical side also needs to repair the strategy, so we gave a short position entry near 3237-38, and the target is 3215. As of the retracement, it reached the lowest point near 3206, which also successfully reached our target position. Today's Asian session high and retreat is completely a technical adjustment. It bottomed out and rebounded yesterday, with an increase of more than one hundred US dollars. The technical bulls are weak and need to pull back. This is why I gave the short position. Be a steady trader.
The gold market showed a V-shaped reversal pattern of bottoming out and rebounding yesterday. The daily line closed with a hammer-shaped positive line with an extremely long lower shadow, indicating that the support below is strong, but the overall high-level oscillation pattern is still maintained. Technical indicators show that short-term correction pressure still exists: the stochastic indicator is blunted at a high level, the MACD double-line dead cross is downward, and the Bollinger band opens downward. The gold price is likely to fluctuate around the middle and lower tracks.
The 4-hour level oscillates to the short side, and the 3200 line becomes the watershed between long and short. If it effectively falls below this level, the shorts will regain the initiative; on the contrary, the longs need to break through the strong resistance area of 3265-3270 to reverse the decline. At the close of the weekly line, the market has a demand for a restorative decline. If it falls below the 3200 integer mark, the target below will look at the 3180-3170 area. Focus on the effectiveness of the 3265-3270 resistance and the strength of the 3200 support, and be alert to the violent fluctuations in the closing market on Friday.
Gold recommendation: Go long when it falls back to around 3215-3205. Target 3230-40-50 first line

Gold rebounds above 3190, maintains
🔔 Driving Events
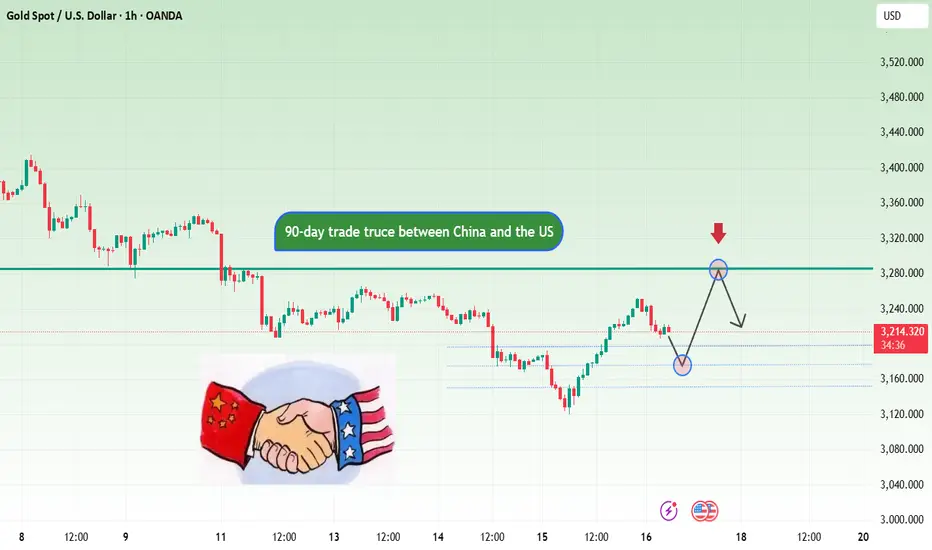
Gold prices (XAU/USD) failed to extend Thursday's sharp rebound from the $3,120 area (the lowest level since April 10) and faced selling pressure again during Friday's Asian session. The 90-day trade truce between China and the United States has relieved some of the pressure on global financial markets, suppressing demand for safe-haven metals.
Nevertheless, lingering geopolitical tensions and a weaker US dollar continue to provide potential support, limiting the downside for gold prices. In addition, the market's growing expectations for further interest rate cuts by the Federal Reserve may prevent traders from taking a strong bearish stance on gold in the short term.
📊Comment Analysis
Gold prices have recovered, and buyers are determined to keep gold prices stable around 3200 points in May. Waiting for new bullish momentum after the end of tariff negotiations
💰Strategy Package
🔥Sell Gold Zone: 3287-3290 SL 3294
TP1: $3270
TP2: $3260
TP3: $3250
🔥Buy Gold Zone: $3173 - $3175 SL $3168
TP1: $3188
TP2: $3200
TP3: $3218
⭐️ Note: Labaron hopes that traders can properly manage their funds
- Choose the lot size that matches your funds
- Profit is 4-7% of the capital account
- Stop loss is 1-3% of the capital account
Gold, false decline, real wash
📊Comment analysis
The recent surge and plunge of gold has also led to many different opinions on the market trend. If it rises, look at the ceiling, and if it falls, look at the floor. Most of them are such remarks, and the misleading nature of such remarks can be imagined. The first time I chased more at 3500, it was okay. After the beginning of the month, I soon got the opportunity to get out of the trap. But those who chased higher at 3400 twice last week were not so lucky. Opportunities cannot always be there, and not every time you can survive.
Once you have the idea of standing guard or holding on, it means you will lose. In the face of huge fluctuations in prices, short-term card points, and few positions can be grasped. You can't just rely on a rumor on the Internet to chase shorts and look at bear markets when prices fall, and chase longs and look at bull markets when prices rise. Investing and trading are two different things. Investment is a direction, focusing on large cycles, large directions, long-term, and profiting by time. Trading, on the other hand, makes money by rhythm and fluctuations, which are completely two concepts.
I have always said that the general direction is bullish and the rhythm is to get on board after every retracement. The transaction is divided into short, medium and long. The short-term is limited to intraday. Whether it is right or wrong, it is settled on the same day. The medium-term wave band, after each large retracement, insist on getting on board in batches, and leave after a phased rise. For the long-term, after each large retracement, build positions in batches and hold for a long time. First, make the logic clear, and then talk about the operation. We can't achieve the lowest or highest, but as long as we achieve a relatively low or high position, it will be fine.
The core of investment is the cycle, and the core of trading is the rhythm. If the rhythm is right, everything is right.
In the face of the sharp rise and fall of gold, first, don't hold a heavy position, and second, as long as it is not a relatively high or relatively low chasing order, there is no need to panic. First, if you hold a heavy position, first of all, you can't withstand the fluctuations, you can only bet on the win or loss of one order, and there will be no next chance. Secondly, as long as you chase long at high positions and short at low positions, even if you have a light position, you will not have a chance to get out of the trap, and you can only make up for the loss through new transactions. There is no other way, but to achieve unity of knowledge and action, and don't think about it. Heavy positions, plus chasing back and forth, plus the world lock, will only die faster and will not get out of the trap. Take care of yourself.
Let's talk about the market. First of all, the bull is still there. Secondly, the sharp drop and surge are wash-outs and adjustments, not the peak, but the base is large and the amplitude is large, so you have to reduce your position. At present, it is a large-scale range shock wash-out adjustment at the daily level, and a weekly level retracement, not the peak. It will be very clear if you look at the big cycle, and you must not listen to the rumors flying all over the sky. If it rises, chase high to see new highs, and if it falls, chase short to see new lows. It is not advisable. Again, remember one thing, grasp the relative highs and lows, let the wind and waves rise, and sit on the fishing boat steadily.
After the U.S. market plummeted, it directly reversed and surged. This kind of market will not continue. Don't chase it. Don't see the plummet and then the surge, and then shout that the bottom has been reached. The plummet means the peak, and the surge means the bottom has been reached. Isn't it a life-and-death situation every day?
The U.S. market directly talked about the next area. After the sell-off, gold rebounded sharply yesterday, which gave the trapped orders an opportunity to escape, not a direct reversal. Next, gold will enter a large range of shocks and washes with 3260 as resistance and 3150-3120 as support. After the shock, it will finally experience a wave of sell-offs and break the new low, and then it will bottom out. The bottoming logic is the same as the May Day period. Before May Day, gold continued to maintain above 3260 for washing. After May Day, it directly broke below 3260 and touched 3200 and then rose. Next, it will be the same. After a period of washing and shock, it will fall below the low of 3120 again, hit a new low and bottom out, and start to rise. The rhythm is like this, it depends entirely on courage, patience and technology, chasing ups and downs is not advisable. The rhythm is like this, watch more and do less, hold tight, and fasten your seat belts.
⭐️ Note: Labaron hopes that traders can properly manage their funds
- Choose the number of lots that matches your funds
- Profit is 4-7% of the capital account
- Stop loss is 1-3% of the capital account
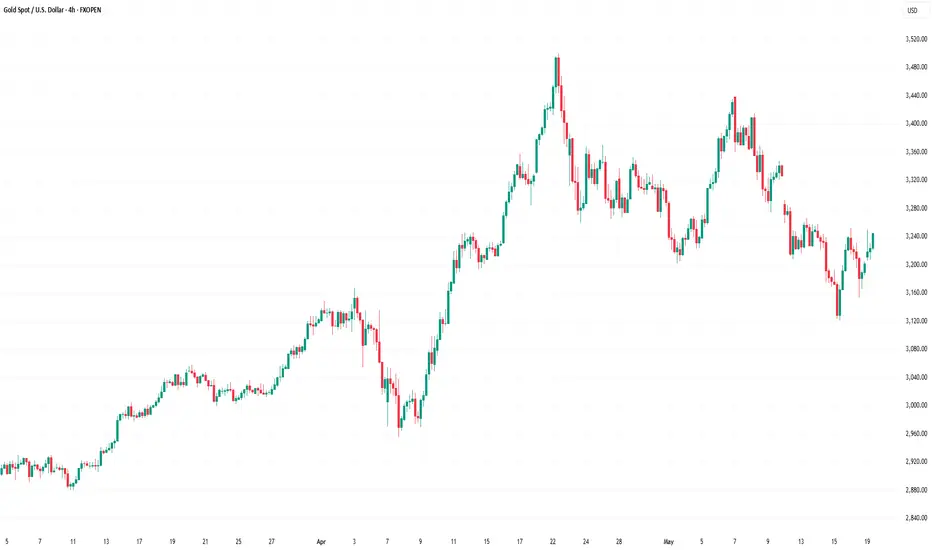
Gold Price Drops to Lowest Level in Over a MonthGold Price Drops to Lowest Level in Over a Month
As shown on the XAU/USD chart, the price of gold fell below $3,130 this morning – its lowest level since 10 April.
Since its peak in May, gold has lost more than 8% in value per ounce.
Why Is Gold Falling?
Bearish sentiment in the gold market may be fuelled by easing geopolitical tensions. According to media reports:
→ China and the US have already reported progress in reaching a trade agreement, while details of potential deals with India, Japan, and South Korea are currently being developed.
→ Iran is reportedly willing to sign a nuclear deal in exchange for the lifting of sanctions. In addition, Donald Trump may lift sanctions on Syria during his visit to the Middle East.
→ The situation between India and Pakistan has stabilised, and today, talks between Russia and Ukraine are expected to take place in Istanbul, with a potential ceasefire on the agenda.
These developments could be seen as reducing the appeal of gold as a safe-haven asset.
Technical Analysis of the XAU/USD Chart
In our 7 May gold price analysis, we:
→ outlined a descending channel (marked in red);
→ noted that bearish pressure persisted above $3,400.
Since then, the gold (XAU/USD) price has continued to move within this channel, breaking support around the $3,200 level and approaching a key support zone formed by:
→ the lower boundary of the red channel;
→ a long-term trendline (marked in blue);
→ a former resistance level (highlighted with arrows) at $3,140.
Given these conditions, traders should consider a scenario in which a minor rebound may occur – for instance, towards the median line of the red channel.
This article represents the opinion of the Companies operating under the FXOpen brand only. It is not to be construed as an offer, solicitation, or recommendation with respect to products and services provided by the Companies operating under the FXOpen brand, nor is it to be considered financial advice.
