Intraday adjustment ends, follow up with low and long positions!📌Fundamentals:
1. The conflict between India and Pakistan shows signs of escalation
2. US-Houthi ceasefire agreement
3. The Fed’s interest rate decision dominates this week’s market
4. International trade situation disturbs market sentiment
5. Market sentiment and capital flow
📊Technical aspects:
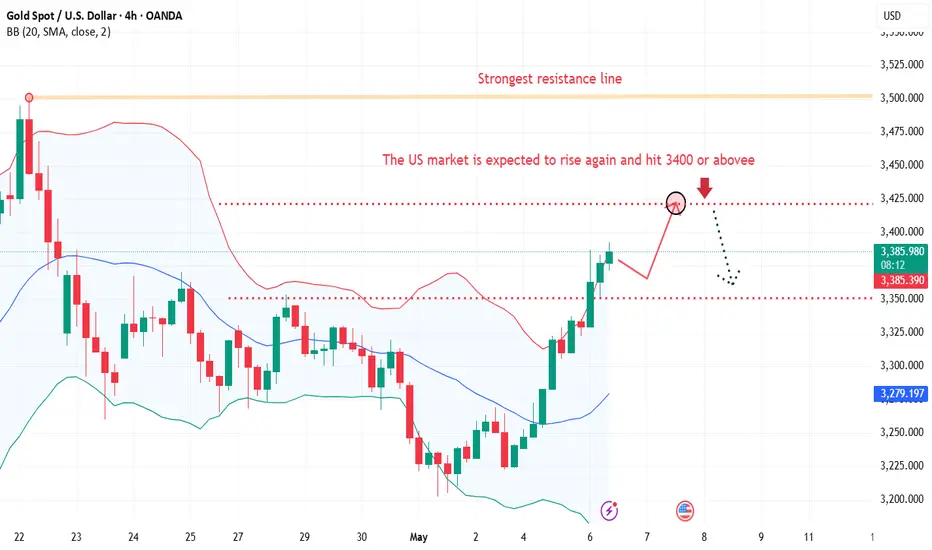
Affected by the trade negotiations, gold reached a high of 3434 and came out of the 70 US dollar drop. It took advantage of the trend to follow up the short order and reached the target profit stop as scheduled! Then it fell back and went long again to reap profits. The daily line continued to close in the positive direction, and there was room for fallback and adjustment during the Asian session. However, the daily cycle did not support a sharp decline for the time being. The data during the day tended to be treated as shocks. Therefore, the bullish trend remained unchanged, and the support below was 3335. You can go long if it hits during the day. The short-term support is around 3360 and 3350. In terms of operation, it will continue to be low and long. When it stabilizes, it will go to 3410 or even near the high point. However, if the second test does not reach a new high, there may be a larger correction.
🎯Practical strategy:
Gold is long around 3350-55, looking at 3376 and 3410! If it is strong, go long based on the support of 3365-60!
Goldpriceaction

Gold bides its time. Bulls are suppressed at high levels?
Gold is waiting for the Fed's interest rate decision.
analysis in Asian time period:
Gold opened with a sharp drop due to international news, and continued to fluctuate at a high level in the 3360-3400 range predicted by Quaid. I predicted in the early Asian session that the price of gold would rise to around 3390 and then fall back to around 3370-3360. And its trend is just as Quaid predicted and analyzed, with a correction after the predicted high point.
Now it seems that gold has fallen into a high-level fluctuation range after a sharp drop in the early Asian session, which is in line with my expectations. Quaid believes that the trend direction of the European session is very important. The current upward suppression range is between 3400-3415, and the downward support level is between 3360-3370;
On the contrary, if the European session falls below the downward support range, it may continue to fall.
But Quaid believes that the overall upward trend of gold prices has not changed. Gold prices are just accumulating strength now, and will continue to rise after the adjustment.
Overall trend analysis:
Quaid recommends that the long strategy is still the main one. If the support range of 3360-3370 can resist the downward trend, then we can still carry out the long strategy after the price falls back.
Operation strategy:
Long strategy: Go long when the price falls back to 3365, stop loss 3350, take profit range 3400-3415.
Short strategy: Go short at 3395, stop loss 3405, take profit 3360.

XAU/USD Analysis: Chart Indicates Elevated VolatilityXAU/USD Analysis: Chart Indicates Elevated Volatility
The XAU/USD chart shows that the ATR (Average True Range) indicator has reached its highest level in several weeks, signalling increased market volatility.
In addition, trading activity is being fuelled by heightened geopolitical tensions, now including an escalation of the conflict between India and Pakistan.
The price action analysis of the precious metal also provides valuable insight, highlighting the ongoing battle between supply and demand.
Technical Analysis of the XAU/USD Chart
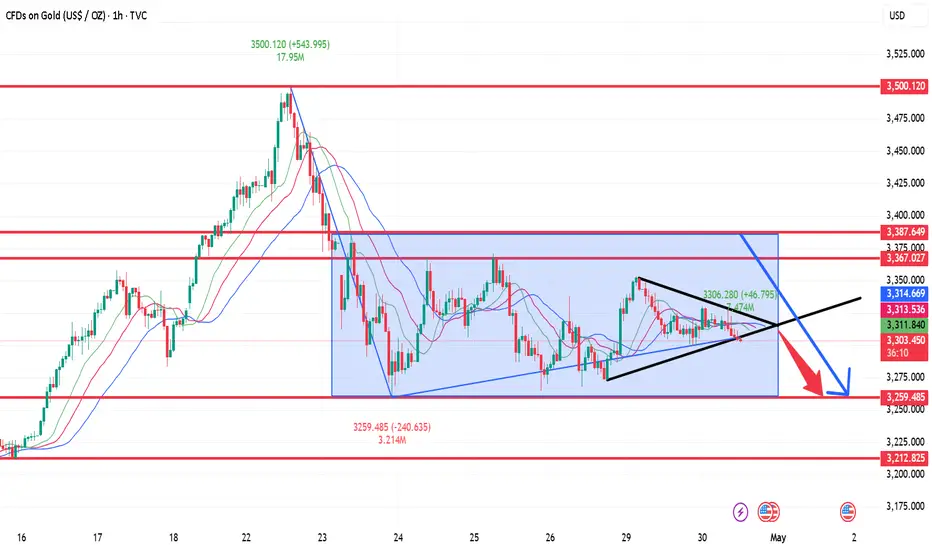
On 23 April, we noted a sharp shift in sentiment after the price of XAU/USD peaked around $3,500.
Gold price fluctuations today suggest continued bearish pressure above $3,400, leading to a downward reversal at peak B, which sits below the previous high at A.
This forms the basis for outlining a descending channel and suggests that bears may attempt to keep the price within its boundaries. On the other hand, the $3,333 level was decisively broken by a wave of buying (shown with a blue arrow), and a bullish “cup and handle” pattern is emerging in the background — it is possible that, as part of the May rally, bulls may try to surpass peak B.
Whatever the outcome, elevated volatility appears likely to persist — especially with the US Federal Reserve’s interest rate decision due today at 21:00 GMT+3, followed by Jerome Powell’s press conference at 21:30.
This article represents the opinion of the Companies operating under the FXOpen brand only. It is not to be construed as an offer, solicitation, or recommendation with respect to products and services provided by the Companies operating under the FXOpen brand, nor is it to be considered financial advice.

3420, gold prices can reach today
📌 Gold driving factors
Driven by the weakening of the US dollar and safe-haven demand, spot gold closed up $93.77 on Monday, up 2.9%, at $3333.32 per ounce.
On Monday local time, US President Trump signed an order on biomedical research, hoping to take the opportunity to promote the US pharmaceutical manufacturing industry. Trump also announced that tariffs on pharmaceutical products will be announced in the next two weeks.
Kitco Metals senior metals analyst Jim Wyckoff said: "We see continued inflows of safe-haven demand, keeping gold prices high. Gold prices will remain above $3,000 per ounce, at least in the short term."
Gold is often seen as a safe-haven tool in uncertainty and performs well in a low-interest rate environment. Gold prices have soared 26.3% this year and have set new historical highs many times.
📊Comment Analysis
Bulls regained their dominance, and the upward trend approached above 3400 before the market expected a rate cut
💰Strategy Set
🔥Sell Gold Area: 3418-3420 SL 3425
TP1: $3410
TP2: $3400
TP3: $3385
🔥Buy Gold Area: $3323 - $3321 SL $3316
TP1: $3330
TP2: $3340
TP3: $3358
⭐️ Note: Labaron hopes that traders can properly manage their funds
- Choose the number of lots that matches your funds
- Profit is 4-7% of the fund account
- Stop loss is 1-3% of the fund account
Gold could reach 3420 today
📌 Gold Drivers
Gold prices (XAU/USD) retreated slightly from intraday highs near two-week highs hit during the Asian session on Tuesday, but still held steady near $3,360, extending gains for a second day in a row. Improved U.S. economic data helped ease market concerns about a recession, providing mild support for the dollar. At the same time, signs that Sino-U.S. trade tensions may ease curbed gold's safe-haven demand, prompting some investors to take a wait-and-see approach ahead of the much-anticipated two-day Federal Open Market Committee (FOMC) policy meeting.
The Trump administration's imposition of tariffs of up to 25% or even 100% on semiconductors will further disrupt the global semiconductor supply chain, forcing many semiconductor manufacturers to look for alternative sources of supply or manufacture in the United States.
📊Comment Analysis
Bulls regained their dominance, and the upward trend approached 3400 before the market expected a rate cut
💰Strategy Set
🔥Sell Gold Area: 3418-3420 SL 3425
TP1: $3410
TP2: $3400
TP3: $3385
🔥Buy Gold Area: $3323 - $3321 SL $3316
TP1: $3330
TP2: $3340
TP3: $3358
⭐️ Note: Labaron hopes that traders can properly manage their funds
- Choose the number of lots that matches your funds
- Profit is 4-7% of the fund account
- Stop loss is 1-3% of the fund account

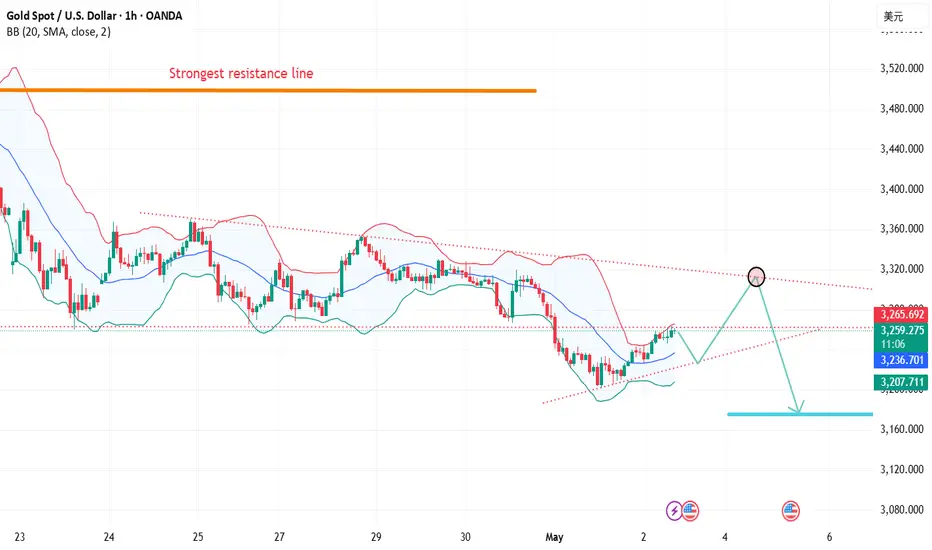
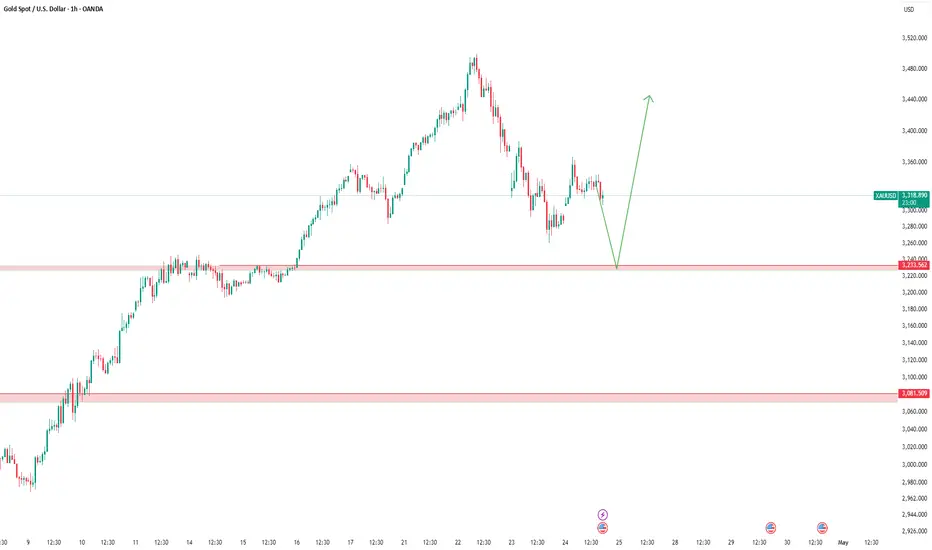
GOLD / XAUUSD: Breaking the down channel (correction wave)Therefore, if the 21-day SMA holds in the event of a weak US Non-Farm Payroll (NFP) report, a rebound toward the immediate static support-turned-resistance at 3260 could occur.
A sustained move above that level would encourage Gold buyers to push further toward the former channel support, now acting as resistance, at 3405.

Is the gold market ushering in betting?
📌 Gold driving factors
There are two aspects to look at the impact of April non-agricultural data on the gold market.
One is the data itself and the existing economic environment, and the other is combined with the technical aspect.
The market itself is troubled by the tariff issue. Whether it is the US stock market or the US dollar, it needs good economic data to boost it. Once the April non-agricultural performance is poor, the market sell-off will be out of control, and it also means that the risk of US economic recession is increasing.
Secondly, good data performance reduces the Fed's expectations for rate cuts. As we all know, the Fed's expectations for rate cuts or rate cuts are theoretically good for gold prices, and vice versa.
The cooling of the tariff issue may come soon, which is also not conducive to the rise in gold prices, but cooling does not mean the end, and the final achievement will definitely take some time.
📊Comment Analysis
"After experiencing short-term fluctuations, the price of gold appears to be relatively stable around $3,250. If it is to rise further, it must break through the $3,300 mark. But whether the market is ready to break through this point remains to be seen."
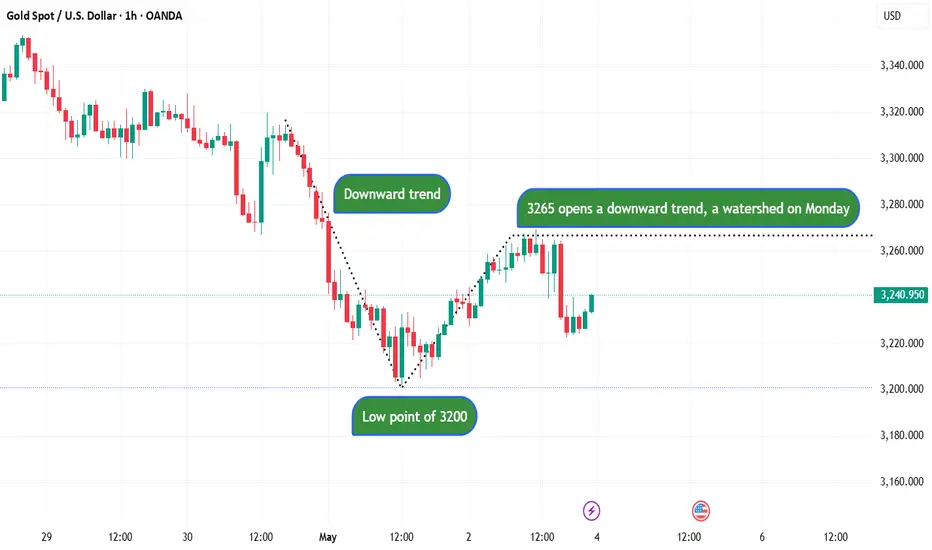
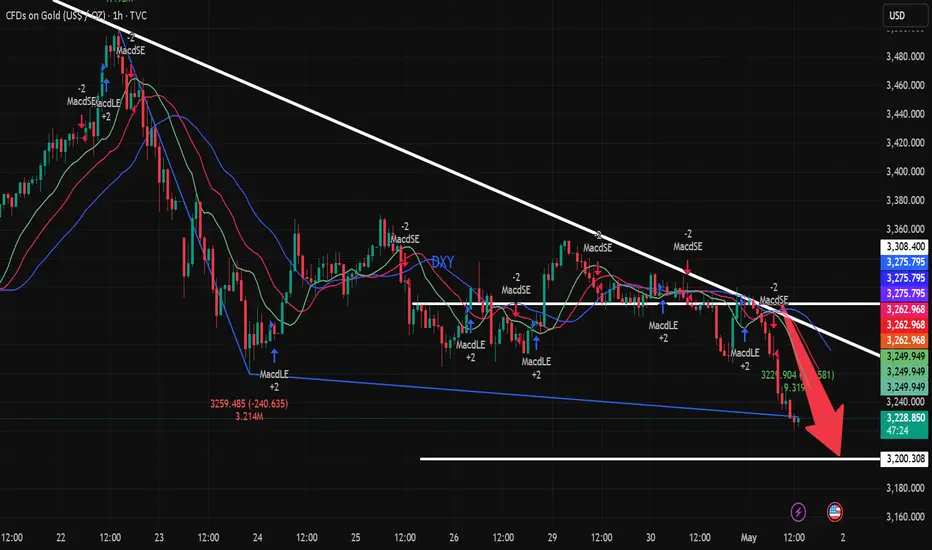
At present, gold is still in a continuous adjustment trend. Although it retreated to the 3,200 line on Friday and then rose again, it is still under pressure below the opening of the 3,265 decline. This is also the pressure level we need to pay close attention to next Monday!
The sideways trading period on Friday is long enough, and it is time for a breakthrough. So how should we arrange the market next week? It should not rise, but it will fall instead. It is not difficult to understand the trend on Friday. If it rises in the morning next week, it should be noted that the upper 3,265 is the watershed. If it breaks through, it will continue to rise, but if it is still under pressure, it is our opportunity to enter the short position!
💰Strategy Package
Operation ideas for next week:
Short at 3265 gold, stop loss at 3275, target 3230-3220;.
The market fluctuates violently, and real-time entry and exit are mainly based on real-time guidance!
⭐️ Note: Labaron hopes that traders can properly manage their funds
- Choose the number of lots that matches your funds
- Profit is 4-7% of the fund account
- Stop loss is 1-3% of the fund account
GOLD 4H CHART ROUTE MAP UPDATE & TRADING PLAN FOR THE WEEKHey Everyone,
Please see our updated 4h chart levels and targets for the coming week.
We are seeing price play between two weighted levels with a gap above at 3282 and a gap below at 3224. We will need to see ema5 cross and lock on either weighted level to determine the next range. We have a bigger range in play then usual.
We will see levels tested side by side until one of the weighted levels break and lock to confirm direction for the next range.
We will keep the above in mind when taking buys from dips. Our updated levels and weighted levels will allow us to track the movement down and then catch bounces up.
We will continue to buy dips using our support levels taking 30 to 40 pips. As stated before each of our level structures give 20 to 40 pip bounces, which is enough for a nice entry and exit. If you back test the levels we shared every week for the past 24 months, you can see how effectively they were used to trade with or against short/mid term swings and trends.
The swing range give bigger bounces then our weighted levels that's the difference between weighted levels and swing ranges.
BULLISH TARGET
3282
EMA5 CROSS AND LOCK ABOVE 3282 WILL OPEN THE FOLLOWING BULLISH TARGET
3343
EMA5 CROSS AND LOCK ABOVE 3343 WILL OPEN THE FOLLOWING BULLISH TARGET
3404
EMA5 CROSS AND LOCK ABOVE 3404 WILL OPEN THE FOLLOWING BULLISH TARGET
3439
EMA5 CROSS AND LOCK ABOVE 3439 WILL OPEN THE FOLLOWING BULLISH TARGET
3503
BEARISH TARGETS
3224
EMA5 CROSS AND LOCK BELOW 3224 WILL OPEN THE FOLLOWING RETRACEMENT RANGE
3190
3138
EMA5 CROSS AND LOCK BELOW 3138 WILL OPEN THE SWING RANGE
SWING RANGE
3088 - 3046
EMA5 CROSS AND LOCK BELOW 3046 WILL OPEN THE SECONDARY SWING RANGE
SECONDARY SWING RANGE
3015 - 2988
As always, we will keep you all updated with regular updates throughout the week and how we manage the active ideas and setups. Thank you all for your likes, comments and follows, we really appreciate it!
Mr Gold
GoldViewFX

As expected, gold prices continue to fall
📌 Gold driving factors
There are two aspects to look at the impact of April non-agricultural data on the gold market.
One is the data itself and the existing economic environment, and the other is combined with the technical aspect.
The market itself is troubled by the tariff issue. Whether it is the US stock market or the US dollar, they all need good economic data to boost. Once the April non-agricultural performance is poor, the market sell-off will be out of control, and it also means that the risk of US economic recession will increase.
Secondly, good data performance reduces the Fed's expectations for rate cuts. As we all know, the Fed's expectations for rate cuts or implementation of rate cuts are theoretically good for gold prices, and vice versa.
The cooling of the tariff issue may come soon, which is also not conducive to the rise in gold prices, but cooling does not mean the end, and the final achievement will definitely take some time.
📊Comment Analysis
Recently, we have been very good at controlling the gold market. Keeping an eye on the changes in fundamental news is the focus of research and judgment. Of course, the technical direction is also of reference value. The next market will revolve around fundamental news, especially in the context of tariffs.
The non-agricultural data exceeded expectations, and the tariff issue may see "dawn". If it can be confirmed in the near future, the risk aversion sentiment will subside in the short term, which is not conducive to the rise of gold prices. There is a high probability that there is room for retracement, so there is no rush to chase now.
💰Strategy Package
Operation ideas for next week:
Gold 3265 short, stop loss 3275, target 3230-3220;.
⭐️ Note: Labaron hopes that traders can properly manage their funds
- Choose the number of lots that matches your funds
- Profit is 4-7% of the capital account
- Stop loss is 1-3% of the capital account
Non-farm data is released, and gold is still going to fall.
📌 Gold information
Today, the market will usher in the heavy non-farm data for April. From the expected value, there are only 130,000 people, far lower than the expected 228,000 people, and the unemployment rate remains at 4.2%.
If we refer to the unsatisfactory ADP data in April, then the number of non-farm people in April should have declined, or it is lower than expected, but the ADP data cannot fully correspond to the final non-farm data. This is the answer given to us by too many experiences in the past, so it cannot be concluded that the non-farm data this time will be lower than expected.
📊Comment analysis
Combined with the technical aspect, the strong technical pressure above the international gold price is around 3280, and then the 3300 mark. Even if it rebounds next, the pressure of the above two prices cannot be broken, and there is still a probability of a pullback adjustment. The initial support below is 3230, and after breaking through the position, it will follow the trend to explore 3205.
💰Strategy Package
If today's non-agricultural data cannot provide strong support for gold prices, the rise in gold prices in the short term will be difficult to sustain. The specific decision can only be made after the final release of the afternoon data and the guidance on prices. The trend fluctuations tonight will be very intense. Remember to strictly control your positions to prevent risks.
⭐️ Note: Labaron hopes that traders can properly manage their funds
- Choose the number of lots that matches your funds
- Profit is 4-7% of the fund account
- Stop loss is 1-3% of the fund account

NF shows a volatile downward trend
📌 Gold Information
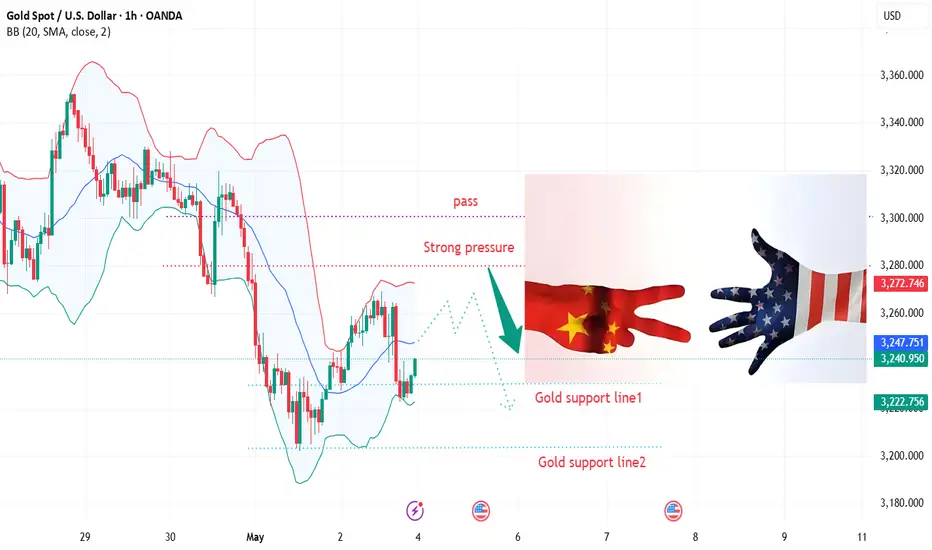
China's Ministry of Commerce announced on Friday that the United States has recently initiated communication through official channels, expressing interest in restarting tariff negotiations. Beijing is currently evaluating the proposal, which has sparked optimism that a solution to the long-standing tariff deadlock between the world's two largest economies is imminent.
New hopes for a breakthrough in trade negotiations helped the dollar rise to a three-week high on Thursday, pushing gold prices down towards the $3,200 mark. However, the dollar's bullish momentum remains weakened as the market increasingly digests expectations that the Federal Reserve may cut interest rates further, especially with the closely watched US non-farm payrolls data about to be released.
📊Comment Analysis
NF news volatility is certain, having accumulated significantly since last week. Gold price confirmed the trend after breaking through 3267, and fluctuated downward below 3200
💰Strategy Package
TP1: $3290
TP2: $3280
TP3: $3270🔥
Buy gold area: $3175 - $3177 SL $3170
TP1: $3185
TP2: $3200
TP3: $3210⭐️
⭐️ Note: Labaron hopes that traders can properly manage their funds
- Choose the number of lots that matches your funds
- Profit is 4-7% of the fund account
- Stop loss is 1-3% of the fund account
XAU/USD 02 May 2025 Intraday AnalysisH4 Analysis:
-> Swing: Bullish.
-> Internal: Bullish.
Analysis and bias remains the same as analysis dated 23 April 2025
Price has now printed a bearish CHoCH according to my analysis yesterday.
Price is now trading within an established internal range.
Intraday Expectation:
Price to trade down to either discount of internal 50% EQ, or H4 demand zone before targeting weak internal high priced at 3,500.200.
Note:
With the Federal Reserve's dovish stance and persisting geopolitical uncertainties, heightened volatility in Gold is expected to continue. Traders should proceed with caution and adjust risk management strategies in this high-volatility environment.
Price could also be driven by President Trump's policies, geopolitical moves and economic decisions which are sparking uncertainty.
H4 Chart:
M15 Analysis:
-> Swing: Bullish.
-> Internal: Bearish.
As mentioned in yesterday's analysis dated 01 May 2025 whereby I mentioned that I would continue to monitor price and depth of bullish pullback following the printing of a bearish iBOS followed by a bullish CHoCH.
Price did not pullback significantly enough to warrant a further bearish iBOS, therefore, I will apply discretion and not classify this as such, I have however marked in red.
Price has since continued bearish, subsequently printing a bullish CHoCH.
Internal structure is now established, however, I will continue to monitor price regarding depth of pullback as previous.
Intraday Expectation:
Price to trade up to either premium of internal 50% EQ, or M15 supply zone before targeting weak internal low priced at 3,201.955
Note:
With the Federal Reserve maintaining a dovish stance and ongoing geopolitical tensions, volatility in Gold prices is expected to remain elevated. Traders should exercise caution, adjust risk management strategies, and stay prepared for potential price whipsaws in this high-volatility environment.
Trump's tariff announcement will most likely cause considerably increased volatility and whipsaws.
M15 Chart:

Technical analysis of short-term gold operations!!!On Wednesday, the gold price generally showed a downward trend. The highest price rose to 3327.91 on the day, and the lowest price fell to 3266.79, closing at 3288.16. In view of the fact that gold fell under pressure during the early trading on Wednesday and broke through the four-hour and daily support as expected, and then the US market rebounded again and came under pressure, and finally ended in a big negative state at the daily level. The price has fallen below the daily support, so we need to pay attention to the continuation of the band decline in the future.
From a multi-cycle analysis, first observe the monthly rhythm. The price rose for three months in the early stage and then a single-month correction appeared. Recently, it has risen for four months and then a single-month correction appeared. Therefore, according to the rhythm, four consecutive positives have appeared. For May, we must pay attention to market risks. From the weekly level, the gold price is supported by the support level of the 3040 area. From the perspective of the medium-term, we can continue to maintain a bullish view, and the price drop is only a correction in the medium-term rise. From the daily level, the current price resistance is in the 3007 area, which is the key watershed of the band trend. If the price is below this position, the subsequent band will be treated as short. At the same time, for the short-term four-hour price resistance, it is around 3290, so the subsequent price will be treated as short under the four-hour resistance. In general, the price can be treated as short under the four-hour resistance and the daily resistance.
The gold correction continues!On the news:
Gold prices fell for a third day in a row as signs that trade talks between the United States and China may be progressing dampened demand for safe-haven assets. News that the Trump administration is about to announce the first batch of agreements, which will reduce planned tariffs on some countries, also eased concerns about the outlook for global trade.
Technical aspects:
After the current gold market broke down, it started to fall from around 3270, which is also the key position for us to continue to bet on the market falling. At present, the short position of gold is more advantageous. Then in the short term, gold will focus on the support near 3233. If it falls below, then gold will reach the 3200 mark.

Gold 3213 and 3272 are space switching points
📌 Gold information
The US non-farm payrolls report released this Friday (May 3) will become a market vane. If the employment data deteriorates significantly (such as the sharp drop in private employment growth shown by ADP), it may strengthen the expectation of interest rate cuts and promote the rebound of gold; on the contrary, if the data is stable, the US dollar may further suppress the price of gold.
The intraday decline in gold prices seems to be partly driven by technical selling pressure, after gold prices decisively fell below the key support level of $3,265-3,260. However, due to the unexpected contraction of US GDP and the intensification of signs of slowing inflation, the market's expectations for further interest rate cuts by the Federal Reserve (Fed) have increased, and the US dollar (USD) has found it difficult to maintain any significant rebound.
📊Comment Analysis
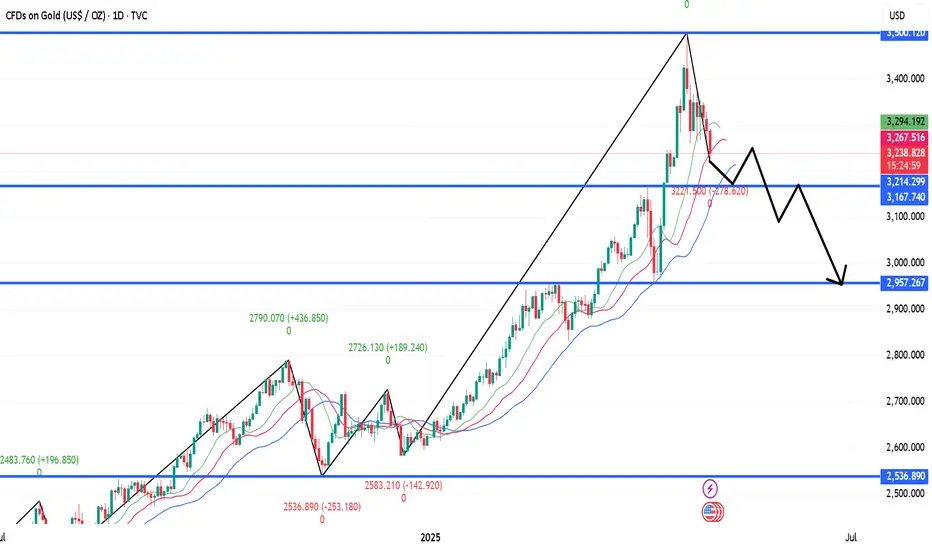
Gold price rose strongly by $544 in April. It entered the mode of space sweeping and adjustment from the confirmation of 3500. The next move is to sweep the range of the large range, starting at at least $40, and the range is $100, sweeping back and forth
💰Strategy Package
🔥Sell gold area: 3270-3272 SL 3277
TP1: $3260
TP2: $3250
TP3: $3240
🔥Buy gold area: $3178 - $3176 SL $3171
TP1: $3185
TP2: $3200
TP3: $3210
⭐️ Note: Labaron hopes that traders can properly manage their funds
- Choose the number of lots that matches your funds
- Profit is 4-7% of the fund account
- Stop loss is 1-3% of the fund account

GOLD...LONGPYTH:XAUUSD
Market structure suggests is preparing for its next move.
The AND level will likely play a critical role in the upcoming direction.
** If structure breaks and confirms the shift, a new bias might form after the retest. **
XAU/USD 01 May 2025 Intraday AnalysisH4 Analysis:
-> Swing: Bullish.
-> Internal: Bullish.
Analysis and bias remains the same as analysis dated 23 April 2025
Price has now printed a bearish CHoCH according to my analysis yesterday.
Price is now trading within an established internal range.
Intraday Expectation:
Price to trade down to either discount of internal 50% EQ, or H4 demand zone before targeting weak internal high priced at 3,500.200.
Note:
With the Federal Reserve's dovish stance and persisting geopolitical uncertainties, heightened volatility in Gold is expected to continue. Traders should proceed with caution and adjust risk management strategies in this high-volatility environment.
Price could also be driven by President Trump's policies, geopolitical moves and economic decisions which are sparking uncertainty.
H4 Chart:
M15 Analysis:
-> Swing: Bullish.
-> Internal: Bearish.
Price has printed as per my analysis dated 24 April 2025 by targeting weak internal low and printing a bearish iBOS.
Price has subsequently printed a bullish CHoCH to indicate, but not confirm bullish pullback phase initiation.
Internal structure is now established, however, I will continue to monitor price regarding depth of pullback.
Intraday Expectation:
Price to trade up to either premium of internal 50% EQ, or M15 supply zone before targeting weak internal low priced at 3,221.320
Note:
With the Federal Reserve maintaining a dovish stance and ongoing geopolitical tensions, volatility in Gold prices is expected to remain elevated. Traders should exercise caution, adjust risk management strategies, and stay prepared for potential price whipsaws in this high-volatility environment.
Trump's tariff announcement will most likely cause considerably increased volatility and whipsaws.
M15 Chart:

Gold opens up callback space as expectedGold finally broke through the rhythm of continuous fluctuations in the morning and ushered in a relatively large correction.
After the cyclical retracement in the morning, a bottom-breaking market was formed. Generally, for a direct decline in the Asian session, we will put the watershed at the opening price, which is the current high point of 3290! But it is not very meaningful to look at this position now. According to the recent rhythm of Asian session decline, weak European session, and rebound in the US session. We can look at the second decline in the European session rebound.
But we should be more cautious in the US session. Especially in the second half of the US session,
Intraday short-term pressure: 3266-70 top and bottom conversion position below: hourly double bottom around 3211-3195 "Observe whether there is a key area for the signal of stopping the decline"
Gold is forming a head and shoulders pattern!Analysis and interpretation:
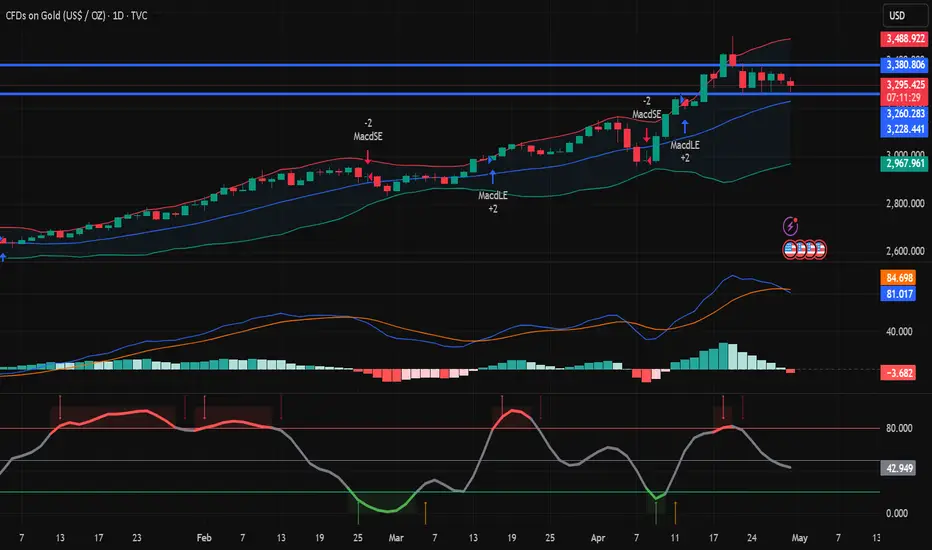
Gold prices have been on a strong upward trend since the beginning of 2025. The daily chart shows that gold prices have climbed from around $2,600 to around the $3,500 mark. Recently, gold prices have formed a consolidation trend in the range of $3,260 to $3,380, indicating that the bulls and bears are fighting fiercely here. It can be seen from the K-line chart that gold prices fell back after hitting a record high of $3,499.83 in April, but then gained support and rebounded at $3,260.
The Bollinger Band indicator shows that the upper track is at $3,465.75, the middle track is at $3,191.92, and the lower track is $2,918.08. The current price is running between the upper and middle tracks, indicating that the medium-term upward trend is still maintained. Although the gold price may fluctuate in the range of $3,260 to $3,380 in the short term, the overall upward trend has not changed.
The MACD indicator shows that DIFF is 81.35, DEA is 84.74, and the MACD value is -6.80. The histogram shows a shrinking state, indicating that the upward momentum has weakened, but no obvious short signal has been formed. The RSI indicator is around 58.81, which is in the neutral to strong area, and has not reached the overbought or oversold level, and there is still room for growth.
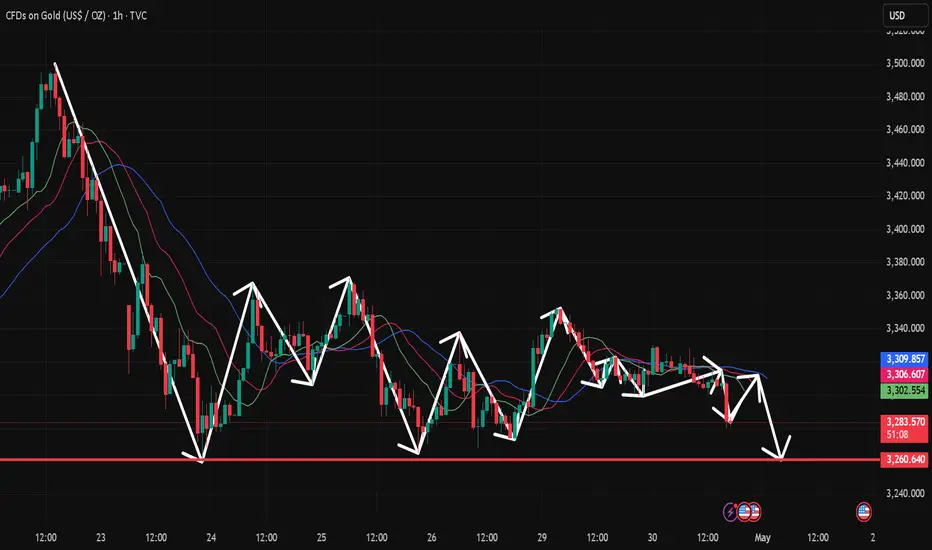
Gold falls as expected, awaiting guidance from ADPGold continued to fluctuate in 1 hour. Now, the gold fluctuation is most likely a relay of decline. Gold rebounds and continues to be short. The gold 1-hour moving average gradually begins to stick together, but it is still diverging downward. If it continues to cross downward to form a dead cross, then there is still room for gold shorts to fall. Gold hit a high twice and was suppressed by the 3330 line. Today, gold continued to be short at highs under the pressure of 3330.
Gold bulls continue to rebound every time. Now gold bulls obviously have no confidence in further rise, so gold shorts take the opportunity to exert their strength. Gold is still the home of shorts, and gold rebounds and continues to be short.
US trading operation ideas:
Gold 3320 short, stop loss 3330, target 3300-3290;
Gold maintains a volatile range, pay attention to subsequent breOn Tuesday, the gold price generally showed a downward trend. The highest price rose to 3348.45 on the day, and the lowest price fell to 3299.49, closing at 3316.95. On Tuesday, gold was under pressure during the early trading session, and then the price continued to fluctuate during the European and US trading sessions. Overall, the price is still running within the fluctuation range, but once the daily support is broken, it is expected to break the lower edge of the range.
From the multi-cycle analysis, first observe the monthly rhythm. The price rose for three months before and then a single-month correction occurred. Recently, it has risen for four months and then a single-month correction occurred. Therefore, according to the rhythm, April is generally bullish, but for May, we must pay attention to market risks. From the weekly level, the gold price is supported by the support level of the 3040 area. So from the perspective of the mid-line, we can continue to maintain a bullish view. From the daily level, the current price is supported by the 3004 area support. This position is the key watershed of the band trend. The market will further break down in the future, so it will be focused on in the future. At the same time, for the short-term four-hour price, it has been fluctuating up and down at the four-hour key position recently. Pay attention to the resistance of 3387 and 3370 on the top, and the 3260 area on the bottom. Before the data, the market as a whole tends to fluctuate temporarily. After breaking through the daily support, pay attention to the performance of breaking down the lower edge of the range.
Shorting opportunities are coming near 3330 in the US market!
📌 Driving events
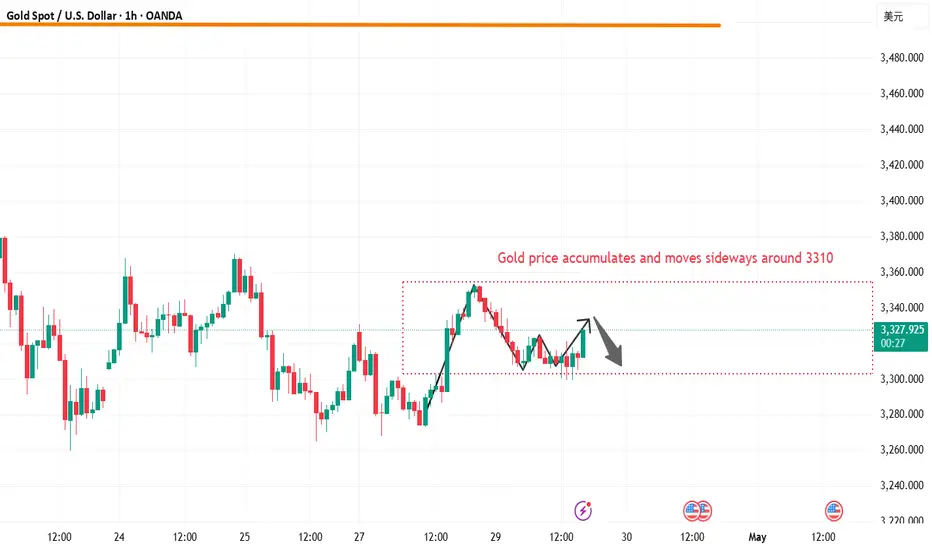
Because the easing of US-China trade tensions has weakened gold's safe-haven appeal, while investors are waiting for US economic data to assess the Fed's policy direction. Gold has been in a range recently as the market now waits for details of the first trade agreement, which is expected to be announced this week or next week.
📊Comment analysis
Gold reached a turning point last week, with Trump making some very positive comments, while stagflation risks continued to be excluded, and gold continued to fall. Stagflation pricing has driven gold prices higher, and as the market begins to exclude this risk, it is normal for a correction to occur, especially considering that "long gold" has become one of the most crowded trades.
💰Strategy Package
Short position:
Actively participate around 3330 points, profit target around 3300 points
⭐️ Note: Labaron hopes that traders can properly manage their funds
- Choose the number of lots that matches your funds
- Profit is 4-7% of the fund account
- Stop loss is 1-3% of the fund account
Gold's shock trend and interpretation of US market thinkingGold continues to fluctuate, we continue to look down in the European session, try long orders near 82;
2025-4-29 Tuesday Gold Asia-Europe long and short strategies
The market is always changing, the only constant is the existence of risks.
Keeping the principal is always the first principle.
◆Short order◆
Aggressive: short near 3356, stop loss 7 points, short at 62-68 after breaking,
Stop loss: stop loss 7 points each, or unified stop loss 77. Target: 3286-69-54-42, continue to reduce holdings after breaking
◆Long order◆
Aggressive: long at 82, stop loss 7 points, long at 75-70 after breaking,
Stop loss: stop loss 7 points each, or unified stop loss 62. Target: 98-06-12, continue to reduce holdings after breaking;
Steady: 66 long, stop loss 7 points, 58-52 long after breaking,
Stop loss: 7 points for each stop loss, or a unified stop loss of 42. Target: 98-06-12, continue to reduce holdings if the position breaks;
【Today's long orders must be promptly protected after profit, and the next position will be entered after the principal is protected】
Stop loss is determined according to your actual tolerance. Protect in time after profit, and enter the next position after protection】
★ Pattern analysis and attention:
Daily strategy ideas: Asia and Europe, our current price 06 long orders are also given to around 22 as expected. We are still bearish if the resistance is not broken, and try 82 long orders
【Reference: Russia-Ukraine peace talks, US-Japan tariff negotiations】
【Data: wholesale inventory rate, consumer confidence index, job vacancies】
☆ There is a delay in posting, and the final operation is based on real-time strategy and current price orders. Please continue to pay attention;
☆ Strategy orders are divided into warehouses, and the total position shall not exceed 20%;
