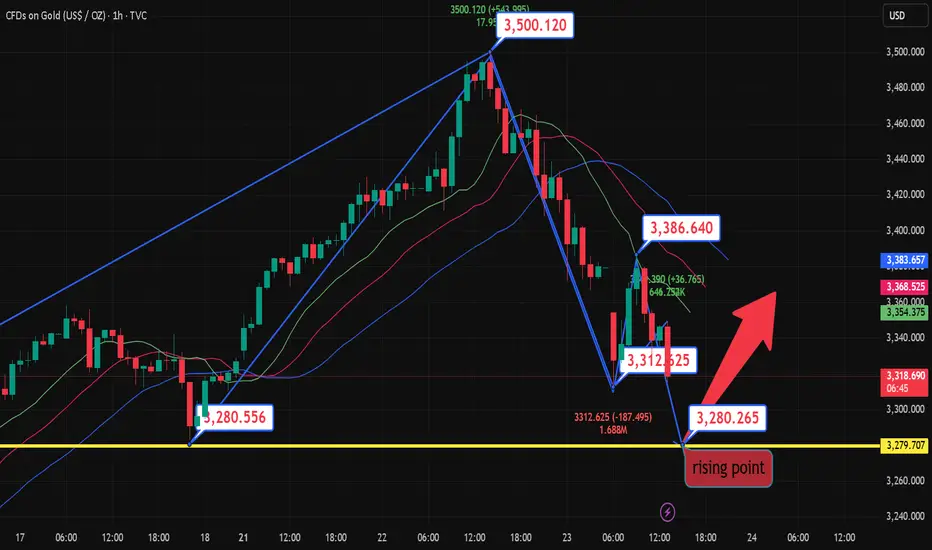
Gold fluctuates in a wide range, and the short-term trend is upwGold fell by $240 in two trading days, but the rebound was also very fierce, from yesterday's low of 3260 to 3367 in the early trading. The current volatility is still very large. The high and low points of $100 often appear, and it is normal to fluctuate by dozens of dollars. So pay attention to the market. There is no shortage of opportunities. Just grab what you can grasp.
The daily cycle has stepped back to the MA10 position. It has entered a critical stage. If the bulls recover, the strong rhythm is still there. It is too early to say that the peak has been reached. Pay attention to follow the market and don't be stubborn. The short-term resistance is 3386 and the 618 position of the decline and rebound is 3408. It is recommended to wait and see in the European session and look at the trend. Intervene in the US session.
Goldpriceaction

Gold profit taking continuesThe gold market opened at 3337.5 yesterday due to the profit-taking of the previous day. After the market fell back to 3315.6, the market rose strongly to fill the gap. The daily line reached a high of 3386.7 and then fell strongly. The daily line reached a low of 3259.6 and then the market consolidated at the end of the day. The daily line finally closed at 3287.9 and the market closed with a long upper shadow line. After this pattern ended, today's market continued to be empty. In terms of points, the short positions at 3496, 3468 and 3442 the day before were reduced and the stop loss was followed up at 3400.
SELL:3340 45 50 Stop loss: 55
TP1:3330
TP2:3320
TP3:3300

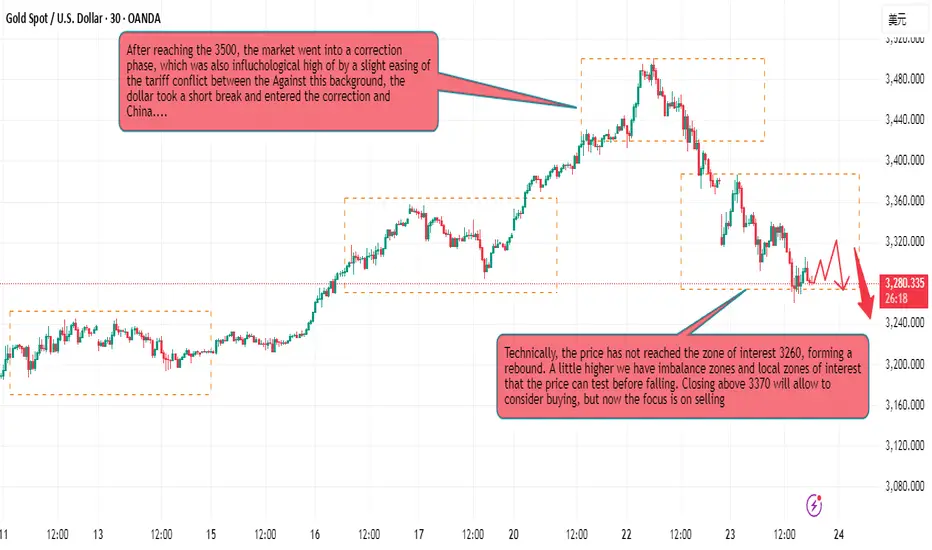
How is gold going? What to do now?After reaching the psychological high of $3500, it entered a correction phase, which was also affected by the slight easing of the US-China tariff conflict...
After failing to hit the 3250 area of concern, gold prices will be slightly stronger. Meanwhile, the market is looking forward to the US PMI data. Earlier, gold prices hit an all-time high of $3500, but fell back on hopes of a easing of the US-China trade war and the US Treasury Secretary's remarks about a possible "detente".
The dollar recovered in the correction, but investors doubted Trump's predictability and gold prices began to pull back at this time. The focus is on the S&P Global PMI index: the results of this index may affect expectations for the federal funds rate and bring a new direction to the market.
From a technical point of view, gold prices are in a correction and confirm the bearish structure. But any unexpected remarks from Trump may attract a lot of buying.
Quaid data analysis:
Upward resistance: 3340, 3360
Downward support: 3280, 3250
Quid believes that buying can be considered when retesting the support level or closing above 3370.
Traders, do you agree with Quaid's idea? Please leave your thoughts. I'll be happy that way.
Gold "skydived" from $3,500, where will the landing price be?Fundamental analysis: the game between policy signals and safe-haven demand
From a fundamental perspective, Trump's moderate statement is the core driving factor of this round of gold correction. However, as tariff expectations cool, investors are beginning to reassess the attractiveness of risky assets. The three major U.S. stock indexes closed higher on Tuesday, and the 10-year U.S. Treasury yield fell slightly, indicating that the market's confidence in the economic outlook has recovered. Against this background, the safe-haven premium of gold has been weakened, and profit-taking has accelerated.
In addition, the Fed's policy expectations are still an important variable affecting gold. At present, the market generally expects the Fed to continue to cut interest rates in 2025, but the pace and magnitude depend on inflation data and economic performance. If the expectation of interest rate cuts further heats up, the US dollar index may be under pressure, thereby providing some support for gold.
Technical analysis: pullback pressure and key support
The gold price fell below the support of $3,300, and the next key level points to $3,282, which coincides with the low point on April 17. If the decline continues, $3,150, as the pivot point in early April, will become an important defensive line for bulls. On the contrary, if the price stabilizes and rebounds, the pivot point of $3,415 will be the first resistance level, and further upward movement needs to pay attention to the higher resistance of $3,464. It is worth noting that the current price is far away from the resistance level of $3,415, and the rebound momentum may be limited in the short term, unless new fundamental catalysts appear to push the RSI back to the overbought area.
Quaid's comprehensive analysis:
The gold market has entered a consolidation phase after a rapid rise, and short-term correction pressure still exists, but in the long run, safe-haven demand and fundamental support remain solid. Quaid recommends that traders pay close attention to US policy trends, the trend of the US dollar, and the performance of key technical levels to grasp the market rhythm.
At the same time, Quaid will always pay attention to international news so as to make timely analysis and suggestions for traders; to help traders get out of the current predicament.

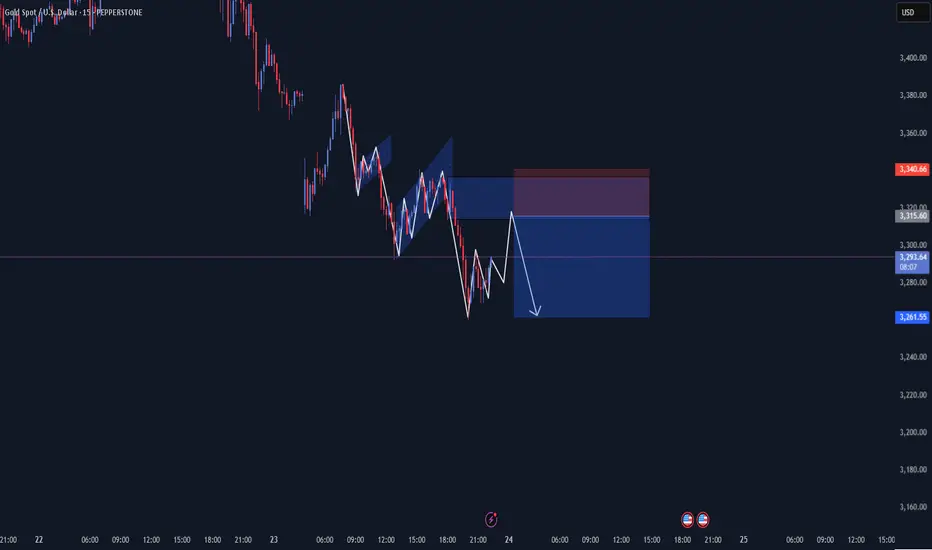
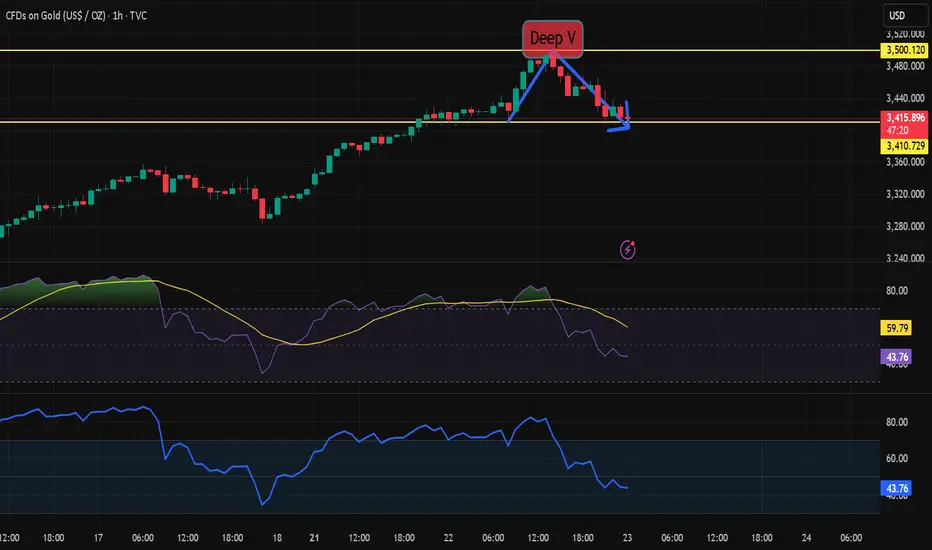
Gold Price ActionHey traders! 👋 Looking at the current structure, gold has been respecting the bearish trend perfectly — with each flag pattern breaking down as expected.
🔴 We're now seeing a pullback into a key supply zone and the setup is shaping up for a potential short opportunity.
Let the market come to you, no need to chase 🙌
Manage your risk wisely 📊
Wishing you all green pips and solid setups! 💰✨
Happy Trading! 🔥
Gold continues to pull back to the turning point!!!In the 4-hour chart, the price found support near the 3284 area (the recent swing low) and rebounded. Buyers stepped in at this position and set risk below this support level in an attempt to push prices higher again. Sellers hope that the price will fall below this level to push the price further down to the 3167 area.
1-hour chart
On the 1-hour chart, a short-term downward trend line can be seen, which is currently limiting the market's bullish sentiment. Sellers may establish positions near this trend line and set stops above the trend line with a target of 3167.

Gold short position wins streak, waiting to continue shortingThe 1-hour moving average of gold continues to turn downward. If a downward dead cross pattern is formed, then there is still room for gold bears to fall. Gold is under pressure to fall near the resistance line of 3340.
Gold's current rebound is not very strong. Although it seems to rebound a lot every time, that is because the market volatility has increased. Gold is still a bearish trend in the short term, and the rebound continues to be bearish.
Trading ideas: short gold near 3338, stop loss 3350, target 3318

Gold falls from highs, medium-term bullish structure remains uncSpot gold prices continue to fall, extending the correction of the psychological level of $3,500.
At the same time, senior Trump administration officials hinted that they are "paving the way" for a trade agreement with Asian powers, further boosting investors' confidence in the global economic outlook, thereby weakening demand for safe-haven gold.
Fed policy expectations still support gold's downward space.
Despite improved risk sentiment, the market still expects the Fed to launch a new round of interest rate cuts in June, with three rate cuts expected throughout the year, which makes gold's medium-term trend still optimistic. At present, weak US economic data and the president's erratic trade policy have further suppressed investors' confidence in US dollar assets.
Quaid believes that the market's expectations for the Fed's interest rate cuts have supported the structural upward trend of gold, even if it faces a technical correction in the short term.
Technical aspects show that gold may adjust in the short term, but the support below is strong.
Quaid's analysis:
The current adjustment pressure faced by gold comes more from short-term market sentiment repair and technical profit-taking, but the medium- and long-term fundamentals are still strong. The Fed's interest rate cut expectations have not changed, the US dollar has a clear medium-term weakening trend, and geopolitical factors are still highly uncertain. Gold is still in a bull-dominated pattern overall.
Operation strategy:
3325 long, stop loss 3315, take profit 3350. If it stops rising at 3350, traders can flip the operation strategy and short at this position.

Analysis of gold short-term operation ideasGold price is currently trading below 3330. The downward trend in Asian session broke through the 3315 position in the morning. Our short position also successfully harvested a wave of big profits. Gold price showed signs of rebound in early European session. Now the upper pressure level can be moved down. The short-term pressure level is 3318, followed by the second highest point on the way up at 3357. The lower support level focuses on 3285. After effectively breaking through, we can focus on 3245. Now gold price is trading near the early low of 3315. The prudent operation idea is to go short at 3320 for protection at 3331 and wait for the gold price to reach 3285. After the break, wait for the rebound to 3300 and go short again to see the position of 3245. Long positions are not recommended.
Interpretation of gold short-term operation ideasThe gold market opened at 3423.4 in the morning yesterday, and then the market fell back to 3411.6, and then the market rose strongly. The daily line reached a high of 3500.4, and then the market fell under technical pressure. Subsequently, the market took profits and went down. The daily line gave a low of 3365.8 and then the market consolidated. The daily line finally closed at 3381.2, and the market closed in an inverted hammer pattern with a very long upper shadow. After the end of this pattern, the market continued to be short after opening low today. In terms of points, yesterday's short positions at 3496, 3468 and 3442 were reduced, and the stop loss was followed up at 3445. If it opens low today and falls directly, give 3292 long stop loss 3285. The target is 3336, 3350, 3365 and 3374. Exit the market and continue the short stop loss at 3381. The target is not released and the loss is held in stages.

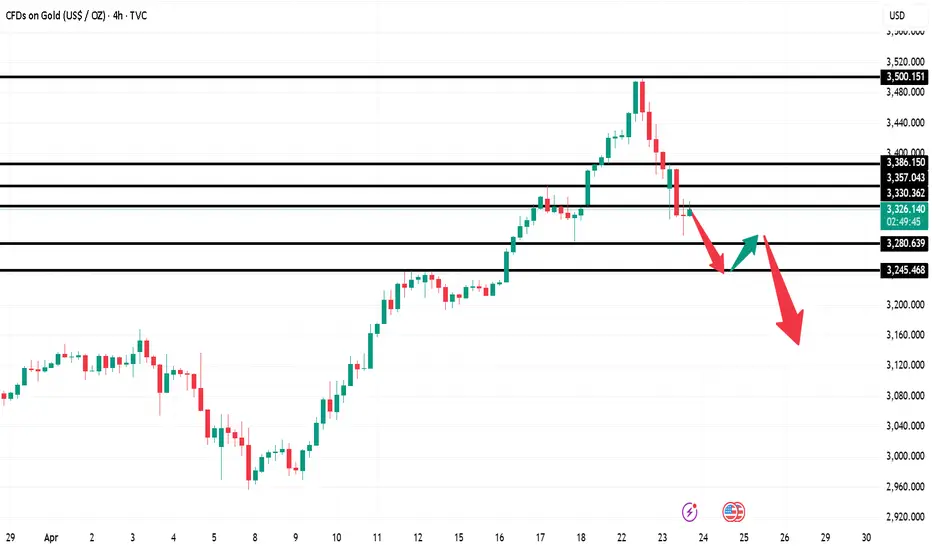
Tariffs ease, risk aversion drops, gold continues to be bearishAfter hitting the integer mark of 3500 yesterday, gold fell back by nearly 200 US dollars. Today's early trading opened lower and directly swallowed up the overall rise of yesterday. Will gold continue to correct or turn around?
From the current decline, the range from the high point of 3500 to the current low point of 3315 is close to 200 US dollars. Considering this round of decline, it has exceeded the range of short-term correction. Therefore, traders should guard against the probability that the gold price will enter a turning point in the short term!
After the current decline is too large, the main area is to go sideways to correct the main force. The overall rebound will not be too large.
Main area: around 3380-3400
Defensive support below: double bottom around 3280
Operation suggestion: Do not carry orders, heavy positions, lock positions in sudden change cycles, and bring stop losses! "Specific operations are subject to actual trading"
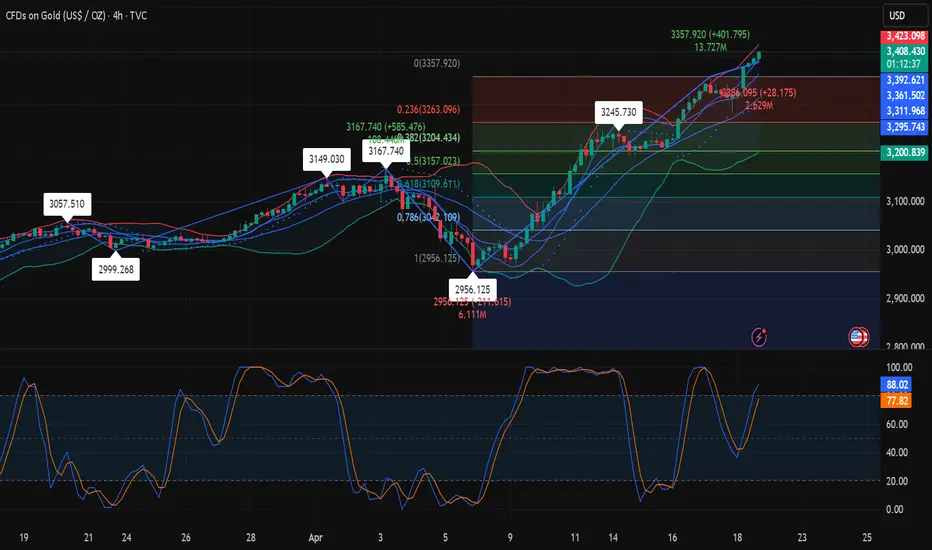
Gold hits 3500 retracement adjustmentGold Technical Forecast:
From a technical perspective, gold is confidently moving along a bullish trajectory. There is no doubt about that. But the signals now sent by the Relative Strength Index (RSI) and other momentum indicators are worth paying attention to. The daily RSI reading is close to 80, which has entered the severely overbought area. However, this does not necessarily indicate impending doom. It just confirms what we already know: buyers are in control.
So, is the price close to a top? Possibly. But I would not sound the alarm bells just yet. These high indicators are more of a warning than a battle cry. It is more of a "stay alert" than a "get out of here".
Spot Gold Technical Levels to Watch
Gold's climb to a record $3,500 was impressive, but as expected, it has begun to retreat slightly from this psychological high, most likely due to some conventional profit-taking. There is no natural resistance above this level; all we have are round numbers. However, on the way down, the situation is different.
Technical Analysis
Initial support includes Monday's high of $3,430 and the round number mark of $3,400 on the daily chart. Looking further down, $3,357 is last week's breakout level, followed by reliable support at $3,300. If a more meaningful pullback occurs, $3,245 and $3,167 will be worth watching, both of which were previous resistance ranges and are now likely to become support levels.
Gold price breaks through a new high of 3500 and enters the key Gold price hit a new record high of 3500. After reaching this point, it showed obvious pressure and went down to find the 3461 area. This is the largest correction since the rise of 3284 last Thursday.
Today's early trading price also continued to rise and break through the new high, but there was an episode, that is, it first broke through the high of 3444, then fell sharply to 3412, and finally confirmed the strong rise at 3418 to break through the new high, and continued to break through the sprint
Until noon, it sprinted to 3495 and suppressed the decline to find 3473 support, and then pulled up again to sprint to break the high of 3500. This time the decline was relatively strong, falling to the 3461 area
So far, the rising process can be slightly slowed down and enter a wave of adjustment
Accumulate momentum to provide power for the next round of start-up
During the adjustment process, pay attention to the golden section line
This wave from Since the rise from 2970, the largest adjustment squat is 0.382, and now this position is 3417, which is close to the Asian market acceleration starting point 3418. The two together become the stabilizer of the bullish trend: 0.382 position 3417 area
This is the first focus of today. During the adjustment process, pay attention to the position of the golden section line
0.382 position is 3417, close to the acceleration starting point
0.500 position is 3391, close to the 3384 area along the channel line
0.618 position is 3366, close to the four-hour lifeline
The current price space is large and the speed is fast. Articles and analysis are only auxiliary, and are more temporary reminders. Plans cannot keep up with changes. The three key points mentioned above can be kept in mind. If there are price variables during the process, they can also be adjusted accordingly.

Gold 3500 mark is about to openThe gold market opened at 3331.4 yesterday morning, then fell back slightly to 3328.6, then strongly fluctuated and pulled up, breaking through the previous week's high of 3358 and the pressure of 3387 and the 3400 integer mark, and then reached the highest position of 3430.8, and then the market consolidated. The weekly line finally closed at 3424.8, and the market closed with a basically saturated big positive line. After this pattern ended, today's market still has bullish demand driven by risk aversion and bullish sentiment, with the target at 3465, and the break at 3480 and 3500

Gold hits a new high. Will it have no ceiling?Analysis of gold trend:
Spot gold continued to rise in early Asian trading on Tuesday.
Fundamentals:
On Monday, the US dollar index plunged to its lowest level in three years as Trump's remarks on Powell undermined investor confidence in US assets. The United States plans to impose new tariffs on solar products imported from Southeast Asia, and Trump's approval rating has dropped to the lowest since returning to the White House. Risk aversion has increased, and gold prices have strengthened significantly. The current global trade tensions will continue, and concerns about economic growth, inflation expectations, etc. will continue to support gold prices.
Technically:
From a technical perspective, it is difficult to see such a large upside, and in this uptrend, there is basically no room for adjustment. Therefore, it is difficult to keep up with the rise of this bullish trend. Gold does not guess the top in the bullish cycle, as long as it can give a decline, it is an opportunity to go long. From the daily chart, the big positive line in the daily K-line is pulled up, and the trend is mainly broken; the shape is bullish; the golden cross of the stochastic indicator suggests that the bulls have not ended; the MACD double lines are upward, which is the main bullish signal; the short-term 4-hour level, the current 5-day moving average support has moved up to the 3438 line, which is also the bullish support level after the normal adjustment of the market. It should be difficult to give a very strong trend, so you should be flexible in operation. Don't look at the serious divergence of MACD and the serious overbought of RSI for the time being, and you can't help but short it.
Quide's analysis: The current market rise is all due to tariffs, and the technical aspect has no great reference significance. As long as the tariffs are not relaxed, gold will be difficult to pull back. Today's gold rise is expected to rush to 3,500 US dollars. Further look at 3,520-3,550.
I am Quide. Seeing my analysis strategy, no matter the past gains and losses, I hope that you can achieve investment breakthroughs with my help and turn every tide of the gold market into our wealth wave.

Interpretation of gold US market operation ideas! ! !Gold continued to be bullish in the morning, and the 3400 mark has been broken. How will it evolve next?
The US dollar index directly fell on Monday morning, and the US Y index fell by more than 8% this year, causing gold to rise in a variable. The rise in gold caused by this situation will be greatly adjusted due to the recovery of the US dollar! The key to winning or losing tonight lies between 20 and 22 o'clock.
If the US stock market opens, it will fall below the 98 mark due to the southward movement of the US dollar, creating a new low since April 2022! The market's trust in the US dollar as a global reserve currency has declined! The possibility of turning to other safe-haven assets has increased, thereby increasing the variable of gold rising.
If based on this logic, tonight's 20-23 o'clock cycle is the main winning or losing day of this week!
Hypothetical principle: If it is postponed to the north during the day, everyone should pay attention to the selling pressure near 3415. As the price changes, the selling pressure is more likely to occur! And the defense line will rise in each round of corrective retracement!
Short-term defense line: 3355-3370-3383-3392
Pressure level above: 3430-3458
Risk notice: 1. When everyone is paying attention, long positions may fall at any time, and the range will not be less than 50-80 points!
2. The decline of the US dollar index will lead to a collapse in futures, which will trigger a chain reaction. Traders will face the possibility of gold settlement to fill the gap in other markets!
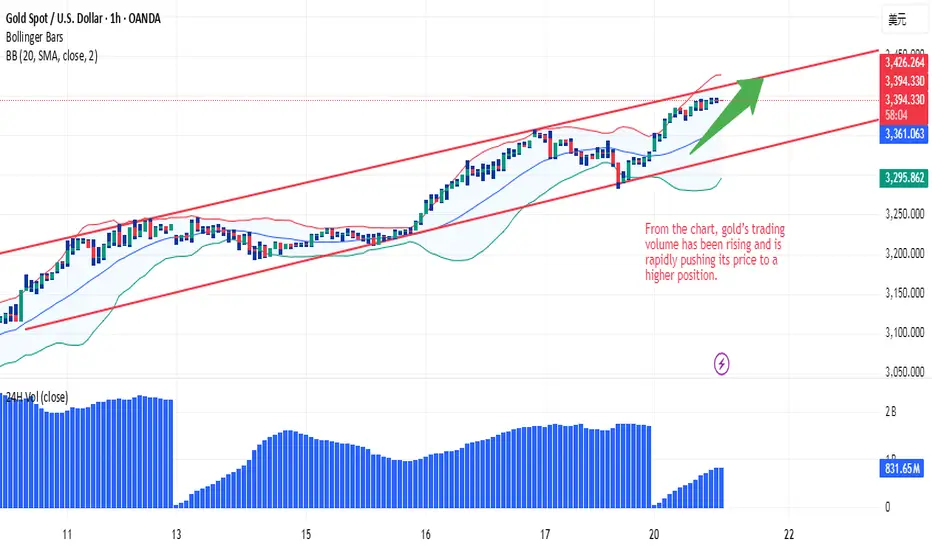
Gold is hard to break through 4000, short sellers are coming
Gold prices rose strongly in the Asian session on Monday, approaching the historical high of $3,400 per ounce, as concerns about the global trade situation intensified and the dollar fell to a two-year low due to concerns about economic recession. Despite the overbought signal on the technical side, the market's expectations of the Fed's rate cut and trade concerns continue to attract safe-haven funds to flow into the gold market.
Technical side:
Gold opened higher on Monday and has now risen from 3330 to 3394, with a range of $65. At present, gold indicators are expected to be severely overbought and a large correction may be needed at any time. In addition, the main force continues to push up gold to prevent the main force from fleeing. Gold is mainly shorted at highs below the 3400 mark!
SELL: 3394 Stop loss 3405
TP1: 3375
TP2: 3360
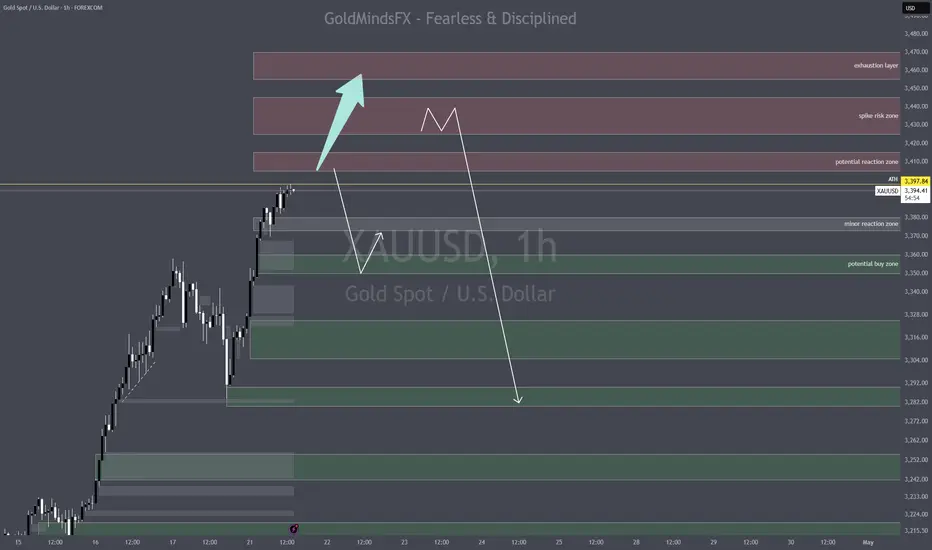
Gold Ideas 1H Market Analysis - Easter Monday 21st of April✅ XAUUSD – 1H Market Analysis (April 21, 2025 – NY Open Prep)
🕊️ Market Reminder:
It’s Easter Monday, and London + German markets are closed, so price may behave oddly due to lower European liquidity. NY might be more manipulative — expect traps, not clean momentum.
🧠 Current Market Context
Price is holding firm at new ATH: 3397
We’ve entered the "danger zone" — structure is still bullish but we’re deep in premium
No bearish CHoCH on 1H — but momentum is slowing down visibly
Clean higher lows since April 17 low (around 3284), all protected so far
🔺 Zones ABOVE Price (Premium Trap Zones)
🔺 Zone Range Notes
🟥 Premium Liquidity 3405–3414 Prior ATH + fib extension + ADR high – ideal NY fakeout zone
🔻 Spike Risk Zone 3425–3445 Overextended 1.272–1.414 fibs – only in case of news/fake rally
⚠️ Exhaustion Layer 3455–3470 Extension of fib projection (1.618 zone) – major trap risk if touched
🟢 Zones BELOW Price (Discount Value Areas)
🟢 Zone Range Notes
💧 Minor Imbalance 3373–3380 Quick scalp retrace area – only valid on clean rejection wick or M5 OB
⚙️ Intraday Balance 3350–3360 Great sniper re-entry zone – clean imbalance + OB overlap – 💥 HOT ZONE
🟩 Demand Base 3325–3305 Deep value OB + macro continuation zone – long setup if we fully retrace
🧱 Institutional Support 3284–3288 Clean CHoCH origin – trend-defining demand, invalidation if broken
📍 Structure Summary
1H still bullish, no bearish BOS
ADR is almost maxed out, so NY might trap above 3400 and then sweep lower
No fair retrace since 3360 breakout — buyers are sitting below, not above
Major liquidity pools now exist both above 3410 and below 3350
🔥 Bias:
Cautiously bullish, but we’re due for a shakeout.
🔻 If NY pumps into 3410–3425 and fails → fade it.
🟢 If price returns to 3350–3360 → sniper buy zone.
📉 No blind trades today. Let price trap first.
📌 Important Notice!!!
The above analysis is for educational purposes only and does not constitute financial advice. Always compare with your plan and wait for confirmation before taking action.
Trump's high tariff policy triggers risk aversion, gold price apGold prices maintained a strong upward trend during the Asian trading session, approaching the integer mark of $3,400 during the session, setting a record high. The main driving force is the market's growing concerns about US President Trump's latest tariff policy.
Trump recently announced that tariffs of up to 145% would be imposed on goods from some Asian countries, and some categories even reached 245%. According to market surveys, Asian countries also immediately imposed tariffs of up to 125% on US products, triggering concerns about the risk of a global economic downturn.
The current policy and trade uncertainties will continue to support the buying enthusiasm of non-yielding assets such as gold.
Despite the strong bull market, the technical side shows that gold is already in an overbought state, and the daily RSI index exceeds 70, indicating that there may be an adjustment or consolidation trend in the short term. If there is a pullback, the support levels are $3,350, $3,328 and $3,300, respectively, and the key support is in the $3,284 area.
Next focus of the market
This week, the market will focus on the upcoming global PMI preliminary data, which will provide further guidance on the health of the global economy. At the same time, the speech of Chicago Fed President Goolsbee may also have a certain impact on the trend of the US dollar.
Judging from the current multiple factors, the price of gold is still strong in the short term due to the support of risk aversion. However, the overbought signs on the technical side cannot be ignored, and the short-term adjustment will provide a more stable foundation for the medium-term rise.
Quide's operation suggestion:
3380 long, stop loss 3270, take profit above 3400.
I am Quaid. Seeing my analysis strategy, no matter the past gains and losses, I hope you can achieve investment breakthroughs with my help and turn every tide of the gold market into our wealth wave.
Interpretation of technical analysis of gold market opening operDue to the influence of Easter, the market was closed on Friday this week. After hitting a high of 3357, gold also ushered in a short-term adjustment! In the previous interpretation, we also emphasized to everyone that after hitting a new high, we should guard against the pullback caused by profit-taking. Especially at the critical time point when the market is about to close, but this does not mean the end of the bullish trend. After the sharp rise in gold, although there is selling pressure, gold still rose by 2.5% this week and closed above 3300.
So how should we trade gold next week?
The biggest driving factor for the rise in gold prices this time is Trump’s repeated tariff policy, coupled with the recent tense geopolitical situation, and the pace of global central banks buying gold. In the medium and long term, it is still a driving force for gold to rise.
Short-term operation: Pay attention to the first support level, which is 3310, which has been touched many times.
Short-term key support below: 3285-90
Short-term focus on high points above: 3340-45
If the breakthrough accelerates to the historical high point, everyone should be cautious in chasing more!

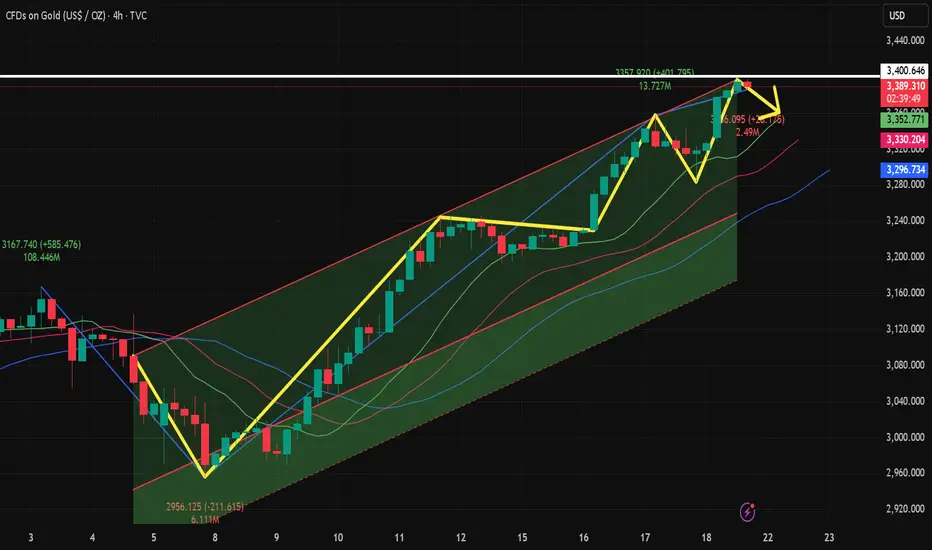
GOLD DAILY CHART MID/LONG TERM UPDATEHey Everyone,
After completing our last daily chart idea please see update on our new daily chart idea. We have also updated a new Goldturn ascending channel.
We are seeing price break out of the channel but will need ema5 to lock outside of the channel to confirm the breakout vs a fakeout. If this happens then the channel top is likely to to form support for a continuation, just like we are seeing the current candles bounce from the channel top, as support.
This is the beauty of our Goldturn channels, which we draw in our unique way, using averages rather than price. This enables us to identify fake-outs and breakouts clearly, as minimal noise in the way our channels are drawn.
We will use our smaller timeframe analysis on the 1H and 4H chart to buy dips from the weighted Goldturns for 30 to 40 pips clean. Ranging markets are perfectly suited for this type of trading, instead of trying to hold longer positions and getting chopped up in the swings up and down in the range.
We will keep the above in mind when taking buys from dips. Our updated levels and weighted levels will allow us to track the movement down and then catch bounces up using our smaller timeframe ideas.
Our long term bias is Bullish and therefore we look forward to drops from rejections, which allows us to continue to use our smaller timeframes to buy dips using our levels and setups.
Buying dips allows us to safely manage any swings rather then chasing the bull from the top.
Thank you all for your likes, comments and follows, we really appreciate it!
Mr Gold
GoldViewFX

GOLD, Is it 5th Wave?1. Sharp Movement, Steep Trade Angle
2. Length of 3rd Wave is equal to 5th Wave
3. Ascending Channel TGT is completed
4. Divergence in the Price Movement
5. Nifty Price Movement - It is at a breakout point. The Correlation between 2 asset classes is approximately Negative 0.30 to 0.35 post Covid
If this is the case, then price may not move beyond 1 Lakh
This will be a great opportunity to book the profit in gold; it may correct to 70000 or below in the next few months.

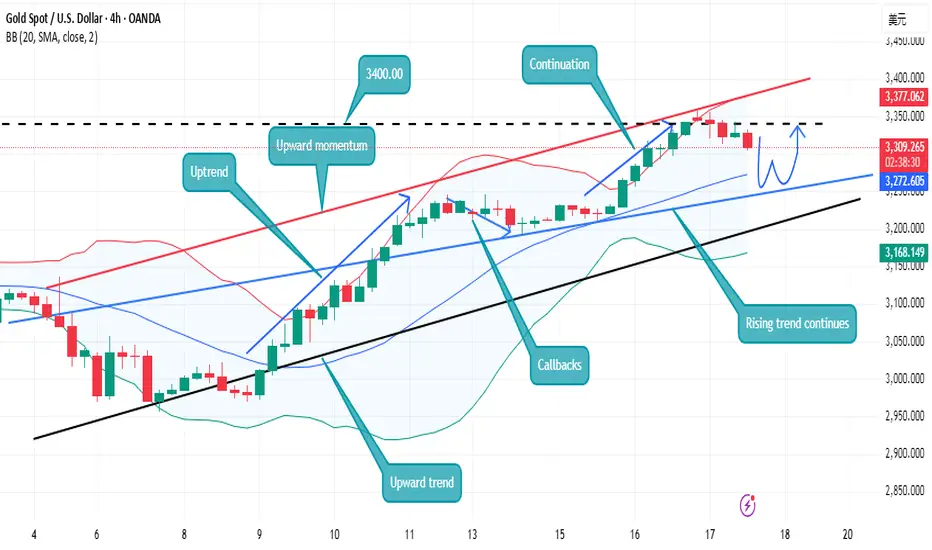
Gold hits new heights again, price correction may occurThe current consolidation fluctuations are completely in line with my previous predictions.
The market has hit new all-time highs again and there is a possibility of moving towards higher levels. The price has now hit the resistance area around 3320, which may mean the possibility of a correction in this area, creating long opportunities. The price has formed a sideways trend around 3220 points, which may be looking for a buy trade signal. In addition to these, there is an ascending trend line below the range, which previously served as both support and resistance. In view of the interest rate cut information released by the European Central Bank today, Quaid expects market volatility to increase. The expected target is the resistance area around 3390 points.
The market may continue to rise. On the chart, the price formed a strong positive line, which indicates the continuation of the upward trend. Currently, its price is retracing after hitting a new high. Some consolidation areas can be seen now, which play a supporting role in the bullish market. In addition, there is an ascending trend line, which has been broken many times before. I think that the retracement area of the previous volatility range may be a benign area to expect the continuation of the rise.
Quaid recommended:
Aggressive trades can be made by going long in the current consolidation area.
Smooth trading allows for part-time observation.
I hope this analysis can help you.
I am Quiad. Seeing my analysis strategy, no matter the past gains and losses, I hope you can achieve investment breakthroughs with my help and turn every tide of the gold market into our wealth wave.