Repeated cycle, timing is keyMarket fluctuations are oscillating about 70% of the time, and only about 30% of the time are unilateral upward or downward, so accumulating small victories into big victories is the magic weapon for long-term success. What we need to do is to plan our positions well, and make this investment with a plan, direction, and guidance. A good trader will make your investment journey smoother. How to operate in a volatile market? The ancients said: Do not do good things because they are small, and do not do evil things because they are small. If we move it to financial management, it can be understood as: Don't be too greedy, enter the market in batches. When entering the market and covering positions, the position should be small. Although the profit is less, accumulating small victories into big victories is the key to success. The investment philosophy is composed of the investor's psychology, philosophy, motivation, and technical level. It mainly includes: stability, patience, independent thinking, discipline, trend, etc.
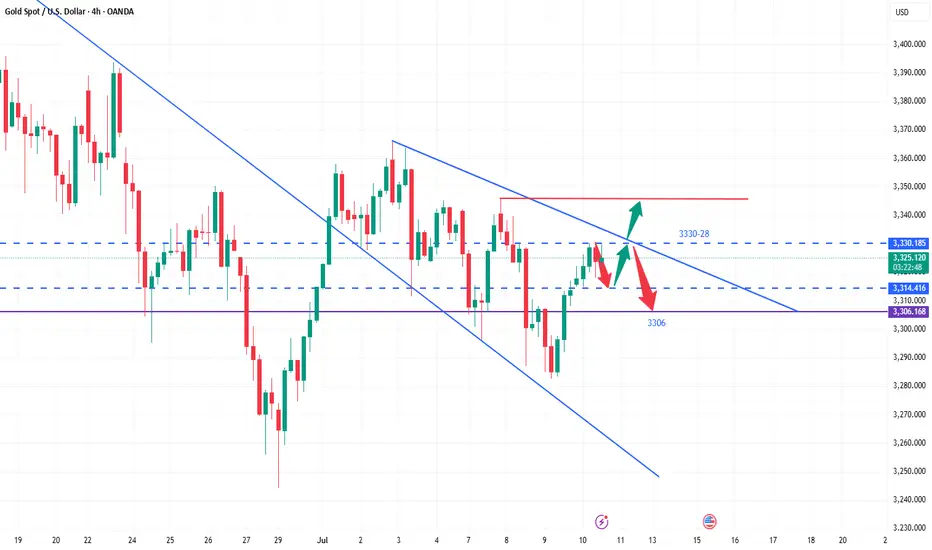
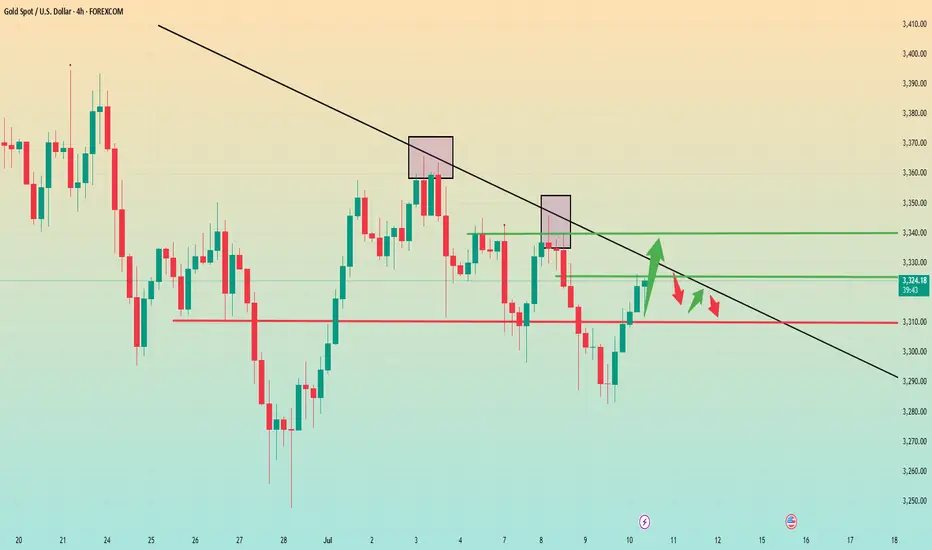
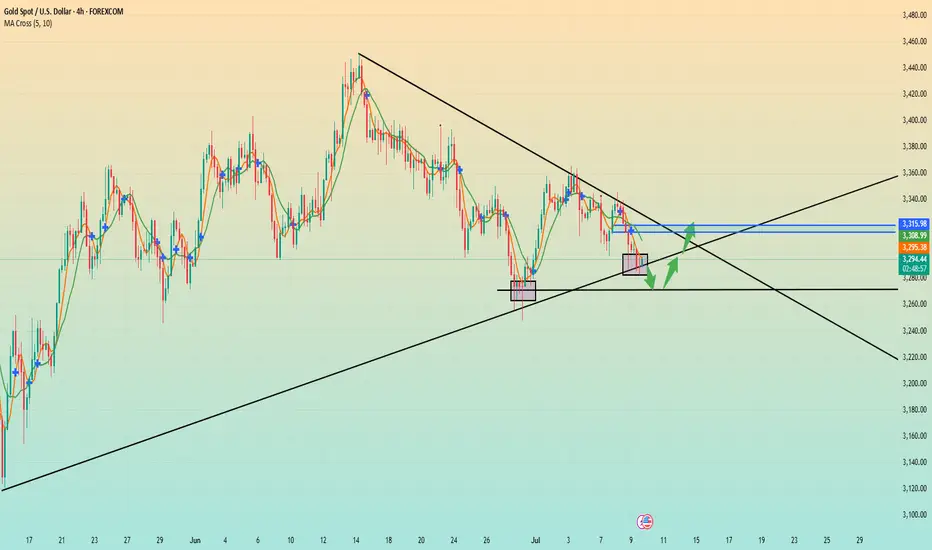
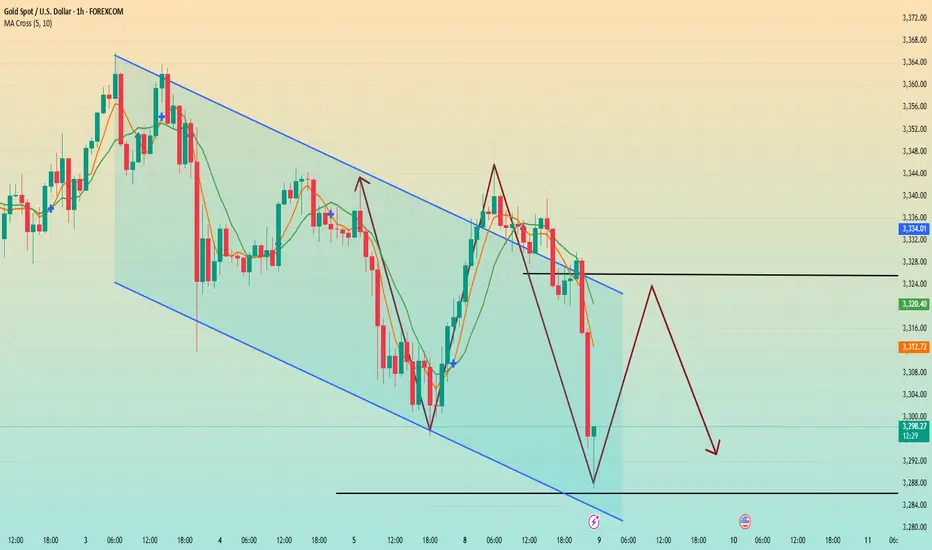
Judging from the current trend of gold, in the 4H cycle, it has touched 3330 many times under pressure, and the K-line has continuously closed with upper shadows, which is quite similar to yesterday's rhythm. So we must first look at the strength of the decline. The support below is at 3314 and 3306. In terms of operation, it should be treated as mainly long and auxiliary short. The upper pressure still focuses on the gains and losses of 3330.
Goldpriceaction
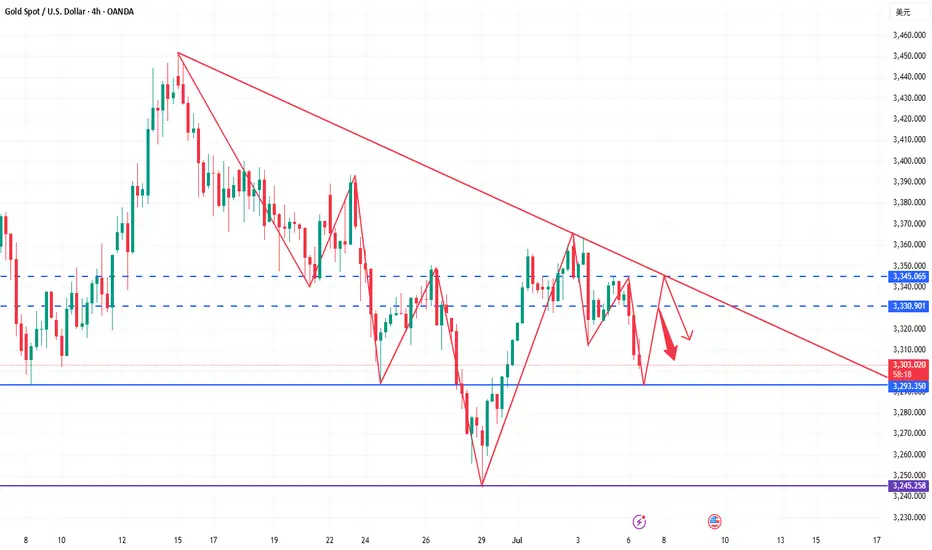
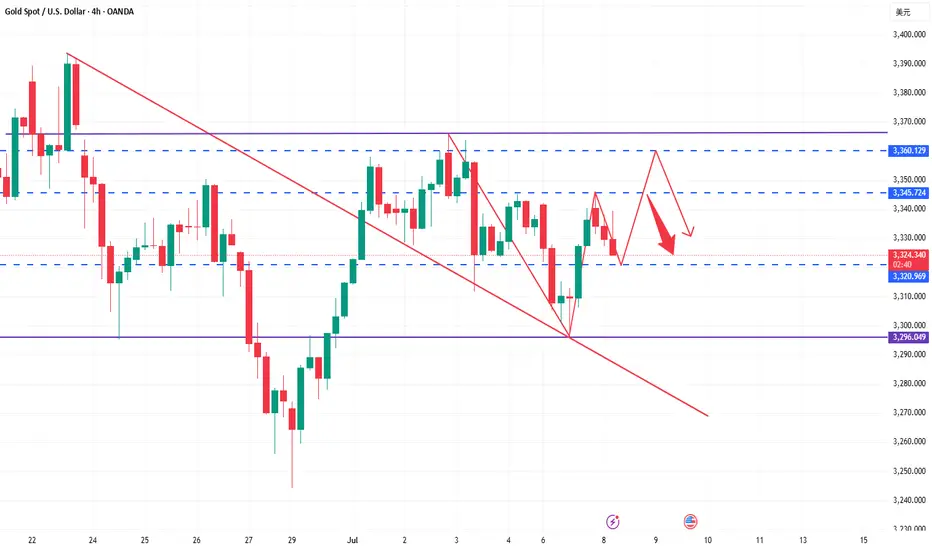
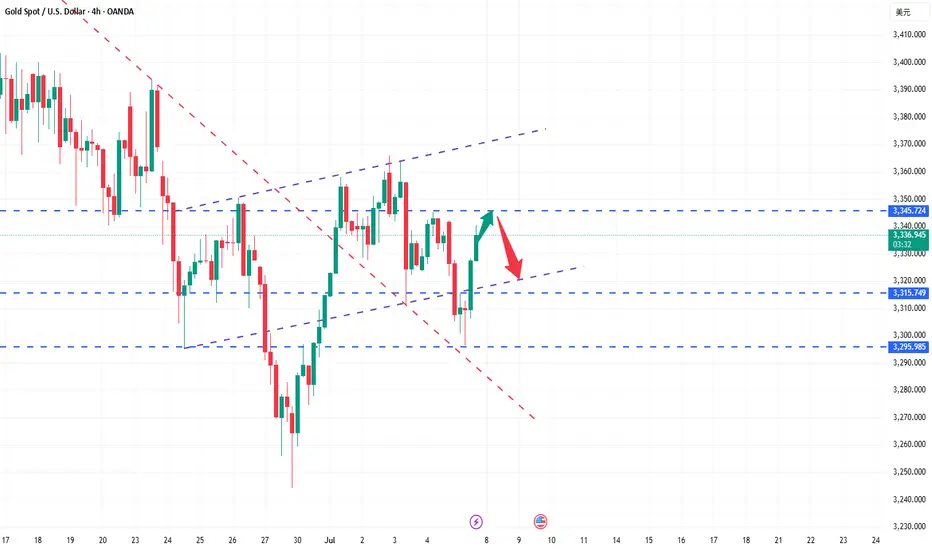
Gold shows signs of slowing down, are the bears ready?This wave of bullish pull-up is a complete rebound. With the help of the timeliness of fundamentals, the highest rebound only reached around 3330 and then began to fall. At this time, many people probably think that the short-term trend has begun to change. I still stick to my bearish thinking. The important target pressure is definitely around 3330. As long as this position is under pressure and falls back to 3280 again, it will be shaky. At present, the stop loss is based on the break of 3335. If it really breaks, it will be similar to the break of 3280. Even if 3340-3345 is short, it is also a short-term bull correction. If the falling channel is broken, I can't convince myself to continue to be short and stick to it. Once 3335 breaks, I can really confirm the reversal of the short-term trend. Then 3280 will also be the bottom of the medium term. In short, since I am shorting near 3320-3330 in the direction of the band and the short-term negative, I think that the stop loss will be given to 3335. The stop profit target is uncertain. The channel has not been broken. Now the short-term long and short conversions are frequent. It is definitely the best choice in my own trading system. No one will win all the time. It is too fake to win all the time. Make your moves according to your own ideas without regrets. If this wave of strategy verification fails, everyone is welcome to supervise. We dare to take responsibility and review every judgment.
XAU/USD 10 July 2025 Intraday AnalysisH4 Analysis:
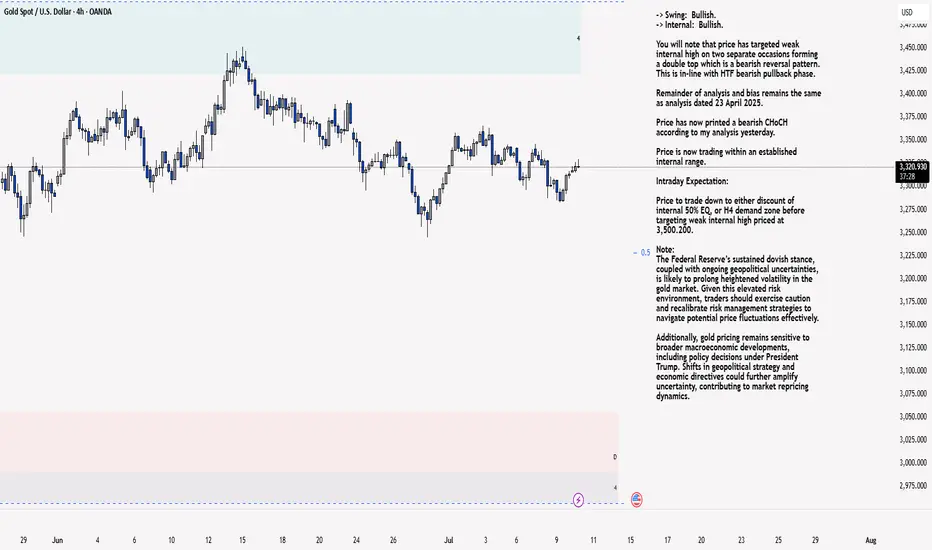
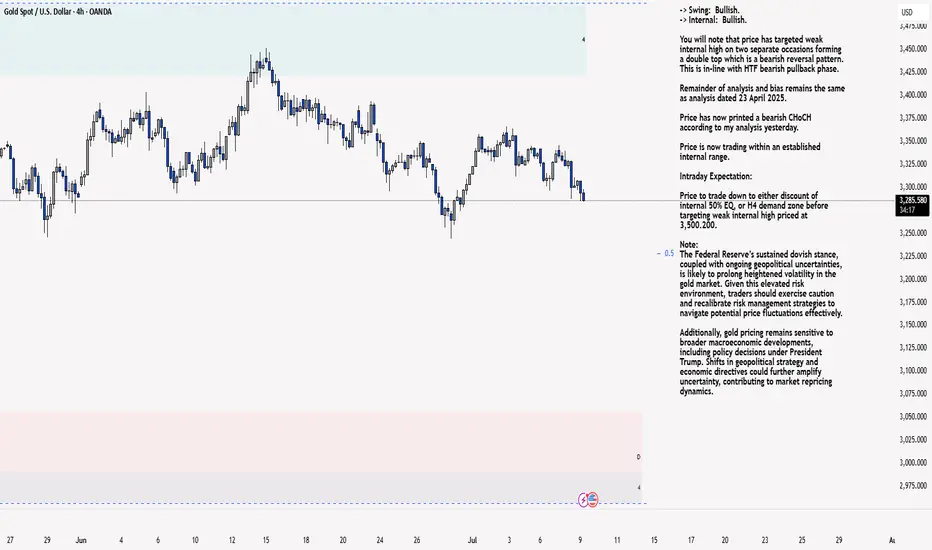
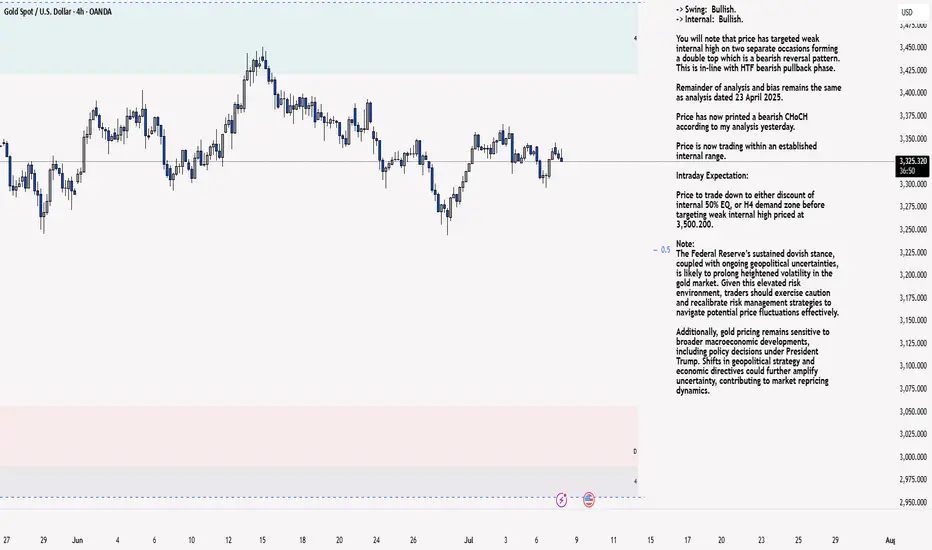
-> Swing: Bullish.
-> Internal: Bullish.
You will note that price has targeted weak internal high on two separate occasions forming a double top which is a bearish reversal pattern. This is in-line with HTF bearish pullback phase.
Remainder of analysis and bias remains the same as analysis dated 23 April 2025.
Price has now printed a bearish CHoCH according to my analysis yesterday.
Price is now trading within an established internal range.
Intraday Expectation:
Price to trade down to either discount of internal 50% EQ, or H4 demand zone before targeting weak internal high priced at 3,500.200.
Note:
The Federal Reserve’s sustained dovish stance, coupled with ongoing geopolitical uncertainties, is likely to prolong heightened volatility in the gold market. Given this elevated risk environment, traders should exercise caution and recalibrate risk management strategies to navigate potential price fluctuations effectively.
Additionally, gold pricing remains sensitive to broader macroeconomic developments, including policy decisions under President Trump. Shifts in geopolitical strategy and economic directives could further amplify uncertainty, contributing to market repricing dynamics.
H4 Chart:
M15 Analysis:
-> Swing: Bullish.
-> Internal: Bullish.
H4 Timeframe - Price has failed to target weak internal high, therefore, it would not be unrealistic if price printed a bearish iBOS.
The remainder of my analysis shall remain the same as analysis dated 13 June 2025, apart from target price.
As per my analysis dated 22 May 2025 whereby I mentioned price can be seen to be reacting at discount of 50% EQ on H4 timeframe, therefore, it is a viable alternative that price could potentially print a bullish iBOS on M15 timeframe despite internal structure being bearish.
Price has printed a bullish iBOS followed by a bearish CHoCH, which indicates, but does not confirm, bearish pullback phase initiation. I will however continue to monitor, with respect to depth of pullback.
Intraday Expectation:
Price to continue bearish, react at either M15 supply zone, or discount of 50% internal EQ before targeting weak internal high priced at 3,451.375.
Note:
Gold remains highly volatile amid the Federal Reserve's continued dovish stance, persistent and escalating geopolitical uncertainties. Traders should implement robust risk management strategies and remain vigilant, as price swings may become more pronounced in this elevated volatility environment.
Additionally, President Trump’s recent tariff announcements are expected to further amplify market turbulence, potentially triggering sharp price fluctuations and whipsaws.
M15 Chart:
Gold continues to short
Life is like a thread. As long as today continues and as long as there is hope for tomorrow, we will always be at the starting point and on the road to running. Don't be afraid of the long road, don't complain about the lack of scenery on the roadside, don't despair at any time, just keep running, the bumps under your feet are the cornerstones of our life, and perhaps the turning point is just around the next corner!
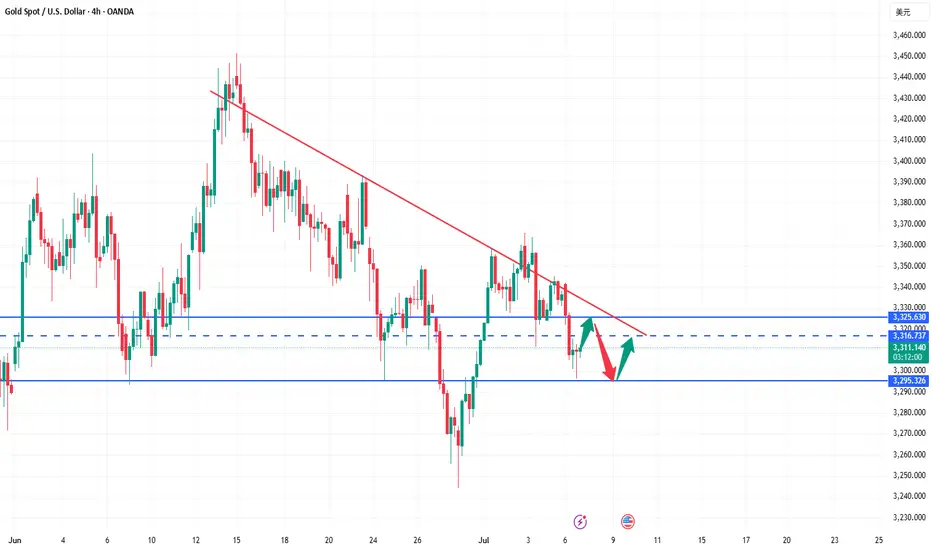
Gold, on the eve of the US market yesterday, the shorts repeatedly touched the lower support of 3282, but ultimately lacked the momentum to make a final push, which led to a reverse reversal in the US market and a continuous rebound effect. As of the morning of the day, the highest reached near 3326, and the daily line also closed at the bald small positive line of the lower lead. The current upper pressure is maintained at the previous 3330 line. This position will also be related to the continuity of the long and short positions in the later period, and the highest in the morning will also be maintained near this position. For the European market, this position is even more important. Once it continues to break through, the US market will likely continue to rise, and it can also be used as the position of the long and short watershed in the short term, and the recent trend continuity is extremely high. , most of them are maintained in the range of shock operation, and the support below will be maintained at 3310, which is also the key defensive point of the European session. Although the daily line is currently closed at a small positive line, it is still obviously insufficient in power, and the multi-hour line is also maintained in the downward channel without a breakthrough. In the short term, it is still in a bearish situation overall. If there is no breakthrough for a long time, it may continue to fall in the later period. If gold rebounds near the morning high, it can continue to short. If the European session breaks through strongly, it needs to adjust its direction before the US session. If gold rebounds near 3325-26, it can be shorted. The target is around 3310-00, and the loss is 3335!
Gold rebounds near 3325-26 during the day, and the target is around 3310-00, and the loss is 3335.

Trump blasted Powell again. Interest rates remain unchanged.Information summary:
Trump blasted Powell on Wednesday, saying that the current interest rate is "at least 3 percentage points higher" and once again accused Fed Chairman Powell of "making the United States pay an extra $360 billion in refinancing costs each year." He also said that "there is no inflation" and that companies "are pouring into the United States," and urged the Fed to "cut interest rates."
During the U.S. trading session, gold also showed a significant rebound momentum, rebounding from a low of 3285 to above 3310 in one fell swoop. As of now, gold has stood above 3320.
Market analysis:
From the daily chart:
It can be seen that the first suppression position above gold is currently at 3325, followed by around 3345. Gold did not close above 3320 on Wednesday, which means that even if gold is currently above 3320, as long as today's daily line closes below 3320, it is still in a bearish trend. On the contrary, if the closing price today is above 3320, then the subsequent test of the suppression position near 3345 may be further carried out.
Secondly, from the 4-hour chart, the current suppression position above 4 hours is around 3330-3335. Therefore, today we should focus on this position. If we cannot stand firm and break through the range suppression here in the 4-hour chart, we may retreat again in the future. The key support position below is around 3310, which is the opening price today. If the price is to retreat, it is likely to fall below 3310. But it may also remain above 3310 for consolidation.
However, as long as it falls below 3310, I think the low point near 3285 may be refreshed, so pay attention to this.
Operation strategy:
Steady trading waits for 3310 to fall and break through to short, and the profit range is 3385 or even lower.
Aggressive trading can short near 3340, with a stop loss of 3350.
Gold rose. Trend reversed.Gold rose slightly in early Asian trading on Wednesday, but fell under pressure near 3308. It fluctuated in the European trading range of 3296-3282. It broke through the US trading range and rose to around 3317 in the late trading. The daily line closed with a positive line with a lower shadow.
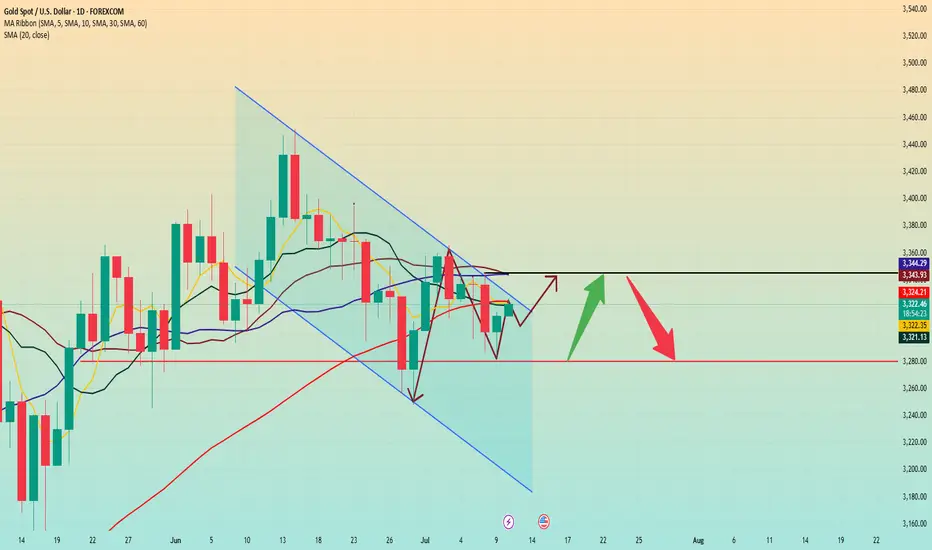
After a sharp drop on Tuesday, gold showed a downward recovery trend on Wednesday and closed positive. It rose slightly in early Asian trading today. From the daily level, in the short term, we should first pay attention to the resistance near 3325-3330. This area brings together the current positions of the 5-day moving average, the 10-day moving average and the 60-day moving average, which is an important gateway for the game between long and short forces in the short term. If the gold price continues to be under pressure in this area, it means that the short-term upward momentum is insufficient, and we need to be alert to the risk of a market decline.
If the above resistance area can be broken and the price continues to rise strongly, the next target will be the resistance near 3345, which is not only the high point on Tuesday, but also the current location of the 20-day moving average and the 30-day moving average, which has a strong technical resistance significance.
In terms of support below, first pay attention to the support near 3280, which is the current support level of the trend line formed by the low points of May 15 and June 30, which provides certain support for the gold price.
Operation strategy:
Short at price rebound near 3345, stop loss at 3355, profit range 3320-3300
Long at price drop near 3315, stop loss at 3305, profit range 3320-3340
The risks of shorting at low levels have been informed!Today, I have reminded you many times not to chase short positions at low levels. Now you can see that gold has bottomed out and rebounded. We also bought gold in batches at 3285-3295, and the long positions also made perfect profits. I believe that friends who follow my articles can see that I have always emphasized not to short at low levels. It is also obvious to everyone that we bought long positions near 3295-3285. In the future, we will continue to pay attention to the suppression of the upper 3318-3325 line. If the rebound does not break, we will look for opportunities to short. I hope everyone can grasp the entry position and hold the profit. The rebound will first look at the previous break point of the 3325 line, and then short when the rebound is suppressed! If your current gold operation is not ideal, I hope I can help you avoid detours in your investment. Welcome to communicate with me!
From the current analysis of gold trend, today's upper short-term resistance focuses on the hourly top and bottom conversion position of 3318-3325. The intraday rebound relies on this position to go short once and look down. The lower short-term support focuses on 3280. The overall support relies on the 3280-3325 area to maintain the main tone of high-altitude low-multiple cycles. In the mid-line position, keep watching and do less, be cautious in chasing orders, and wait for the opportunity to enter the market after the key points are in place.
Gold operation strategy: short gold rebounds near 3318-3325, target 3305-3295.
Gold lures shorts, mainly depending on the rebound.On Monday, the gold market rebounded. The root cause was that Trump sent tariff letters to 14 countries at one time. Even allies such as Japan and South Korea were not spared and were subject to high tariffs of 25% to 40%. This "extreme pressure" trade method instantly ignited the market's risk aversion sentiment. Funds poured into gold, pushing up gold prices. The market quickly saw through the "routine". On Tuesday, Trump extended the tariff deadline from July 9 to August 1. This delay was seen as a signal of "surrendering" under trade pressure, and trade tensions were eased. The safe-haven demand dissipated like a receding tide, and gold was sold off violently, plummeting by $35 in a single day, a drop of more than 1%, and the lowest fell to $3,287.2 per ounce.
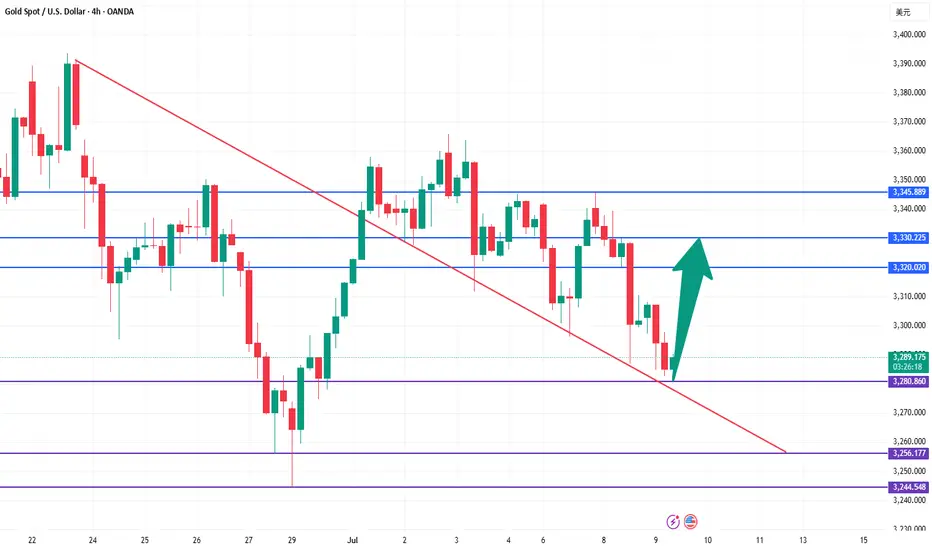
On Tuesday, the price of gold showed a trend of rising and falling. It reached a high of 3245 in the morning and then gradually fell. It fell to 3287 and then stopped falling and rebounded. As it failed to break through the key resistance level of 3345 and the price continued to be unable to stand firm on the middle track, the bulls' rebound momentum was insufficient. Yesterday's daily line closed with a large Yin line in the engulfing pattern. This K-line combination indicates that the gold price may continue to fall today. The focus below is on the support strength near the lower track 3280. The upper resistance level needs to pay attention to the 3320-3330 range. Today's daily closing is crucial. If the real big Yin line continues to close, it may drive the Bollinger Band to open downward and further open up the downward space; if the closing can stand above 3330, the short-term downward trend may end and the market is expected to restart the rise. From the weekly perspective, the gold price showed an obvious oscillation pattern this week. After rising on Monday, it fell back on Tuesday. The bulls and bears fought fiercely but failed to gain a decisive advantage. Although the current market is weak, the price is close to the important support area. In terms of operations, it is recommended that under the premise of controlling risks, you can now pay attention to the opportunities to buy on dips in the 3295-3285 area.
Data is about to be released. Where will gold go?Yesterday, the market expected a trade agreement between the United States and its trading partners, which boosted risk sentiment, and the strengthening of the US dollar and the rise in US bond yields further added pressure on gold prices. Gold fell 1% during the day and once lost the $3,300 mark during the session.
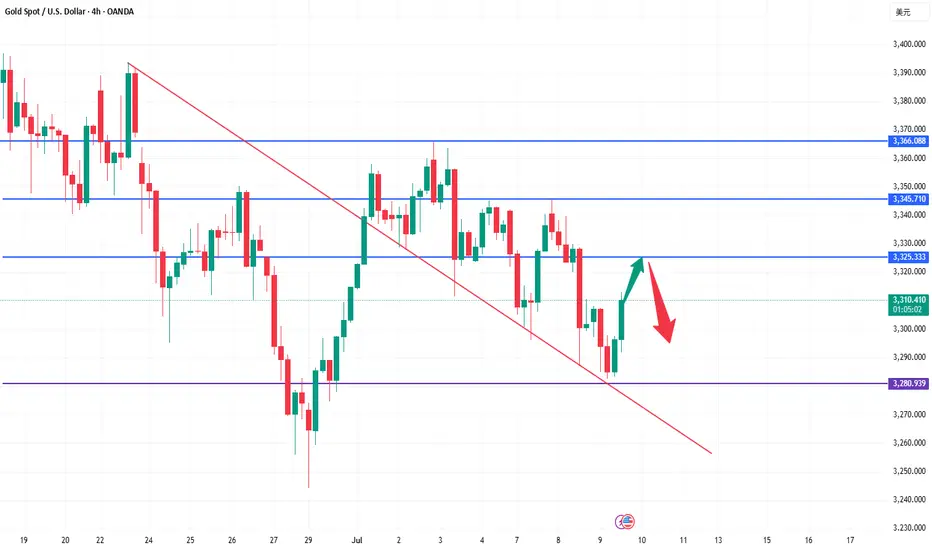
After gold bottomed out and stabilized at 3,320 on Monday, it fell sharply above 3,320 again on Tuesday and has now completely fallen below 3,320. The position of 3,320 is very important. In the 3,320-50 range, it chose to break down at 3,320 again.
Today, the Federal Open Market Committee of the United States will release the minutes of the June monetary policy meeting. Although Federal Reserve Chairman Powell remained neutral on the June interest rate decision, many Federal Reserve officials released dovish signals. Federal Reserve Board member Bowerman has turned to support the possibility of a rate cut in July.
From a technical point of view, the market has penetrated into the area around the lower support of 3,275-3,295.
The rhythm of the entire market is still a process of oscillating decline. From the perspective of pressure position, the daily MA5 average line has not fallen below, and may fall again to around 3270. Once the market falls too fast and approaches this position, there is a high probability that there will be a rebound demand.
Operation strategy:
Buy near 3375, stop loss at 3365, profit range 3315-3320.
Continue to hold position after breakthrough.
XAU/USD 09 July 2025 Intraday AnalysisH4 Analysis:
-> Swing: Bullish.
-> Internal: Bullish.
You will note that price has targeted weak internal high on two separate occasions forming a double top which is a bearish reversal pattern. This is in-line with HTF bearish pullback phase.
Remainder of analysis and bias remains the same as analysis dated 23 April 2025.
Price has now printed a bearish CHoCH according to my analysis yesterday.
Price is now trading within an established internal range.
Intraday Expectation:
Price to trade down to either discount of internal 50% EQ, or H4 demand zone before targeting weak internal high priced at 3,500.200.
Note:
The Federal Reserve’s sustained dovish stance, coupled with ongoing geopolitical uncertainties, is likely to prolong heightened volatility in the gold market. Given this elevated risk environment, traders should exercise caution and recalibrate risk management strategies to navigate potential price fluctuations effectively.
Additionally, gold pricing remains sensitive to broader macroeconomic developments, including policy decisions under President Trump. Shifts in geopolitical strategy and economic directives could further amplify uncertainty, contributing to market repricing dynamics.
H4 Chart:
M15 Analysis:
-> Swing: Bullish.
-> Internal: Bullish.
H4 Timeframe - Price has failed to target weak internal high, therefore, it would not be unrealistic if price printed a bearish iBOS.
The remainder of my analysis shall remain the same as analysis dated 13 June 2025, apart from target price.
As per my analysis dated 22 May 2025 whereby I mentioned price can be seen to be reacting at discount of 50% EQ on H4 timeframe, therefore, it is a viable alternative that price could potentially print a bullish iBOS on M15 timeframe despite internal structure being bearish.
Price has printed a bullish iBOS followed by a bearish CHoCH, which indicates, but does not confirm, bearish pullback phase initiation. I will however continue to monitor, with respect to depth of pullback.
Intraday Expectation:
Price to continue bearish, react at either M15 supply zone, or discount of 50% internal EQ before targeting weak internal high priced at 3,451.375.
Note:
Gold remains highly volatile amid the Federal Reserve's continued dovish stance, persistent and escalating geopolitical uncertainties. Traders should implement robust risk management strategies and remain vigilant, as price swings may become more pronounced in this elevated volatility environment.
Additionally, President Trump’s recent tariff announcements are expected to further amplify market turbulence, potentially triggering sharp price fluctuations and whipsaws.
M15 Chart:
Hold more than 3320 gold orders and wait patiently for the riseWe arranged a long order at 3320. Obviously, the market has given us an opportunity. After entering the long order, we should set a stop loss and wait patiently for the profit to be released. This is what we have to do, so there is no other idea and we are still bullish.
The current market has a clear rhythm, and the support is effective. In the short term, it is still a bullish structure. The structure is not broken and the direction remains unchanged. We will continue to advance the trading rhythm as planned.
🔸 Hold long orders near 3320, and the stop profit is 3335-3345 unchanged.
🔸 Strictly implement the trading plan, keep a stable rhythm, and wait for the market to realize the space.
Trade within the plan, rhythm first, keep an eye on the key points, and leave the rest to the market.
Gold Returns to the $3,300 per Ounce ZoneOver the past two trading sessions, gold has depreciated more than 1.5%, as a consistent bearish bias begins to emerge in price action. For now, selling pressure has remained steady, supported by a temporary decline in global economic uncertainty and a recent rebound in U.S. dollar strength, factors that have led gold’s upward momentum to steadily weaken.
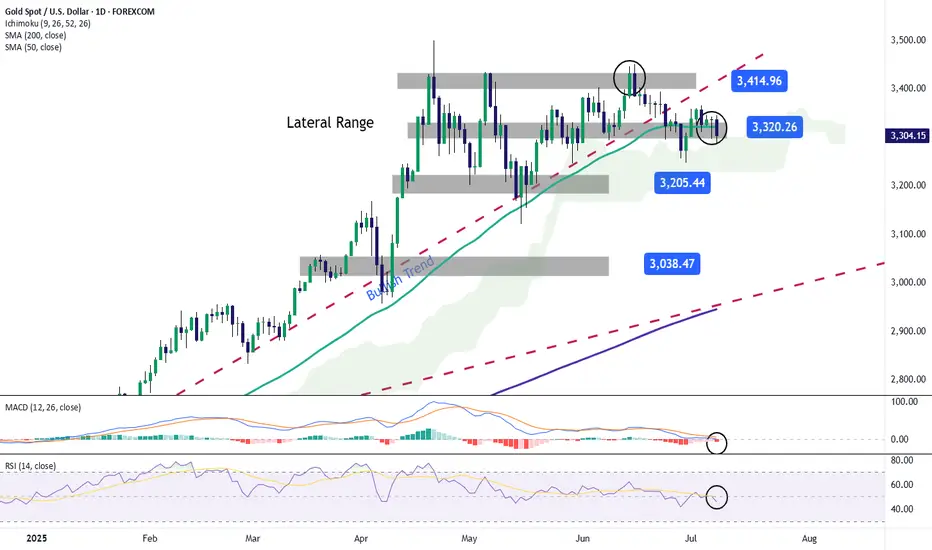
Lateral Range Remains Intact
Recent price action in gold has defined a well-established sideways channel, with resistance near $3,400 and support around $3,200 per ounce. So far, price movement has been insufficient to break out of this range, making it the most relevant technical structure to monitor in the short term. As long as price remains within these boundaries, neutrality may continue to dominate.
Technical Indicators
MACD: The MACD indicator continues to oscillate near the neutral zero line, signaling that momentum from moving averages remains balanced. If this pattern persists, the sideways range could extend further.
RSI: A similar pattern is unfolding with the RSI, which is hovering around the 50 level, indicating a constant balance between buying and selling pressure. Sustained moves at this level could reinforce short-term price neutrality.
Key Levels to Watch:
$3,400 per ounce: This historical high acts as the most significant resistance in the short term. A breakout above this level could trigger a stronger bullish bias and revive the upward trend stalled in recent weeks.
$3,300 per ounce: The current level aligns with the 50-period simple moving average. Price movement around this zone could extend market neutrality.
$3,200 per ounce: A key support level and recent low. A retest of this area could trigger a more decisive bearish bias in the short term.
Written by Julian Pineda, CFA – Market Analyst
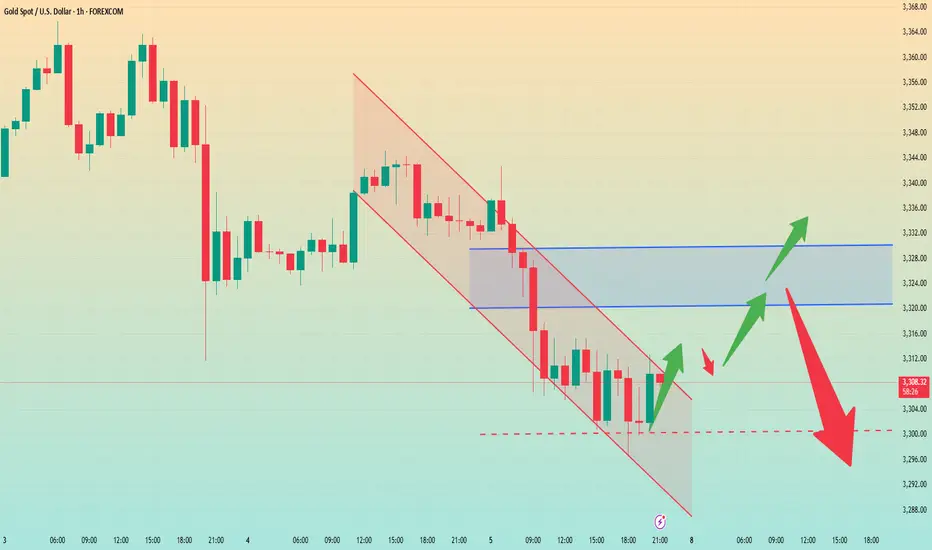
Gold is going down without any signs. Will it continue?Yesterday's seemingly strong rise in gold's safe-haven market may make people mistakenly think that gold is going to rise sharply, but the recent safe-haven market has poor sustainability and poor upward momentum, and cannot maintain the continuation of the upward trend.
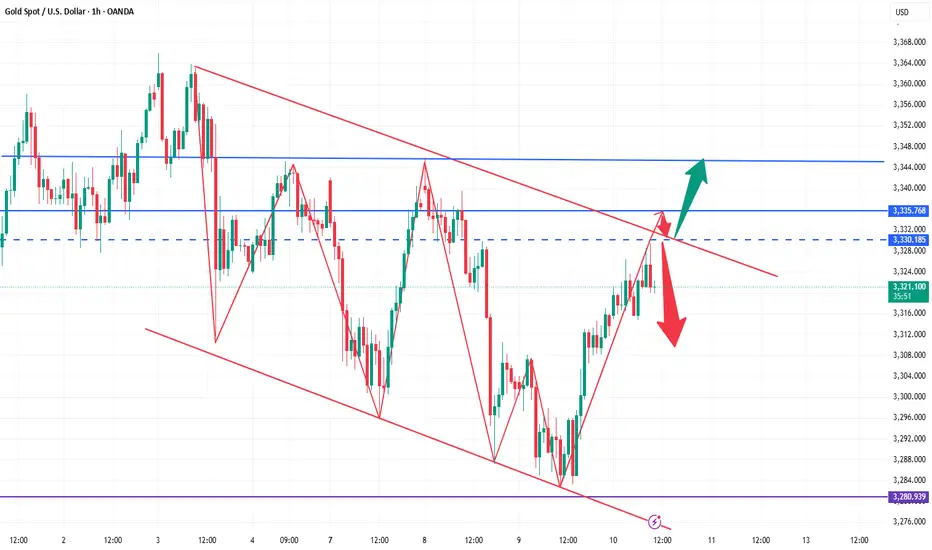
Looking at gold in 1 hour, after the price surged, it continued to fall under pressure at 3345. 3345 is also the recent key position for long and short positions. The 1-hour moving average of gold is still in a short position and continues to diverge downward. The short-term short momentum of gold still exists. I think the price will still fall after the rebound. Gold started to fall directly at 3330, and 3330 formed a strong resistance for gold in the short term. The downward low point did not continue after touching 3288. The current price rebounded and fluctuated around 3295. So we can sell high and buy low around 3385-3325.
After repeated tug-of-war, where will gold go?At present, the gold market is divided between long and short positions. The Federal Reserve may maintain high interest rates, which weakens the investment appeal of gold; however, trade frictions and geopolitical risks provide safe-haven support for gold. Overall, market sentiment is mixed, with bulls lacking confidence, but bears have not been able to fully control the situation. Last week's strong non-farm data reduced market expectations for a rate cut in July, pushing up U.S. bond yields and the dollar, putting pressure on gold, which does not generate interest. In addition, Trump said on social media that he would impose a 10% tariff on countries that "support anti-U.S. policies." The market is waiting for the release of the minutes of the Fed's June meeting, which will more clearly show policymakers' views on the current economic situation and future policies, and may determine the direction of interest rates. If the minutes show that the Fed is inclined to maintain high interest rates for a longer period of time, gold prices may continue to face downward pressure.
From a technical perspective, gold was under pressure at a high level at the opening, so gold is expected to fall today. Today's key pressure level is 3345. Before the price effectively breaks through and stabilizes at 3345, any rebound is a short-selling opportunity; once it stabilizes at 3345, the bottom pattern is confirmed to be established, and the bulls will start an upward market. At this time, the short-selling idea should be abandoned. From a technical point of view, the 1-hour chart has shown a trend from weak to strong, and the Bollinger Bands are opening and diverging upward, indicating that the market may accelerate upward. Today's operation suggestion is to focus on low-long and high-short as a supplement. In terms of specific points, the lower support is 3327-3320, and the upper resistance is 3355-3360.
Operation strategy:
1. It is recommended to buy gold when it rebounds to around 3327-3320, with the target at 3340-3350.
2. It is recommended to sell gold when it rebounds to around 3345-3355, with the target at 3330-3320.
XAU/USD 08 June 2025 Intraday AnalysisH4 Analysis:
-> Swing: Bullish.
-> Internal: Bullish.
You will note that price has targeted weak internal high on two separate occasions forming a double top which is a bearish reversal pattern. This is in-line with HTF bearish pullback phase.
Remainder of analysis and bias remains the same as analysis dated 23 April 2025.
Price has now printed a bearish CHoCH according to my analysis yesterday.
Price is now trading within an established internal range.
Intraday Expectation:
Price to trade down to either discount of internal 50% EQ, or H4 demand zone before targeting weak internal high priced at 3,500.200.
Note:
The Federal Reserve’s sustained dovish stance, coupled with ongoing geopolitical uncertainties, is likely to prolong heightened volatility in the gold market. Given this elevated risk environment, traders should exercise caution and recalibrate risk management strategies to navigate potential price fluctuations effectively.
Additionally, gold pricing remains sensitive to broader macroeconomic developments, including policy decisions under President Trump. Shifts in geopolitical strategy and economic directives could further amplify uncertainty, contributing to market repricing dynamics.
H4 Chart:
M15 Analysis:
-> Swing: Bullish.
-> Internal: Bullish.
H4 Timeframe - Price has failed to target weak internal high, therefore, it would not be unrealistic if price printed a bearish iBOS.
The remainder of my analysis shall remain the same as analysis dated 13 June 2025, apart from target price.
As per my analysis dated 22 May 2025 whereby I mentioned price can be seen to be reacting at discount of 50% EQ on H4 timeframe, therefore, it is a viable alternative that price could potentially print a bullish iBOS on M15 timeframe despite internal structure being bearish.
Price has printed a bullish iBOS followed by a bearish CHoCH, which indicates, but does not confirm, bearish pullback phase initiation. I will however continue to monitor, with respect to depth of pullback.
Intraday Expectation:
Price to continue bearish, react at either M15 supply zone, or discount of 50% internal EQ before targeting weak internal high priced at 3,451.375.
Note:
Gold remains highly volatile amid the Federal Reserve's continued dovish stance, persistent and escalating geopolitical uncertainties. Traders should implement robust risk management strategies and remain vigilant, as price swings may become more pronounced in this elevated volatility environment.
Additionally, President Trump’s recent tariff announcements are expected to further amplify market turbulence, potentially triggering sharp price fluctuations and whipsaws.
M15 Chart:
Gold fluctuates. Beware of highs.On Monday, the U.S. dollar index rose sharply, reaching an intraday high of 97.65 as Trump announced that he would impose new tariffs on a series of countries including Japan and South Korea on August 1.
Spot gold fell first and then rose. It once fell below the $3,300 mark during the session, but then rebounded strongly in a V-shaped manner by nearly $40. As of now, it has stabilized above 3,330.
From the current daily line:
3,320 is the absolute support position for gold at present. Although it fell below 3,320 yesterday, Monday, it then reversed and stabilized above 3,320. For now, the daily line still cannot close below 3,320. If it closes below 3,320, the decline may open further. On the contrary, the current upper suppression position of gold is around 3,350. That is to say, it is basically maintained at 3,320-50 for rectification.
If the daily line stabilizes at 3350 again, the bulls may rise again.
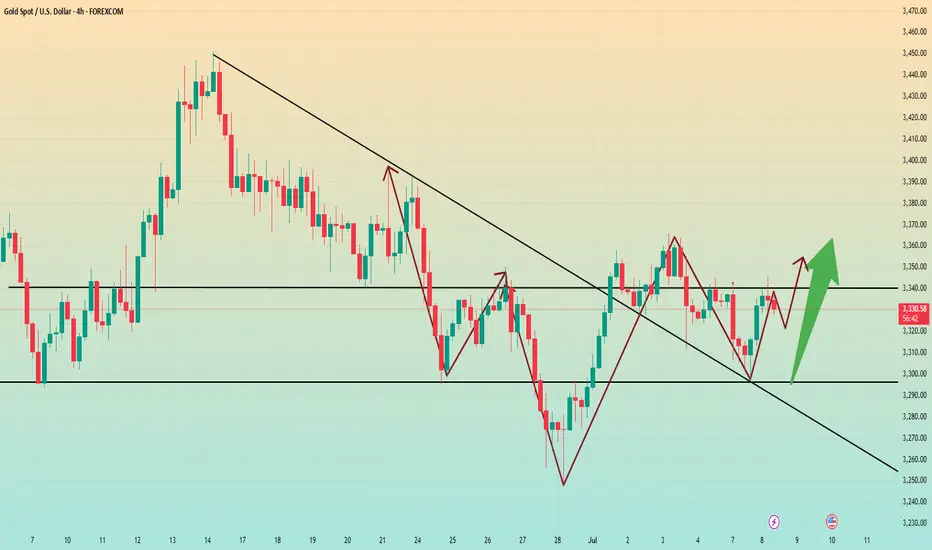
From the 4-hour chart, gold currently shows signs of a head and shoulders bottom. If the 4-hour chart stabilizes above 3340 again, the suppression level of 3350 may be directly broken. Next, it may directly touch the high level of 3380-90. Therefore, in terms of operation, I suggest that you can maintain long positions at 3320-30.
The first target is 3340-50. As long as the 4-hour chart stabilizes above 3340, you can continue to look at 3380-90.
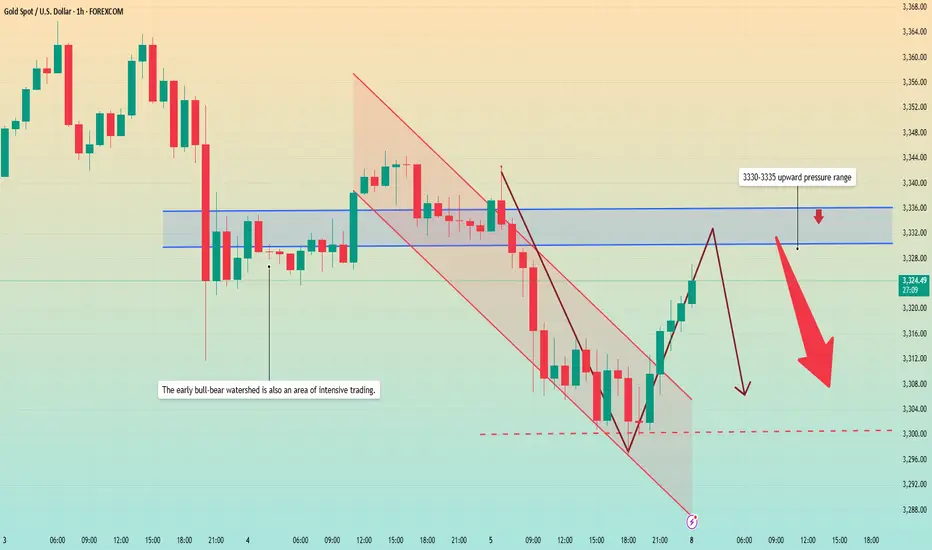
Seize the correction: It’s the right time to short goldThe current rebound is only a technical adjustment rather than a trend reversal. The rebound in the falling market is a good opportunity to arrange short orders. The hourly chart shows that the moving average pressure continues to move down to around 3340-3345. This position also serves as the long-short watershed in the previous intensive trading area, forming a key resistance barrier. If the gold price rebounds and approaches the area below 3345 and a stagflation signal appears or a top structure is formed, it can be regarded as a clear short signal. It is recommended to enter the market to seize the downward space. The current market direction is clear, and the exhaustion of the rebound is the best time to enter the market. Relying on the technical pressure level, the short position can be accurately arranged.
Gold fluctuates repeatedly, how to seize the opportunityIf the direction is right, you are not afraid of the long journey. Use time to witness your strength, use your strength to win the future, let trust become profit, and use profit to resolve doubts. The market is changing rapidly, and going with the trend is the kingly way. When the trend comes, just do it, don't go against the trend to buy at the bottom, so as not to suffer. Remember not to act on impulse when trading. The market is good for all kinds of dissatisfaction, so you must not hold orders. I believe many people have experienced this. The more you resist, the more panic you will feel, and the floating losses will continue to magnify, making you eat and sleep poorly, and you will miss many opportunities in vain. If you also have these troubles, then you might as well follow my pace and try to see if it can make you suddenly enlightened.
Gold is concerned about the short-term pressure of the 3316 line above, and focuses on the pressure of the 3325 line. If the pressure above the 3325 line is not broken, then the possibility of gold further breaking through the lower space to 3295-3300 in the short term will also increase significantly. Therefore, the main line of gold operation is still based on holding shorts and rebounding shorts. Gold can rebound to the 3316 line and 3325 line before considering participating in short shorts. In terms of operation, we first pay attention to the support of the 3295-3300 line. If the lower support is broken today, the market will reverse to the short side. Otherwise, we will continue to rebound from the bottom and look for opportunities to go long.
From the current trend of gold, pay attention to the support of the 3300-3295 line below, the short-term resistance above pays attention to the vicinity of 3316, and focus on the suppression of the line near 3325. The overall main tone of high-altitude low-multiple cycle participation remains unchanged. In the mid-line position, keep watching and do less, follow orders cautiously, keep the main tone of participating in the trend, and patiently wait for key points to participate.
Gold operation strategy:
1. Go long on gold around 3330-3295, target 3315-3320.
2. Go short on gold around 3315-3325, target 3305-3300.
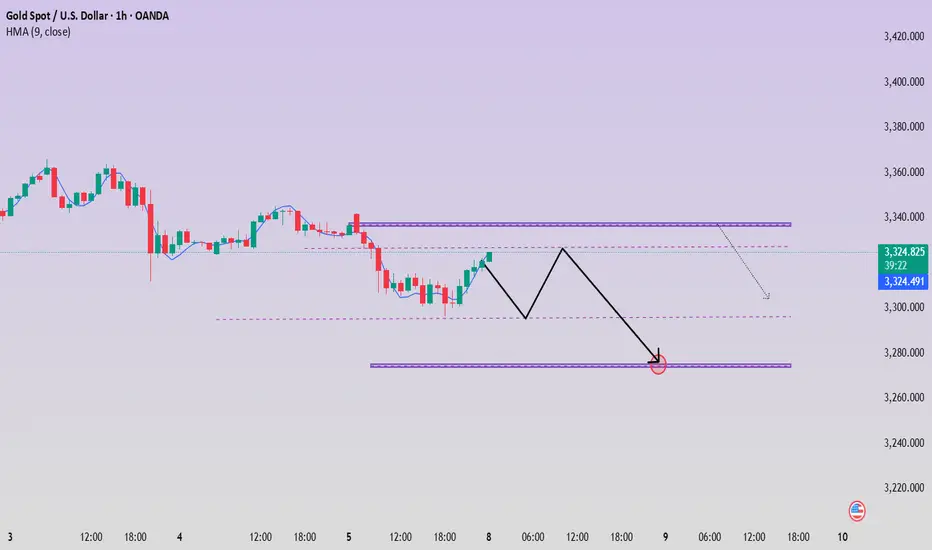
Gold rebounded from the bottom. Is the decline over?Gold prices faced selling pressure in today's Asian market. The price fell from 3343 to around 3320 in the early Asian session. The European price continued to fall, reaching a low of around 3296, and then rebounded upward. The current price is fluctuating around 3320.
Most investors will focus on the minutes of the Federal Open Market Committee (FOMC) meeting to be released on Wednesday to get guidance on the trend.
From the hourly chart, the upper pressure position is constantly being corrected. The current average pressure value is around 3330-3335. At the same time, this position is also the watershed between long and short positions in the previous dense area. The price may rebound to this position again. The lower support level is in the range of 3300-3290.
Quaid believes that the current market is still showing a downward trend, and the price may fall back below 3300 again.
Operation strategy:
Short around 3330, stop loss 3340, profit range 3310-3300, sustainable ownership after breakthrough.
Bearish pressure below 3,300 at the start of the week
📌 Driving Events
Gold prices (XAU/USD) faced renewed selling pressure in early Asian trading on Monday, falling to the $3,320 level. Gold's pullback came as stronger-than-expected U.S. nonfarm payrolls data for June reshaped market expectations for the Federal Reserve's (Fed) policy path. Investors are now turning their attention to the Federal Open Market Committee minutes, which will be released on Wednesday, for further guidance.
The U.S. added 147,000 jobs in June, better than expected and slightly higher than the revised 144,000 in May. Meanwhile, the unemployment rate remained stable at 4.1%. These data reinforce the view that the labor market remains resilient, reducing the likelihood of an imminent rate cut by the Federal Reserve. As a result, the U.S. dollar strengthened, weighing on non-yielding assets such as gold.
📊Comment Analysis
The decline at the beginning of the week, gold prices give up accumulation below 3300
💰Strategy Package
⭐️Set gold price:
🔥Sell gold area: 3337-3339 SL 3344
TP1: $3328
TP2: $3312
TP3: $3300
🔥Buy gold area: $3297-$3295 SL $3290
TP1: $3308
TP2: $3320
TP3: $3330
⭐️ Note: Labaron hopes that traders can properly manage their funds
- Choose the number of lots that matches your funds
- Profit is 4-7% of the fund account
- Stop loss is 1-3% of the fund account
Gold fluctuates downward. Do not short blindly.Today, gold is in a consolidation downward trend, with the lowest point reaching around 3296; it has rebounded slightly to around 3310. From the overall market, gold is indeed in a short trend. However, do not continue to short, which is very dangerous.
Because from the hourly chart, although the low point of gold is constantly refreshing, the key hourly chart support range position has not yet broken.
So, here I may think that gold may still be tempting to short in the short term. There is still a possibility of a pullback here on the hourly chart. From the current point of view, there is still a probability of a pullback to 3320-30 before the range is broken. In terms of the next operation, I suggest that you can pay attention to 3320-30.
However, if it really pulls up again, as long as it does not stand above 3330 again. Then, we can short here at 3320-30. On the contrary, if the rebound directly breaks above 3340, then be careful. The rebound may turn into a trend reversal, and it is very likely to replicate the rhythm at the beginning of last week.
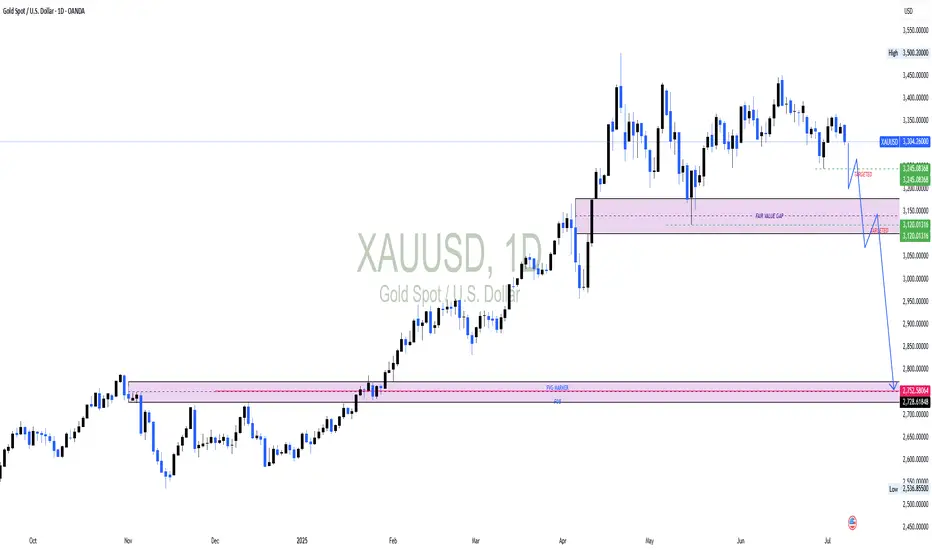
Could Gold slide below 3000?Could Gold slide below 3000?
On the monthly charts, price action shows an imbalance when Gold surged to 3500. Equilibrium must be restored and price action suggests, Gold has to correct by mitigating demand at 2700 price levels. On the weekly and daily charts, there are signs of price weakening suggesting a reversal is not so far. On the daily chart, Gold has mitigated a short term FVG and formed an intermediate low. Once this low is broken, it will confirm our reversal of Gold targeting the monthly FVG at 2760
Firmly bearish below 3350 once again verifies the perfect idea!Gold price rose rapidly at the opening, reaching a high of 3342 before falling back. This kind of rapid pull needs special attention, because from the perspective of short-term trading, this is the trend pattern that needs the most vigilance. Looking back at the trend last Thursday, there was also a situation where the high could not be continued. Historical data shows that this kind of pull-up often lacks sustained momentum, and the subsequent upward space is limited. Combined with the recent trend, although the price rebounded on Monday and Tuesday, it basically maintained a volatile pattern in the following trading days, but the fluctuation range changed. Therefore, the market expects the trend to be repeated in stages, and the information of long and short interweaving makes it difficult for the market trend to continue. Today, the short position digested the second time at the opening and currently stepped back to the lowest 3305 line. In terms of operation, we first pay attention to the situation of 3303-3293. If the support below is broken today, then the market will reverse to the short position. Otherwise, we will continue to rebound from the bottom and look for opportunities to do more.
From the current gold trend analysis, the support line of 3303-3293 is concerned below, the short-term resistance above is concerned about 3325-3330, and the suppression line of 3345-50 is focused on. The overall main tone of high-altitude low-multiple cycle participation remains unchanged. In the mid-line position, keep watching and do less, follow orders cautiously, and wait for the opportunity to enter the market after the key points are in place.
Gold operation strategy:
1. Go long near 3293-3303 for gold, and the target is 3315-3320.
2. Go short near 3320-3330 for gold, and the target is 3310-3300.