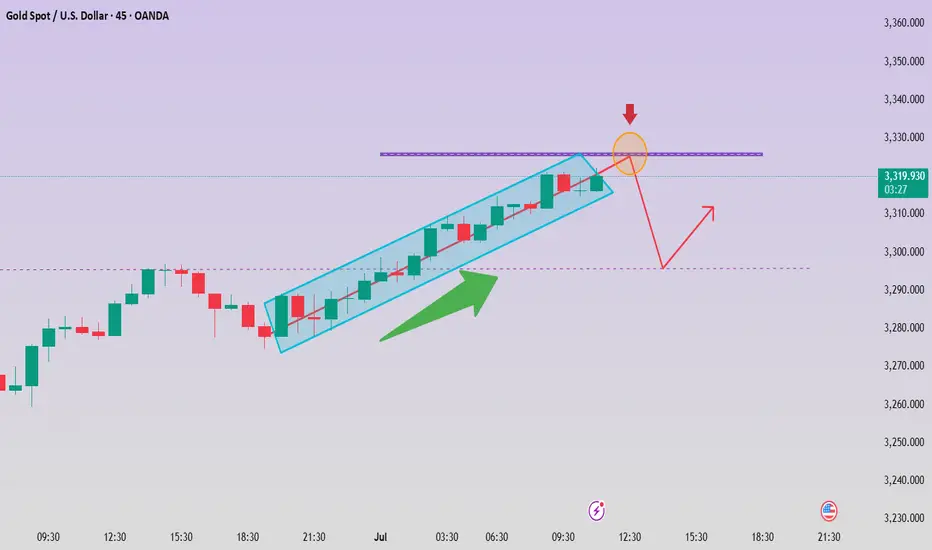
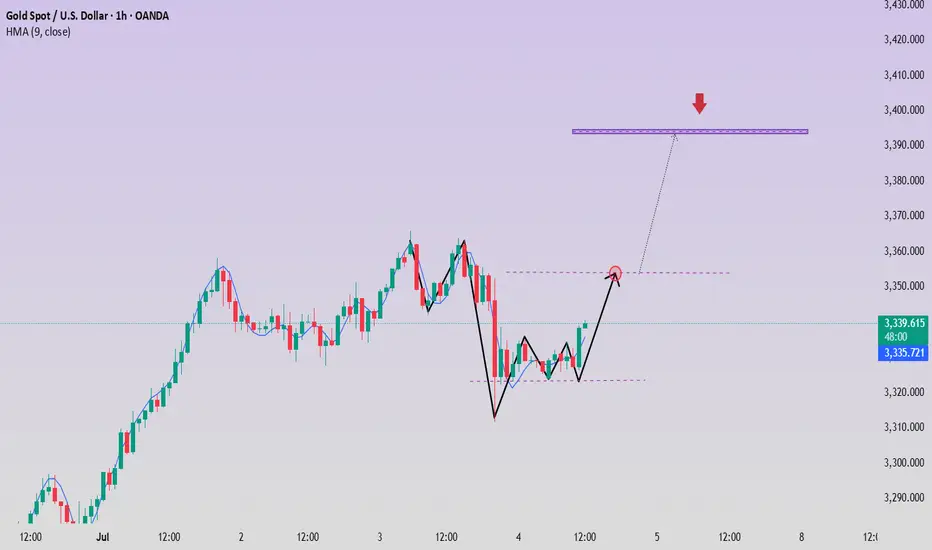
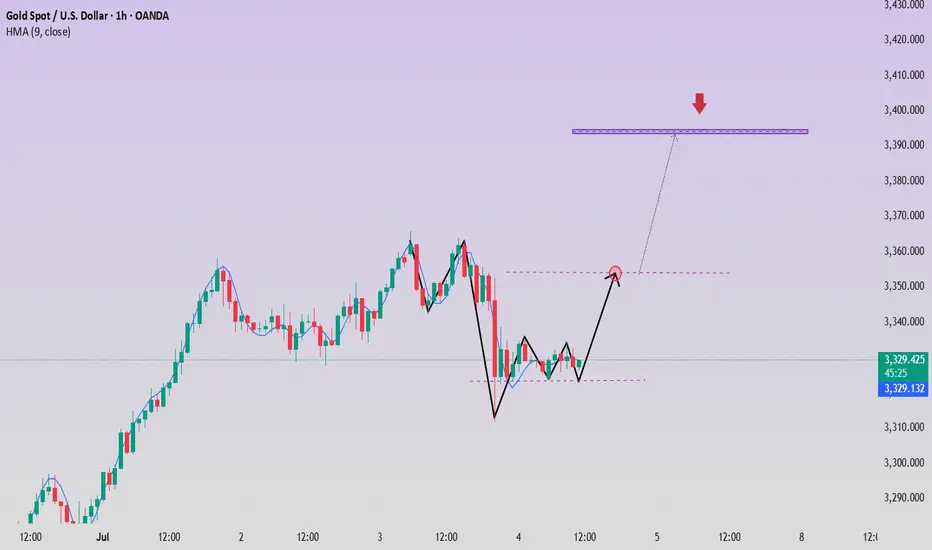
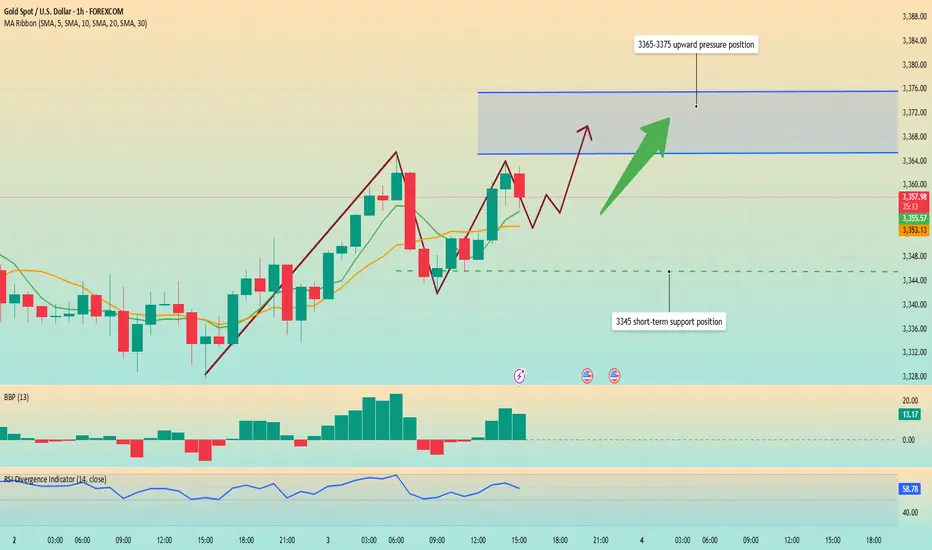
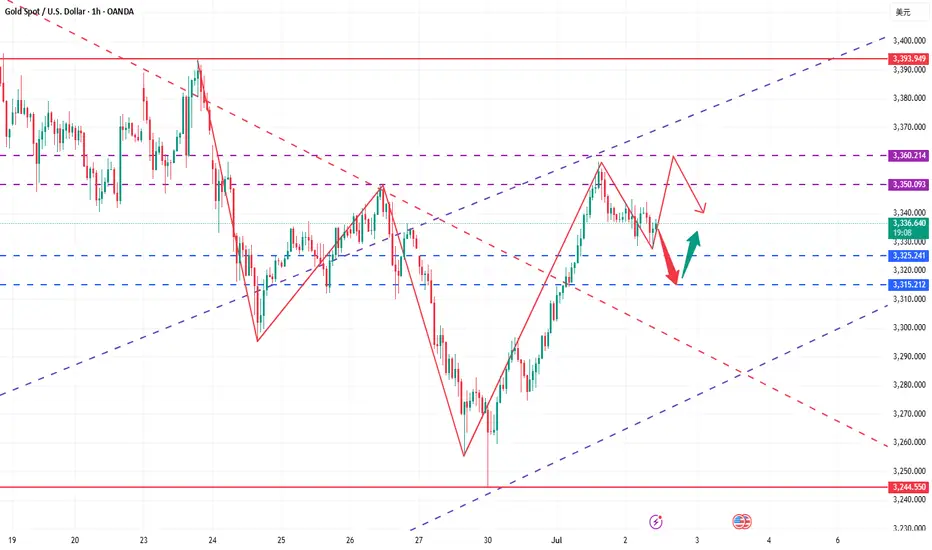
Gold continues to fluctuate. The direction is uncertain.Gold prices did not have a large continuation breakthrough on Friday due to the impact of the US Independence Day holiday; although the non-agricultural data on Thursday fell rapidly under the unfavorable conditions and formed a bottoming-out situation, the short-term bulls and bears were once again in a deadlock. After a small sideways movement on Friday morning, it rose again. Although it did not break through the upper pressure line of 3345, it still closed in the form of a positive line, which also gave the bulls hope to dominate next week.
At present, the upper key pressure is still maintained at the 3345 line, which is also the first point for the bulls to break through. Once the upper breakthrough is successful, the next target will be maintained at around 3365-3380. The support below is maintained at around 3325. If this position is broken down on Monday, the support of 3325 will not be maintained, and the bears will continue to open the downward channel.
But overall, the market direction is still unclear, and we can conduct trial transactions. Go long when the price falls back to 3325 on Monday in the Asian market, the profit range is 3340-3350, and the stop loss is 3315. If the European market continues to strengthen, you can still go long. If the European market continues to strengthen, we can still continue to go long. Otherwise, we still need to adjust our thinking in a timely manner.
Goldpriceaction
Gold fluctuates frequently, how to seize the opportunity?We started high-altitude layout from 3365. We took the lead in seizing this wave of decline opportunities and firmly held the bearish view. We harvested short orders all the way to 3325. The gold short orders were continuously stopped at profit, and the rhythm was very steady. The current market fluctuated repeatedly and the direction was chaotic, but we always insisted on executing the strategy - do it when you see it, and you can reap good rewards if you can hold it. Although there is support and resistance at the 3333 line in the short term, it is not recommended to chase more. The risk is relatively large. The key is to step back more. Wait for the 3325-3315 area to consider laying out long orders. We do not do dead shorts, nor do we blindly do more. We always maintain flexible response and rational judgment on the market.
From the current trend of gold, pay attention to the short-term support of 3325-3320 below, focus on the support position of 3315-3310, and pay attention to the short-term resistance around 3345-3350 above. The overall main tone of high-altitude low-multiple cycle participation remains unchanged. In the mid-line position, keep watching and do less, chase orders cautiously, and wait for the opportunity to enter the market after the key points are in place. For more specific operational details and strategy updates, please pay attention to the notification at the bottom 🌐 and pay attention in time.
Gold operation suggestions:
1. Go long near 3325-3315, target 3335-3345.
2. Go short near 3340-3350, target 3330-3320.
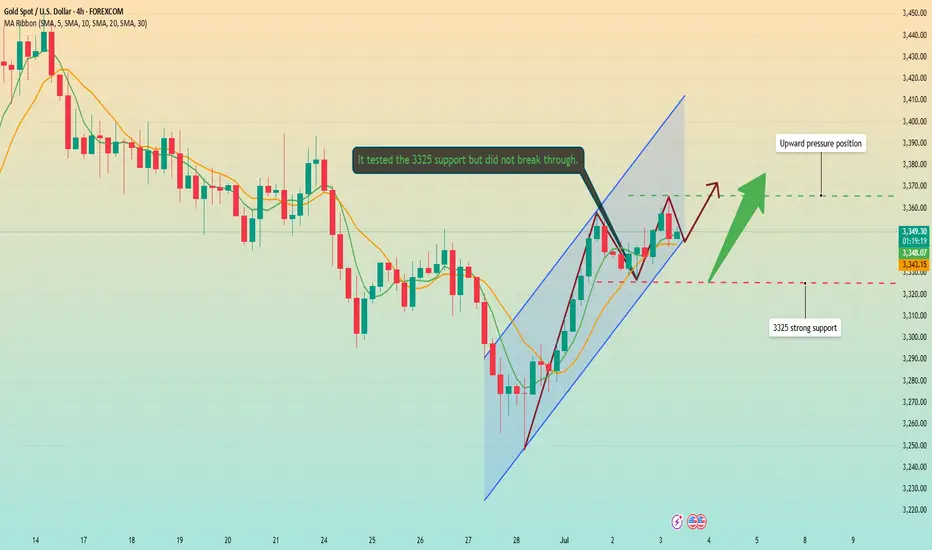
Maintain range fluctuations during the day?Gold has maintained a volatile pattern recently. As the US market is closed today for Independence Day, the market volatility is expected to be limited, but the volatile market will continue, but the volatility range may change. Yesterday's gold price fell mainly due to the news, and this decline usually does not last too long. From a technical point of view, gold prices are supported near 3310-3300, which is the key support level today. It is worth noting that on Wednesday, gold prices were under pressure in the 3340-3350 area, and on Thursday, prices formed support in this range, indicating that the area is forming a top-bottom conversion. Therefore, 3340-3350 has become an important pressure level today. It is expected to fluctuate in the 3300-3340/3350 range during the day. The impact of news on gold prices is usually short-term. When the fundamentals and technical directions are consistent, price fluctuations will be more obvious. When the two are inconsistent, price fluctuations will weaken, but will not change the technical trend. The rebound pattern established at the beginning of the week is still valid. After a short-term shock, gold prices are expected to re-stand above 3345 and continue to maintain the rebound trend.
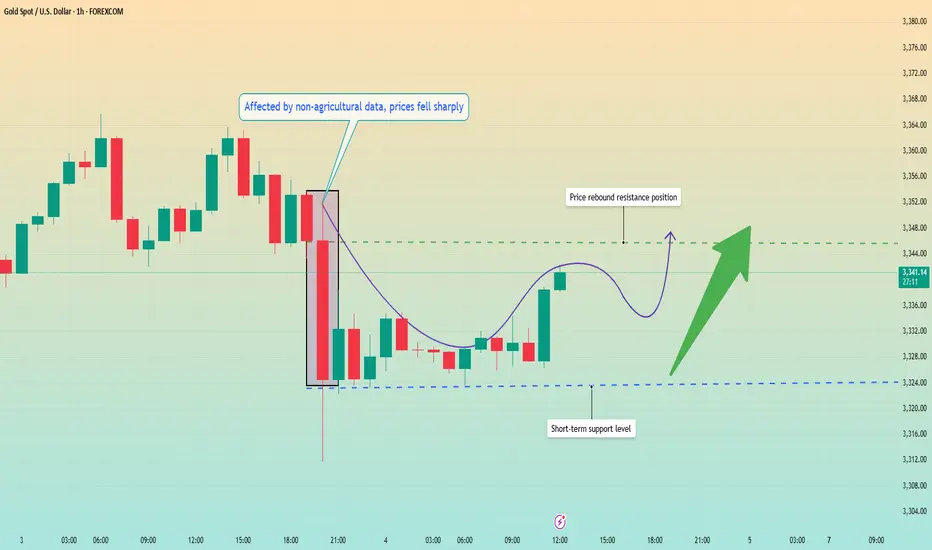
Non-farm data exceeded expectations. Will prices fall temporarilInformation summary:
Affected by the US Independence Day, the June non-farm data was released in advance. This non-farm data surprised the market, far below expectations and previous values, with a significant increase in employment exceeding expectations and previous values, and a sharp drop in unemployment to 4.1%.
The market bet that the July rate cut plan would be directly scrapped. After the employment data was released, the gold price quickly plummeted to $3,312, but the sharp drop in the market had poor continuity and ultimately did not form a unilateral decline.
Market analysis:
Due to the US Independence Day holiday, the US market was closed. In fact, the only thing left for us is the Asian and European markets. And today is the last trading day of this week, and the market is likely to maintain a state of consolidation.
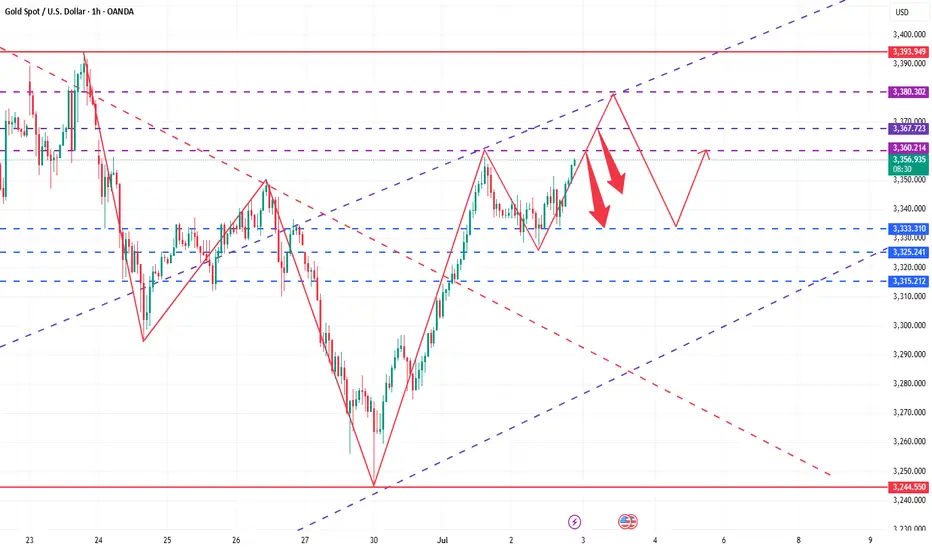
From the 1-hour chart, the price fell after testing the 3,360 high twice. The negative impact of the non-farm data accelerated the decline, and the decline did not continue, and a new support level was formed near 3,323 after the decline. At present, the price is impacting around 3,345, and the bulls are expected to rebound upward and return to the upward trend.
I think the current market continues to rebound, with the lower low of 3323 as the dividing point, and high sell and low buy operations in the consolidation area of 3320-3350.
This is the last trading day of this week. I wish all traders a perfect ending and a perfect weekend.
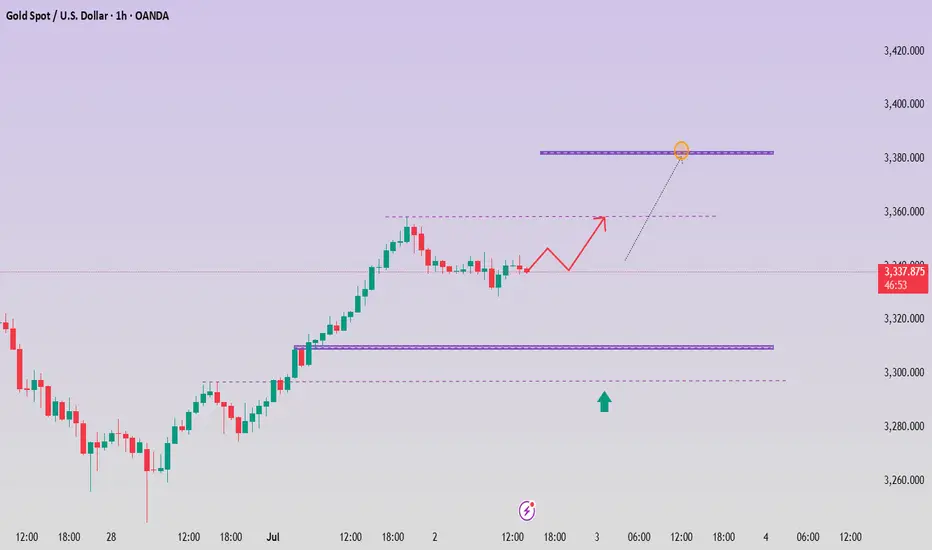
Gold accumulates and breaks through 3350 points
⭐️Personal comments:
Gold price rebounded around 3350. There was no important news and bank holidays in the US session on Friday, so it rebounded in the short term
⭐️Set gold price:
🔥Sell gold area: 3365-3367 SL 3372
TP1: $3355
TP2: $3342
TP3: $3330
🔥Buy gold area: $3311-$3313 SL $3306
TP1: $3325
TP2: $3338
TP3: $3350
Gold fluctuates during the day, short-term profits will be left
📌Main driving events of gold
The big non-agricultural data in the United States caused the gold price to fall by almost 40 US dollars in one breath, but after a short emotional storm, the market returned to calm. Today's market began to bottom out and rise. As of now, the non-agricultural market has been backed by 50%, and the energy of the shorts has been basically digested. Next, the bulls will start to exert their strength! Today's direction is still the same and continue to be bullish!
📊Comment analysis
In the US market, the gold price rebounded after the decline and the bottom of the second retracement appeared. The support level is 3322. After a night of fluctuations, gold has begun to rise, and the low point has begun to rise. The key point of the day is still 3323. In the morning, we wait for the gold price to fall back to around 3323 and we will buy the bottom and go long. We don’t expect to surpass yesterday’s high point during the day, but at least it will go to 3350!
💰Strategy Package
Long position:
Gold long at 3322-3327, stop loss 3315, target 3350-3360
⭐️ Note: Labaron hopes that traders can properly manage their funds
- Choose the number of lots that matches your funds
How to grasp the key entry opportunity in the gold market?The market is changing rapidly, and going with the trend is the kingly way. When the trend comes, just do it. Don't buy at the bottom against the trend, so as not to suffer. Remember not to act on impulse when trading. The market is good at dealing with all kinds of dissatisfaction, so you must not hold on to orders. I believe many people have experienced this deeply. The more you resist, the more panic you will feel, and your floating losses will continue to magnify. You will not be able to eat or sleep well, and you will miss many opportunities in vain. If you also have these troubles, then you might as well keep up with my pace and try to see if it can make you suddenly enlightened.
The non-agricultural data was unexpectedly cold, with a large negative impact. The stochastic indicator in the daily chart formed a golden cross, which was a main multi-signal. The BOLL range shrank, and the range shrank to 3418-3280. This range is the main range. The price pierced up and down the central axis and hovered, waiting for the news data to stimulate. The upper track of the 4-hour Bollinger band is at $3380, and the integer mark of $3400 is also near the high point of gold prices last week. The 5-day moving average and the MACD indicator cross upward, and the KDJ and RSI indicators cross upward. In the short-term technical aspect, gold has a trend of further rebound. At present, the upper resistance is at 3360-3365, and the support position is around 3310-3300.
Gold operation strategy: It is recommended to go long near 3312-3315, with a target of 3330-3340. It is recommended to go short once it touches 3340 for the first time, with a target of 3320-3310.
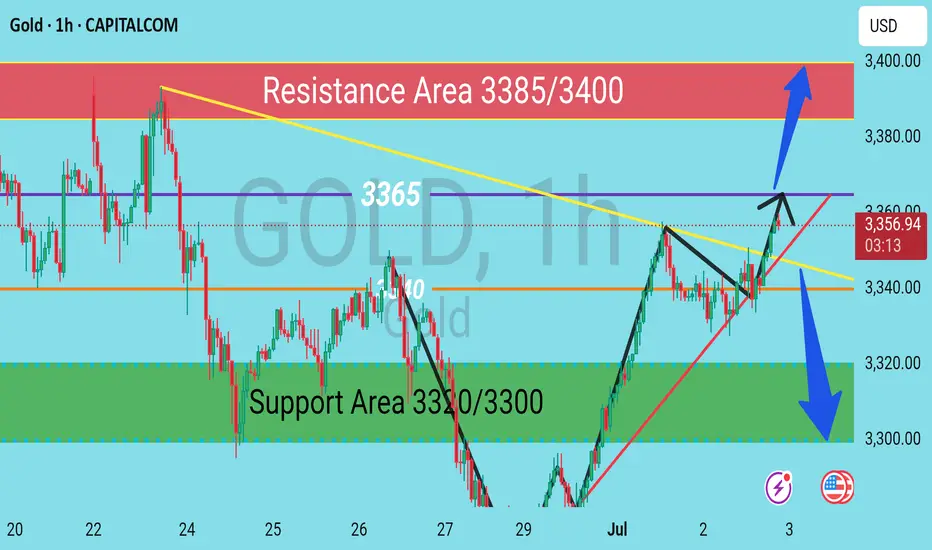
XAU/USD (GOLD) H1 Chart Outlook – Supply & Demand PerspectiveGold is currently consolidating in a tight range near the 3355–3358 zone, showing indecision ahead of a potential breakout. Based on supply and demand dynamics, here’s what to watch:
---
🔼 Bullish Scenario
If the H4 candle closes above 3365, this would confirm a bullish breakout above the immediate supply zone. In that case, expect upside momentum to target key resistance levels:
🎯 3385 – Minor resistance
🎯 3400 – Major resistance and potential reversal zone
A confirmed breakout with strong volume could open room for a short-term bullish rally.
---
🔽 Bearish Scenario
On the flip side, if the H4 candle closes below 3340, it would signal weakness and a possible rejection from the current range. This breakdown could shift the momentum to the downside, targeting the following support levels:
🛑 3320 – Near-term support
🛑 3300 – Critical demand zone
Failure to hold 3300 could indicate further bearish pressure in the coming sessions.
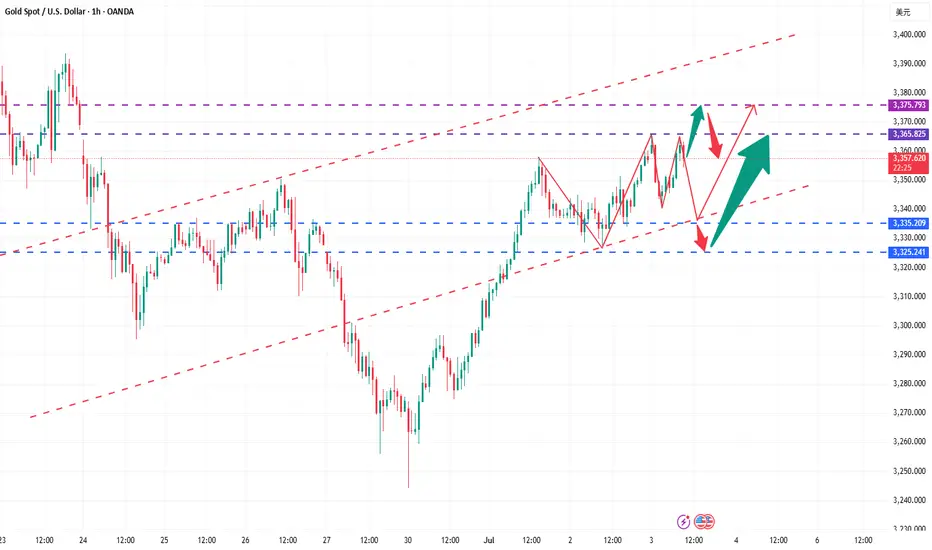
High-level fluctuations do not change the bullish trendThe 4-hour level shows that the gold price turned to high-level fluctuations after testing the upper track under pressure yesterday. There is still room for upward movement after the structure is completed. The 1-hour moving average system shows a golden cross divergent bullish arrangement, indicating that the short-term upward momentum is sufficient. The gold price continued to rise in the morning and hit a new high. The trend maintains a bull-dominated pattern. Although there was a correction in the US market yesterday, it stopped falling and stabilized at the key support level of 3330-3325 and broke through the previous high, further confirming the short-term strength. Therefore, once it pulls back to the upper area of 3335-3325, it will constitute a dip-buying opportunity. The intraday operation strategy recommends that the pullback be mainly long and the rebound short. The short-term support below focuses on the 3335-3325 range, and the upper short-term resistance level is 3365-3375.
Operation strategy: 1. Gold recommends long pullback near 3335-3325, with a target of 3350-3360.
2. It is recommended to short gold when it rebounds around 3365-3375, with the target at 3350-3340.
Gold grows, recovers near 3390
📣Gold News
Gold prices edged higher during the North American trading session as investors turned their attention to the upcoming U.S. non-farm payrolls report (NFP), which could influence the Fed's next policy move.
The latest labor data showed that companies are pausing hiring rather than laying off employees, reflecting caution in an uncertain economic environment. Meanwhile, Microsoft's decision to lay off 9,000 employees has heightened concerns about a weak labor market.
Traders are currently awaiting the official employment report from the U.S. Bureau of Labor Statistics on Thursday, which is expected to show 110,000 new jobs in June, down from 139,000 in May. The unemployment rate is expected to rise slightly to 4.3%, still within the 4.4% range of its forecast according to the Fed's latest summary of economic projections.
📣 Technical Analysis
NF is worth buying before the news release, holding. The dollar continues to be under selling pressure from investors worried about the Trump administration's erratic tariff policy.
💰Set Gold Price:
💰Sell Gold Zone: 3390-3398 SL 3405
TP1: 3380 USD
TP2: 3363 USD
TP3: 3350 USD
💰Buy Gold Zone: 3296-3294 USD SL 3289 USD
TP1: 3308 USD
TP2: 3318 USD
TP3: 3330 USD
⭐️Technical Analysis:
Set reasonable buy orders based on technical indicators EMA 34, EMA89 and support and resistance areas.
Gold remains strong, and we continue to buy on pullbacks!ADP employment unexpectedly turned negative, and the probability of a rate cut increased again
The ADP employment report released on the same day showed that the number of private sector jobs in the United States decreased by 33,000 in June, the first net loss since March 2023, and the May data was also significantly revised down to +29,000. After the release of the ADP data, the probability of the Federal Reserve's interest rate cut in July quickly rose from 20% before the data was released to about 27.4%. The market's bet on a rate cut before September has almost been fully factored in, and federal funds futures also show that the possibility of a 50 basis point rate cut has risen to 22%.
This "frown-making" data released a strong signal of cooling in the labor market before Thursday's non-farm report. If today's non-farm continues to be weaker than expected, it may force the Federal Reserve to act faster.
Gold opened high and then retreated continuously. From the daily chart, gold is still in an upward trend in the long term. The previous market rebounded effectively after touching the downward trend line, and the rebound force was considerable. With the restart of the bullish force, the main idea can carry the trend and do more on dips. In addition, from the 4-hour chart, gold has broken through the previous downward trend line and has gone out of the V-shaped reversal pattern, which means that the previous short-term downward trend has ended. At present, a new trend is also opening up in the 4-hour chart. The rise of gold has also established an upward trend line. You can consider buying on dips based on the upward trend line 3332. However, due to insufficient bottoming time in the previous stage, it may still face the risk of decline, so you should set the stop loss with caution. From the 1-hour chart, gold fell after opening high, and the bullish trend remains unchanged. The points for long orders can consider 3334 and 3328.
Gold operation suggestions: Go long on gold near 3325-3335, with a target of 3350-3360.
Data is about to be released. Trend change?Affected by the ADP employment data, gold prices broke through 3345 and continued to fluctuate upward to 3365 US dollars. This trend fully shows that the position of 3345 US dollars is the watershed between long and short.
From the 1-hour chart, the overall market is still fluctuating upward. Although it has fallen slightly, I think it is accumulating momentum for a second rise. ADP employment data is negative for the first time. Non-agricultural employment data will be released in 3 hours. The market expects 110,000 jobs. I think the data that may be released will be worse. The number of jobs will decrease and the unemployment rate will also increase, which will drive gold prices to continue to rise.
From a technical perspective, the RSI indicator is currently hovering around 58.7, showing strong upward momentum. MA5-day and 10-day moving averages form a golden cross and continue to rise. The current upward high has not appeared. The gold price may refresh the intraday high of 3365 again.
At present, the upward pressure focuses on 3365-3375 US dollars. The support level is around 3345, which is also the turning point for the upward movement of the MA5 daily moving average.
Operation strategy:
Buy near 3350, stop loss at 3340, and profit range 3370-3375.
Non-farm data is coming. Upward breakthrough?Information summary:
ADP data supports the rise of gold. Secondly, the weaker-than-expected non-farm data has triggered people's hope that the Federal Reserve will cut interest rates earlier. The gold price hit the 3360 mark, then fell back slightly, and is currently fluctuating around 3350.
This Friday is the Independence Day holiday in the United States. The non-farm data will be released on Thursday. Today, we will focus on this data, which will trigger a new trend.
Market analysis:
From the 4-hour chart, gold is currently in a suppressed state. However, it is not ruled out that it will be supported at the bottom as before, and then break through the upper suppression position again with the help of non-farm data.
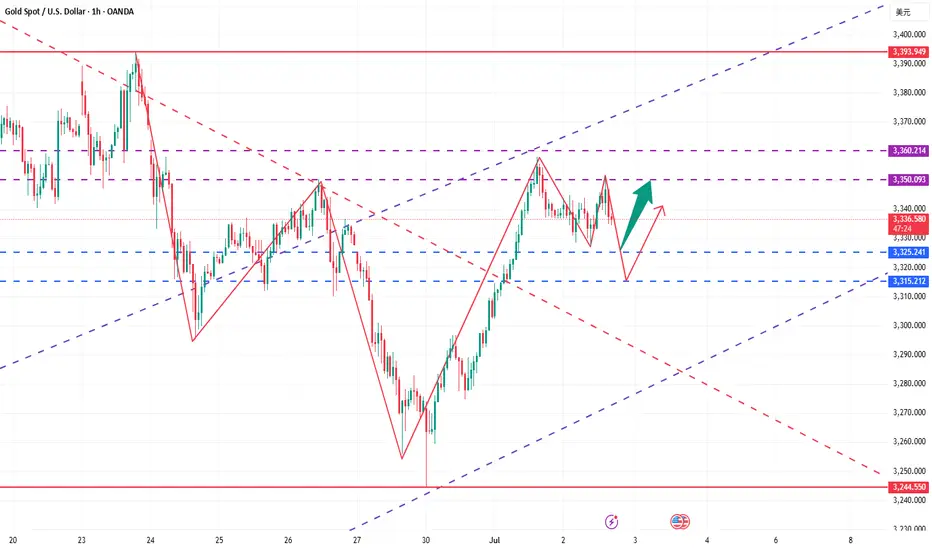
Therefore, the most critical position today is not above, but near the support of 3325 below. On Wednesday, the support near 3325 was tested many times but did not break down. If the price remains above this position today, the probability of an upward breakthrough is very high.
Based on the current market conditions and the data to be released soon, Quaid recommends that everyone wait and see for a while and wait for the new trend to come. Of course, according to the current forecast data, this will support the rise of gold. A radical approach can also try a long strategy around 3345.
Gold trend remains bullishThe investment market will not simply move in the expected direction. The road to success is tortuous. Once it goes in the opposite direction, it will lose direction and enter a cycle. The same is true for the market. The trend is certain, but it will never simply move in the predetermined direction. There will be twists and turns during the period that will shake people's hearts. At this time, you need a good attitude to face it and not be affected by the short-term trend. This is why we have been firmly laying out the bands in the early stage, and the reason for successful profits. Only by keeping the original intention can we succeed. The investment market requires concentration and perseverance, and then to reap profits!
At present, the overall rise of gold remains stable. Although the fluctuation has narrowed compared with yesterday, it has not fallen sharply after touching the previous pressure level, indicating that the support below is still effective. Although affected by the ADP data, the technical pattern still maintains a bullish idea. For prudent operations, it is recommended to maintain a low-long strategy and pay attention to the short-term support area near 3333-3328 below. After retreating to this position and stabilizing, you can continue to arrange long orders, and focus on the support area near 3325-3315. If the daily level stabilizes above this position, continue to maintain the bullish rhythm of retreating low and long and following the trend. The upward target looks at the 3355-3360 area. If this area continues to be blocked, consider light positions to arrange short orders, and the target is bearish adjustment. If the market breaks through strongly and stabilizes, it is expected to test the 3370-3380 area. The specific strategy adjustment will be prompted dynamically during the intraday according to the real-time market, and steadily follow the bullish trend to grasp the benefits.
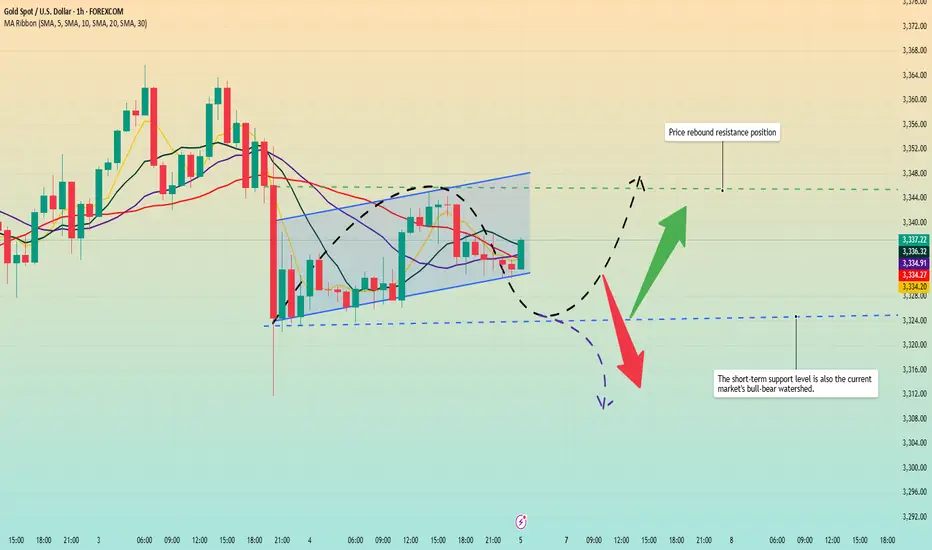
How to make accurate layout during gold volatility?Gold maintained a small range of fluctuations and consolidation rhythm today. In the morning, we arranged long orders at 3330-3331 and successfully exited at 3343. Affected by the ADP data, the gold price broke through 3345 and hit 3351. We also arranged short orders in the 3350-3351 area in time and are still holding positions. The focus of the support below is 3325-3315, which is the key position today. As long as this position is maintained, the long position will rebound and rise. Otherwise, it will fall into the battle for support at 3305-3295. In terms of operation, we continue to step back and do more.
From the current analysis of gold trend, the support below focuses on 3325-3315. The main bullish trend remains unchanged. Focus on the long-short watershed position of 3305-3295. The daily level stabilizes above this position and continues to step back and do more bullish rhythm.
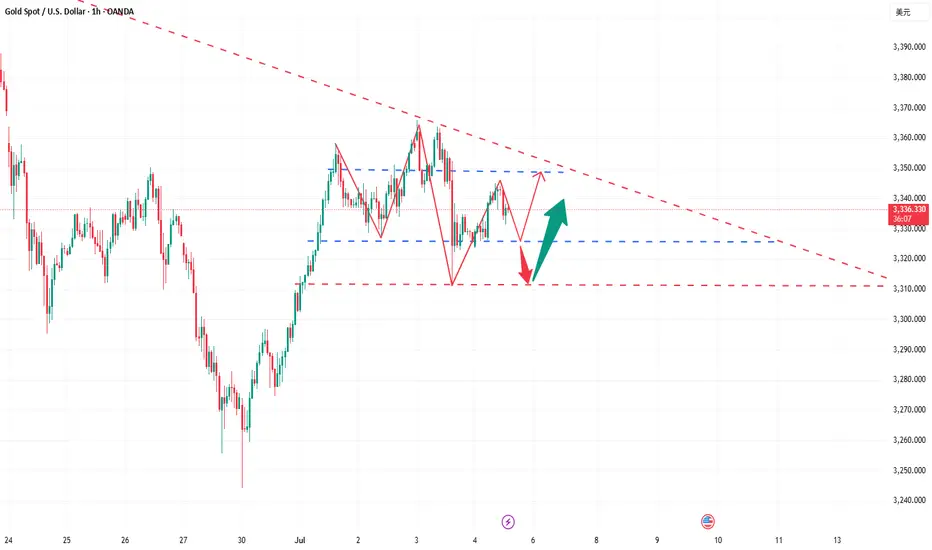
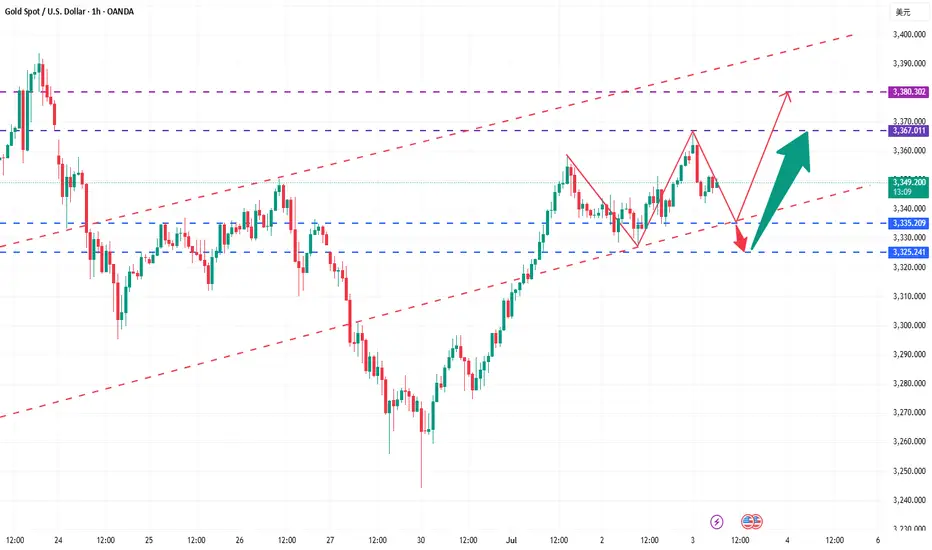
Critical moment! Where will gold go?After rebounding for two consecutive days, gold prices consolidated in a narrow range in the Asian market on Wednesday, hovering below a one-week high. Although the US dollar rebounded slightly and the market's improved risk appetite suppressed safe-haven demand, the Fed's interest rate cut expectations and trade uncertainties limited the downside of gold prices. The market is waiting for the upcoming ADP and non-farm data to determine the timing of the Fed's interest rate cut. The key technical resistance is $3,358.
Gold received a positive cross in June. At present, the monthly line has an upper shadow for three consecutive trading months, and the shadow is long, indicating that the upper selling pressure is relatively large; in this way, for the future market, we are more optimistic about the highs and falls. In the recent stage, gold is not interested in US data, but Trump frequently calls for the Fed to cut interest rates, which we still need to pay attention to. The sharp rise in gold in the past two days is not unrelated to the Fed's expectation of a rate cut. On the other hand, it is also related to the market rumor that the US President Trump's tariff deadline on July 9 is also related. If the US dollar index bottoms out and rebounds, ushering in a phased upward trend; then, it is bound to suppress gold.
Short-term resistance is yesterday's high point 3350-3360 area. If it breaks above, it is expected to hit 3375-80, and further 3400 mark; before breaking above 3400 area, there is still a large sweep range. If it goes up, the bulls will have a wave of acceleration, and the upper 3425 and 3450 may even hit the historical high. For the day, the 5-day moving average 3315 area will form a strong support after breaking through. If it rebounds and rushes higher, it cannot break below. Once it breaks below, the market will continue to fall, further 3300~3295, and then 3275 and 3255~45 areas; that is, the rise on Monday and Tuesday means the end of the bulls. Therefore, in terms of operation, the short-term relies on the 3315-3325 area to support low longs, and if it rises, it will continue to short with reference to the resistance area.
Gold prices have risen sharply. How should we trade gold?
📣Gold news:
US Senate passes Trump tax reform bill. Trump wins major victory
Trump's signature tax and spending cuts bill passed the Senate on Tuesday. Republican leaders finally convinced dissenting lawmakers after a hard fight, helping Trump win another political victory.
Trump refuses to extend July 9 tariff deadline
US President Trump reiterated on Tuesday that he has no intention of extending the 90-day suspension of reciprocal tariffs on most countries after it expires on July 9.
When asked whether he would extend the suspension of tariffs, Trump replied on Air Force One: "No, I haven't thought about it. I will write to many countries to notify them of the tariff rates they will face."
Gold (XAU/USD) struggled to extend its two-day rally, fluctuating narrowly in the Asian session on Wednesday, just below Tuesday's one-week high. The dollar's slight rebound - from its lowest level since February 2022 - put pressure on gold. Moreover, improving market sentiment continues to weaken demand for safe-haven assets such as gold, further limiting its upside.
⭐️Technical Analysis:
Trend lines are steadily picking up, and continued buying could move towards 3383 based on today's ADP-NF data
💰Set Gold Price:
💰Sell Gold Zone: 3375-3385 SL 3395
TP1: $3370
TP2: $3360
TP3: $3350
💰Buy Gold Zone: $3315-$3310 SL $3305
TP1: $3320
TP2: $3330
TP3: $3340
⭐️Technical Analysis:
Set reasonable buy orders based on technical indicators EMA 34, EMA89 and support resistance areas.
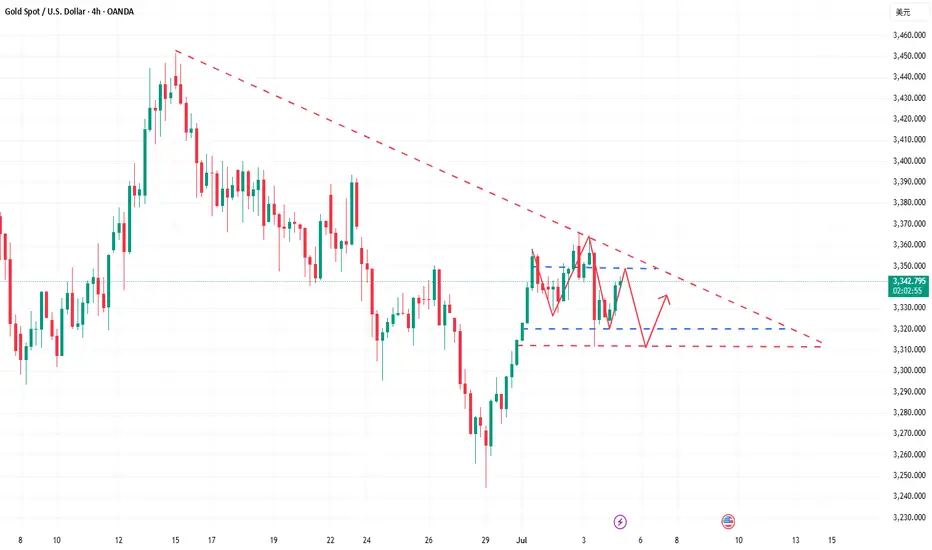
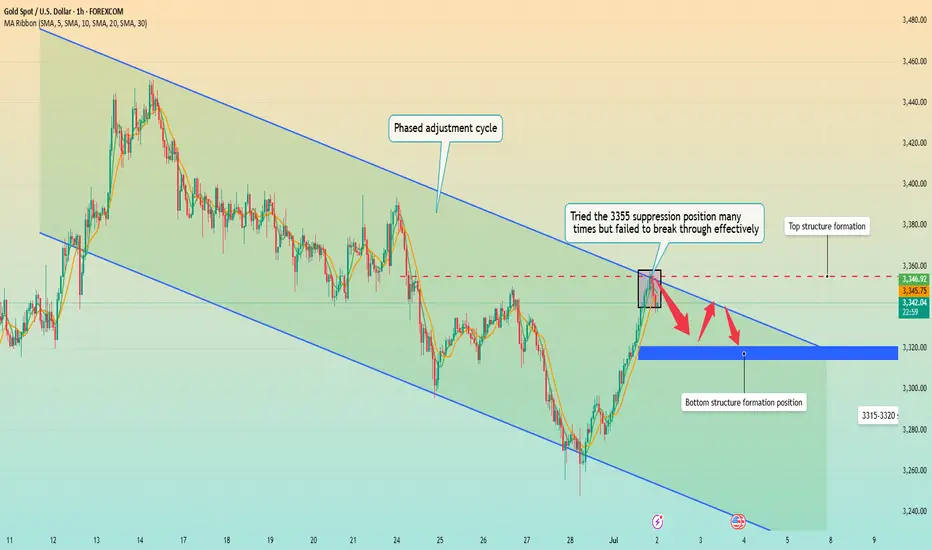
Gold falls back, is a bottom structure emerging?In terms of one-hour structure, this round of phased adjustment started from 3450 has not ended yet, but it will soon, especially the rapid rebound after the bottom of 3260 on Monday. This rebound has strong momentum. After bottoming out and rebounding, it is currently fluctuating around 3340, with a large overall span. This also shows that after the price has risen, the amplitude of the correction has increased, which means that the upward space is limited. This adjustment is likely to be over soon, but there is no definite bottom structure yet, so we need to wait for some time.
Before going out of the definite bottom structure, based on the principle of following the trend, you can try to short with a light position. At present, in terms of the one-hour pattern, the key point is here at 3355, and it is currently falling back from this position to 3340. If it falls back to the 3320 area today and stabilizes above it, you can operate a long strategy. On the whole, Quaid suggests that the short-term operation strategy for gold today should be mainly long on pullbacks, supplemented by shorting on rebounds.
Operation strategy:
Short at 3345, stop loss at 3355, profit range 3330-3325.
Long at 3320, stop loss at 3310, profit range 3340-3345.
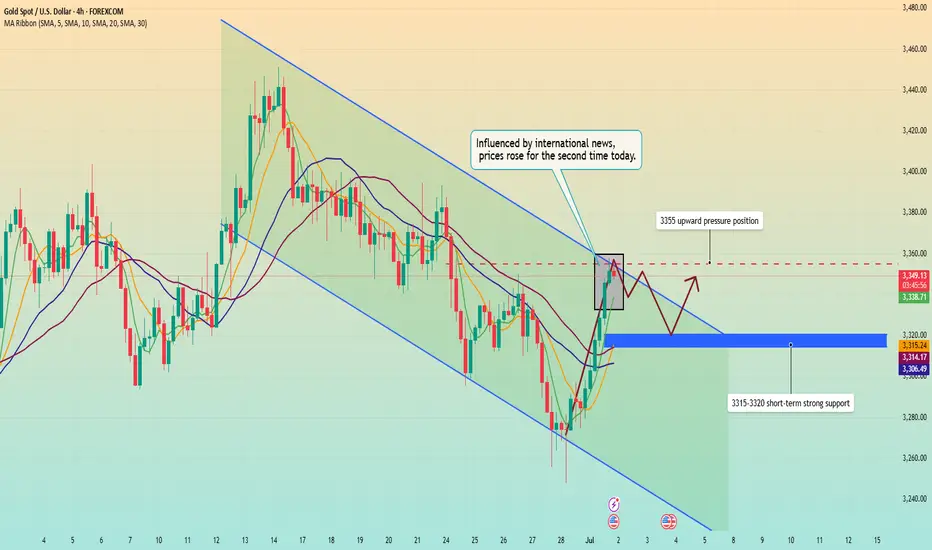
Gold surged and then fell. Has it reached its peak?Information summary:
Today, the United States and Japan negotiated on tariffs. Trump said that the US-Japan deal was unfair and might send a letter to Japan; the US-Japan trade negotiations seemed to be at a standstill. Trump also threatened that he would not extend the expiring tariff period and would send letters to most countries and regions in the next few days.
Secondly, the United States accused the EU of unfair digital legislation and asked the EU to relax its supervision of US technology giants. In addition, Trump accused "Mr. Too Late" Powell and the entire committee on social media that they should be ashamed of not cutting interest rates.
Affected by the above news, gold's risk aversion sentiment heated up and prices started to rise for the second time.
Market analysis:
From the 4-hour chart, the market is currently in a slow upward trend in a downward channel, and the price is also repeatedly testing the upward pressure position of 3355. MA5-day and 10-day moving averages turned upward and crossed with the 20-day and 30-day moving averages. At present, the upward momentum is slightly insufficient. In the short term, we should focus on the suppression position of 3355. If we fail to break through this position for a long time, the trend will most likely turn into a downward trend. If no black swan event occurs, today's price will most likely fluctuate around the 3320-3350 range. If there is no black swan event, the price today will most likely fluctuate around the range of 3320-3350.
Operation strategy:
Short near 3355, stop loss 3365, profit range 3340-3330.
Long near 3315 when the price falls back, stop loss 3305, profit range 3340-3345.
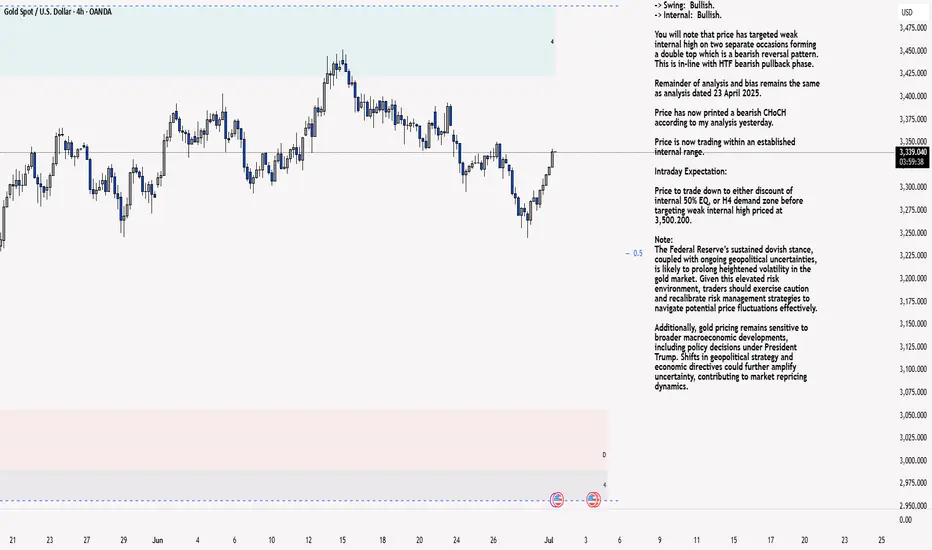
XAU/USD 01 July 2025 Intraday AnalysisH4 Analysis:
-> Swing: Bullish.
-> Internal: Bullish.
You will note that price has targeted weak internal high on two separate occasions forming a double top which is a bearish reversal pattern. This is in-line with HTF bearish pullback phase.
Remainder of analysis and bias remains the same as analysis dated 23 April 2025.
Price has now printed a bearish CHoCH according to my analysis yesterday.
Price is now trading within an established internal range.
Intraday Expectation:
Price to trade down to either discount of internal 50% EQ, or H4 demand zone before targeting weak internal high priced at 3,500.200.
Note:
The Federal Reserve’s sustained dovish stance, coupled with ongoing geopolitical uncertainties, is likely to prolong heightened volatility in the gold market. Given this elevated risk environment, traders should exercise caution and recalibrate risk management strategies to navigate potential price fluctuations effectively.
Additionally, gold pricing remains sensitive to broader macroeconomic developments, including policy decisions under President Trump. Shifts in geopolitical strategy and economic directives could further amplify uncertainty, contributing to market repricing dynamics.
H4 Chart:
M15 Analysis:
-> Swing: Bullish.
-> Internal: Bullish.
H4 Timeframe - Price has failed to target weak internal high, therefore, it would not be unrealistic if price printed a bearish iBOS.
The remainder of my analysis shall remain the same as analysis dated 13 June 2025, apart from target price.
As per my analysis dated 22 May 2025 whereby I mentioned price can be seen to be reacting at discount of 50% EQ on H4 timeframe, therefore, it is a viable alternative that price could potentially print a bullish iBOS on M15 timeframe despite internal structure being bearish.
Price has printed a bullish iBOS followed by a bearish CHoCH, which indicates, but does not confirm, bearish pullback phase initiation. I will however continue to monitor, with respect to depth of pullback.
Intraday Expectation:
Price to continue bearish, react at either M15 supply zone, or discount of 50% internal EQ before targeting weak internal high priced at 3,451.375.
Note:
Gold remains highly volatile amid the Federal Reserve's continued dovish stance, persistent and escalating geopolitical uncertainties. Traders should implement robust risk management strategies and remain vigilant, as price swings may become more pronounced in this elevated volatility environment.
Additionally, President Trump’s recent tariff announcements are expected to further amplify market turbulence, potentially triggering sharp price fluctuations and whipsaws.
M15 Chart:
7.1 London gold rebounds and rises, gold market trend analysis aGold rose to 3295 in the Asian session on Monday and was blocked. It fell in the European session as we expected, but the decline was not strong. After the lowest price of 3274.57, it rose again in the US session and stood firmly at the 3300 mark. The monthly line closed with a cross Yang K. The gold price continued to rise at the opening today. After the market on Monday, the 3247 below can be used as a reference for the bottom rebound position. Now the short-term trend belongs to the bulls, so we will continue this trend today and look at the upward trend first, wait for the European session to see the strength of the decline and then formulate the idea of the US session.
From the market point of view, after the gold price stood above the 3300 mark again, it is used as a short-term support level reference for the bulls. The Asian session can rely on this position to arrange long orders to see the continuation of the upward trend; the initial pressure on the upper side focuses on the 3328 position, followed by 3345. Now that the idea is established, the idea for intraday operations is: wait for the gold price to pull back to around 3308 in the Asian session and then go long and bullish, protect the 3300 mark, and target around 3328; if there is pressure at 3328 in the European session, you can arrange short positions with a downward trend, wait for the US session, and then decide whether to go long again based on the pullback position and target around 3345.

Gold is rising. Second starting point?Information summary:
1. The US dollar index has experienced the longest consecutive monthly decline since 2017. The weakening of the US dollar has increased the attractiveness of gold denominated in US dollars to non-US dollar holders, becoming an important support factor for gold prices.
2. Trump's continued pressure on the Federal Reserve to cut interest rates has formed a resonance effect with the weakening of the US dollar, which has jointly pushed up the short-term attractiveness of gold.
Multiple factors are intertwined, and gold has risen slightly again.
Market analysis:
Gold bottomed out and rebounded on Monday, showing a positive closing, and above 3300. After falling sideways for 5 consecutive trading days last week, although it fell for a short time on Monday, it did not continue. In this case, whether a new high can be reached, the watershed is the 3295 line. As long as the European session breaks the high, the long position is near the starting point of 3305 in the early trading session.
At present, the main focus is on the upper resistance around 3325. It opened directly upward on Tuesday, but did not break through too much space, unless it directly broke through 3325-3330; then the next resistance is around 3340. At present, the bulls are still running at a high level. The upward trend line generated after the reversal is more obvious, and the trend line has good effectiveness.
Since the current market is in the first wave of rise, the high point has not been confirmed. Quaid believes that when the high point is clear and the price falls back to the support area, consider entering the market to go long based on the support level. Of course, aggressive trading can choose to buy around 3320 and choose a suitable high point to take profit.
Operation strategy:
Short near the rebound 3340, stop loss 3350, profit range 3310-3300
Long near the fall 3305, stop loss 3290, profit range 3320-3335
This is the reason why gold suddenly "changed its face"!
📣 Gold News
Spot gold closed up $28.59, or 0.87%, at $3,302.71 per ounce on Monday. Gold prices fell to around $3,246 per ounce in early Asian trading, the lowest level since May 29.
At 21:30 Beijing time on Tuesday, Federal Reserve Chairman Powell, European Central Bank President Lagarde, Bank of England Governor Bailey, Bank of Japan Governor Kazuo Ueda, and Bank of Korea Governor Lee Chang-yong will hold a group meeting.
Last Tuesday and Wednesday, Federal Reserve Chairman Powell attended a congressional hearing and said that the Fed needs more time to observe whether tariffs make inflation rise higher before considering cutting interest rates.
Powell said in his congressional testimony that he and most Fed officials expect inflation to start to pick up soon, and the Fed is not in a hurry to cut interest rates before that.
Powell said: "At present, we have good conditions to wait and further understand the possible development path of the economy before considering whether to adjust the policy stance." Yesterday, gold opened at $3381.6 and quickly fell back, reaching a low of $3248.8, then rebounded, rebounded in the early trading and touched $3270 and fell again, gold fell back, reaching a low of $3259.4, then gold did not continue to fall, and rebounded. Gold continued to rebound in the European and American markets, with the highest rebound in the US market reaching $3309.4, and finally closed at $3002.9 in the late trading. The monthly line closed with a long upper shadow line and a shooting star pattern. After such a pattern ended, today's gold rebounded high, and the upper resistance focused on the $3326 line. The rebound relied on the resistance below here to short, and the lower side looked at the $3295 line.