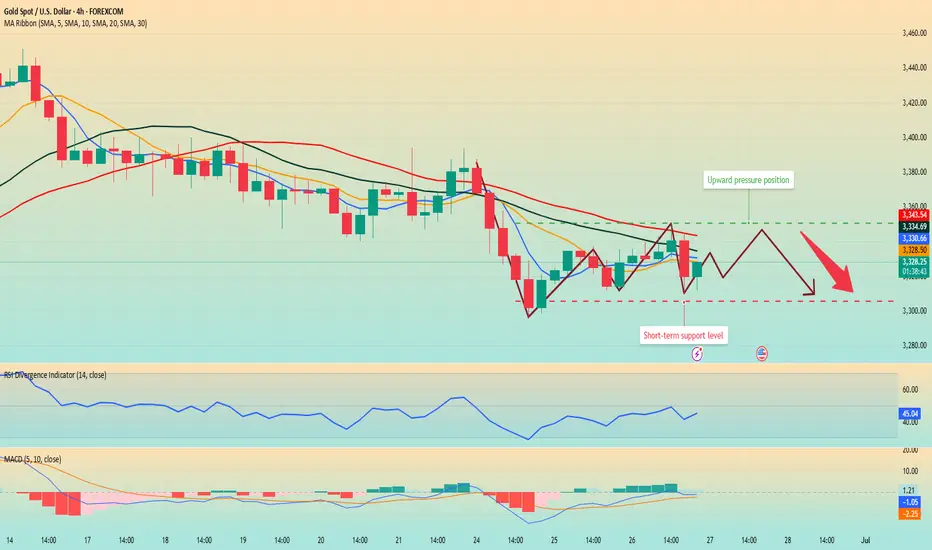
Gold fluctuated and fell, and the rebound was directly short
📣Gold News
Due to the easing of the situation in the Middle East, gold has fallen in the past few days, and the market has been eagerly looking forward to the interest rate cut, because the tariffs in the Trump era may push up inflation, but it has not come yet. "
On Thursday, the U.S. Department of Labor and Commerce issued key economic data, including initial jobless claims and the final value of real GDP in the first quarter. The number of initial jobless claims was 236,000, a decrease of 9,000 from 245,000 in the previous week, better than the market expectation of 245,000. At the same time, as of June 14, the number of continued unemployment claims in the week increased by 37,000 to 1.974 million, a new high since November 2021. Gold stopped below the moving average today. Gold did not continue the small positive line rise, and the decline continued during the U.S. trading period.
Today, focus on the continuation of short positions, comprehensive Labaron believes that gold is bearish today. For today's operation, consider rebound shorting as the main, and low long as the auxiliary.
📣 Pay attention to the resistance of 3330-3345 US dollars above
📣 Pay attention to the support of 3300-3280 US dollars below
💰 Go long near 3295-3285, target 3310-3320
💰 Go short near 3330-3340, target 3000-3290
If you have just entered the market, you are confused about the market of gold, oil and silver, and you always do the opposite operation direction and the entry price is unstable. I hope Labaron's article will help you.
Goldpriceaction
Gold breaks down. It may reach a low point.From the current market daily chart
The absolute support of gold is around 3280. Gold is basically in the process of maintaining this daily trend support line. Therefore, I personally think that around 3280 is a long-short dividing line for gold. If gold falls below 3280 on the daily line, it is very likely that the decline will just begin. On the contrary, be careful. If 3280 does not fall below, there is still a possibility of rebounding.
In the 4-hour chart, from the high point of 3450 to now, the 0.382 position is just around yesterday's high point of 3350. The 0.618 position is at 3325, and the final 100% position is around 3280. 3280 also coincides with the daily chart.
Therefore, gold must at least test around 3280 today, and it is not ruled out that there will be lower positions.
6.27 Risk aversion dissipates and gold prices adjust! The range As the Middle East war came to an end, the risk aversion sentiment in the global financial market subsided, the risk aversion funds dissipated, and the three major bullish markets of gold, crude oil, and silver all fell downward; at the same time, the US dollar index broke a new low !
Fundamentals:
1: The Middle East war has been temporarily paused, and both sides have entered the adjustment phase; however, irreconcilable contradictions may become the starting point of the next war at any time; although it has ended for now, we must not slack off. Once the two sides are on the verge of a war again, risk aversion will sweep the world again; this is not impossible;
This Middle East war came suddenly and ended suddenly; it was like a child's play washing the global financial market; therefore, the possibility of a resumption of war cannot be ruled out in the future;
At present, in the overall market:
1: In the short cycle, the gold price fluctuates downward, so in the short term, the short-term decline is seen, and the fluctuation is downward;
2: In terms of trend, the range is temporarily contracted, the BOLL of the daily K is contracted, the speed slows down, and the overall range is back to the range of fluctuations; there is no obvious long and short trend, and it returns to the range of fluctuations;
Today's technical trend chart:
1: In 4 hours, the stochastic indicator crosses downward, which is a main empty signal; in terms of form, it is temporarily under pressure from the central axis track of the 4-hour BOLL, and the empty trend continues downward, and the form tends to continue to oscillate downward; therefore, it is recommended to choose the high-altitude approach for 4 hours;
2: In the daily K, the stochastic indicator continues to cross downward, which is a empty signal; in terms of form, it is temporarily a broken Yin and Yang pattern, with no obvious trend; BOLL forms a contraction, the range of 3417-3277, the range is mainly in an oscillating trend, and the strong and weak dividing point is near 3347;
Comprehensive: The daily K is mainly in an oscillating trend, so it is recommended to deal with it according to the oscillating trend, choose to buy low and sell high; the reference pressure position is near 3347, the support position is near 3295 and 3278; the second pressure position is 3390-3400 pressure position; continue to choose the oscillating approach, and play a oscillating treatment of buying low and selling high;

XAUUSD/GOLDThe bullish trend has opened. After the retracement is confirmed, continue to buy and wait for the market to rise and fill the gap.
Gold is sideways. Is a new trend brewing?Information summary:
On June 23, Trump announced that Iran and Israel reached a comprehensive ceasefire, but the asymmetric terms of the agreement caused the conflict to continue. Israel launched another air strike on Iran, and Israel threatened to kill Iranian senior officials. The uncertainty of geopolitical risks continues to support gold prices.
Market analysis:
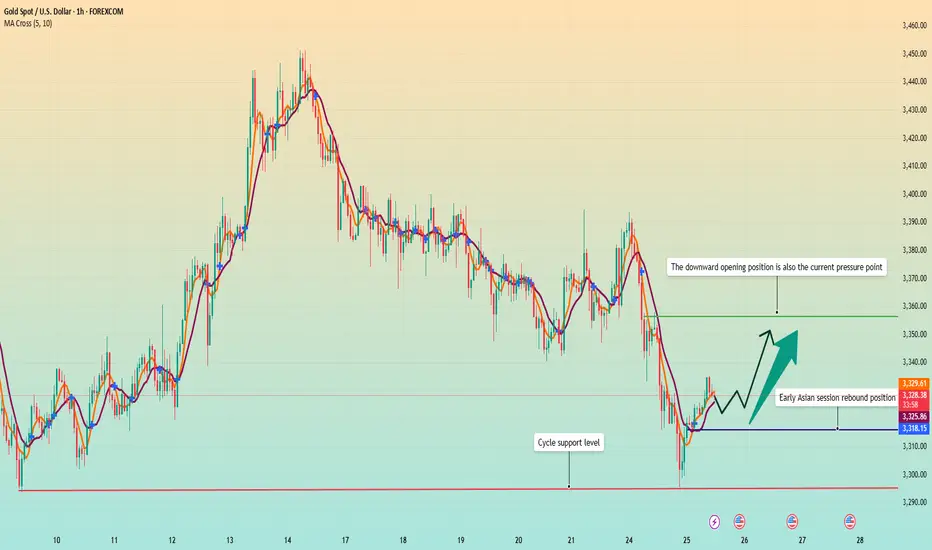
From the 4-hour chart, the MA5-day and 10-day moving averages show signs of upward divergence, and the K-line stands firm on the moving average support and fluctuates upward. In the short term, pay attention to the breakthrough and decline of the 3350 pressure level. The current market's downward momentum has weakened, and the overall market remains volatile. We need to be wary of the risk of short-term adjustments after continuous surges. Be alert to the short-term adjustment risks after continuous highs.
Operation strategy:
Short near the price rebound of 3345, stop loss 3355, profit range: 3330-3320.
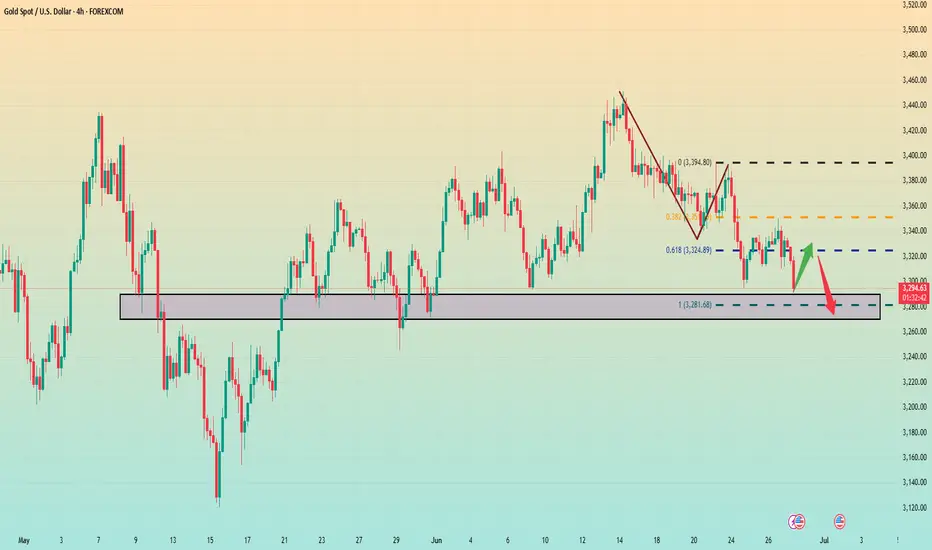
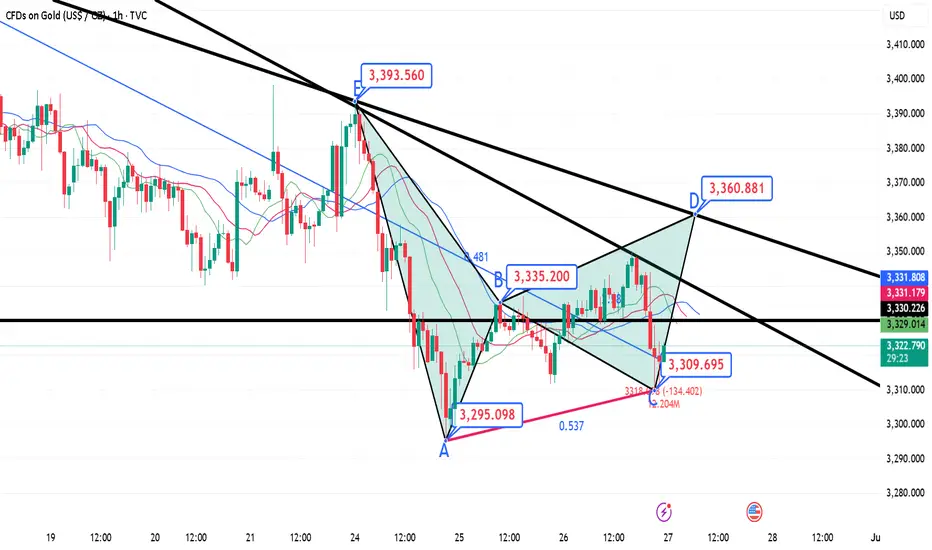
6.26 Gold intraday analysis and forecast—During the European session on Thursday (June 26), spot gold prices fluctuated significantly during the day, first falling and then rebounding, and are currently around 3337.60, fluctuating in a wide range.
The rebound from Tuesday's low of $3295 has risen above the previous support of $3340 (June 20 low), confirming a deeper bullish correction. The currency pair may be in the C-D leg of a small Gartley pattern, moving towards the downward trend line resistance since the mid-June high (previously $3450, currently $3365).
A break above this level will mark a trend reversal and shift the focus to the $3400 line, which suppressed bulls on June 17, 18 and 22.
On the downside, if the above trend line is blocked, it may first seek support at the intraday low of $3330 before looking at the previously mentioned $3295 (June 9 and 24 lows).
Can we still go long if the decline of gold intensifies?
📊Comment Analysis
Looking back at today's trend, it rose to a high of 3350, and then continued to retreat. The current low is 3310. At present, due to the upward trend line broken by the hourly line, many orders can only be short. The trend is still biased to the short side, and the current market risk aversion does not facilitate the longs. But first of all, one thing can be confirmed that this round of gold decline lasted for a long time, which also enhanced the execution of gold to go long near 3310-3320 in the future.
Since gold has fluctuated greatly in the past two days, it means that the end point of emotions will not disappear so easily for the time being. In the short-term K-line pattern, continuous short-side artillery should not be constantly changed and increased. It is necessary to stop and see appropriately. The early trading is relatively difficult to grasp, but at least the current market has given some signals, so I hope that when the market is in place, your execution will be strong enough, and then you can look at gold according to the trading signals I gave. The rehearsal is definitely exciting enough, but the actual operation is not that simple!
💰Strategy Package
Gold: Pay attention to the low-long opportunities of 3310-3220 in the US market, and defend at the 3300 line. If the retracement continues, go long directly. Otherwise, the upper resistance will be around 3345!
⭐️ Note: Labaron hopes that traders can properly manage their funds
- Choose the number of lots that matches your funds
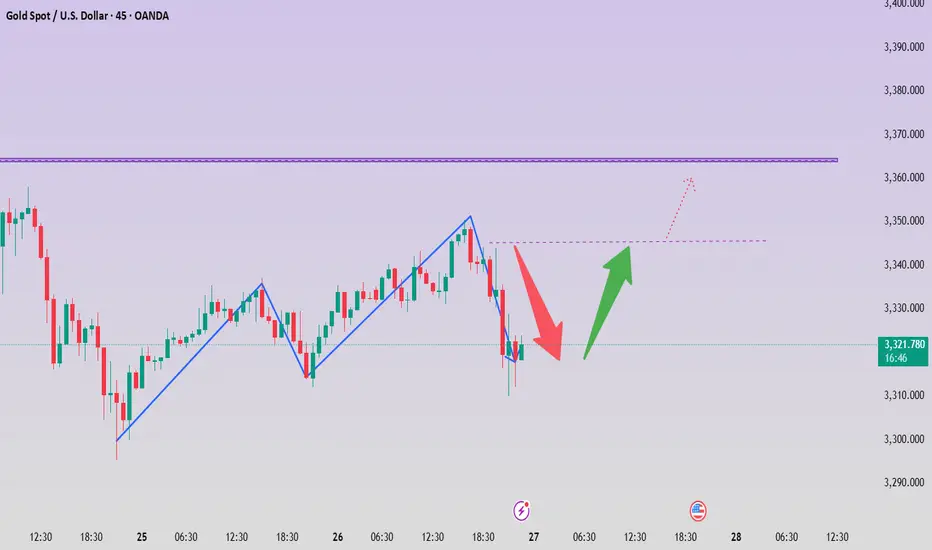
Gold volatility intensifies. Waiting for direction?The price of gold fluctuated greatly this week, which means that the end point of sentiment will not disappear so easily for the time being; in the short-term K-line pattern, there are continuous ups and downs. If you want to trade steadily, you can wait and see for a while.
From the hourly chart, the MA5-day and 10-day moving averages cross downward, and the RS indicator hovers around 40.7. This shows that the market trend is weak. The current price has bottomed out near 3310 and rebounded to fluctuate around 3320. The price may continue to decline after a slight rebound.
Today, focus on the long opportunities near 3305 and the pressure position above 3345.
Quaid has always believed that only by insisting on detailed analysis of the market and reducing losses, can we slowly accumulate the principal of the account.
Good luck to everyone.
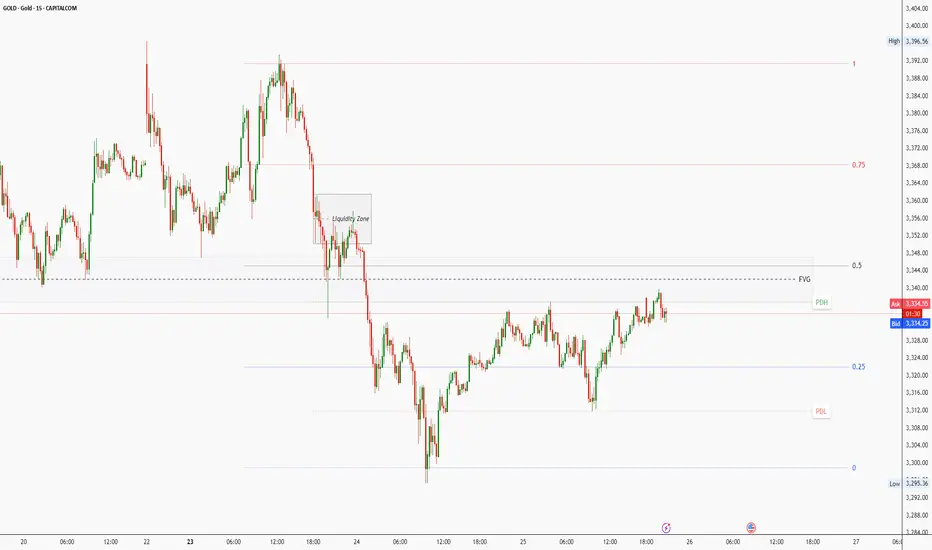
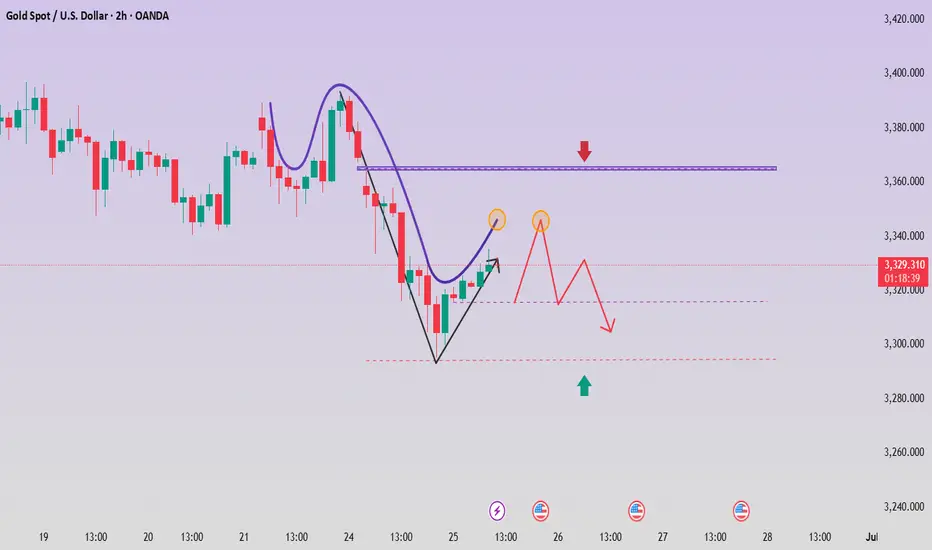
XAUUSD Outlook: Watching FVG Reaction for Bearish EntryThe previous day’s up-close candle didn’t reflect strong bullish conviction. Although price opened higher than the previous candle’s close, it closed only slightly above — completing the three-candle formation required to establish a Fair Value Gap (FVG).
As expected, buy-side liquidity above the previous day’s high has been raided. Price is now pushing towards the consequent encroachment of the FVG. How the market reacts at this level will be key in determining the next directional move.
While I maintain a bearish bias, I expect the market to trade higher into a bearish order block, providing a potential opportunity to enter short. If price does not react from the current FVG, it could continue higher to sweep liquidity resting above the swing high at 2357.82, which sits just below another unfilled FVG.
Entry Strategy
I will look to enter short only after a clear displacement, signalling a change in state of delivery, either:
Off the reaction from the current FVG, or
From a deeper liquidity zone
If no such confirmation presents itself, I will remain on the sidelines and wait for a more favourable setup.
Thanks for your support!
If you found this idea helpful or insightful, please drop a like 👍 and leave a comment — I’d love to hear your thoughts! 🚀
Follow me for more daily price action insights and trading strategies on XAUUSD and other key markets.
Let’s grow and trade smarter together! 📈
Disclaimer:
This content is for educational and informational purposes only and does not constitute financial or investment advice. All trading involves risk. You are solely responsible for your own decisions, so always conduct proper research and due diligence before taking any trades.
Past performance is not indicative of future results. Trade responsibly.
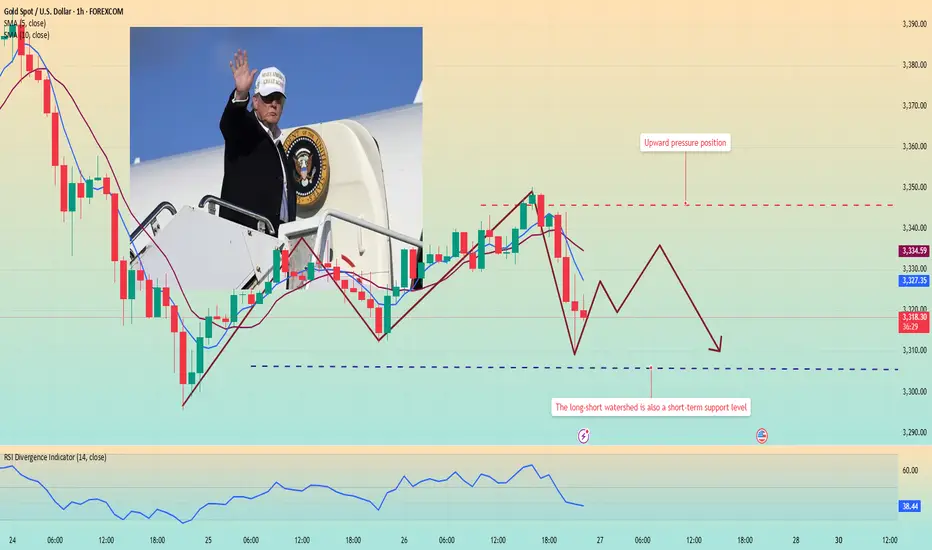
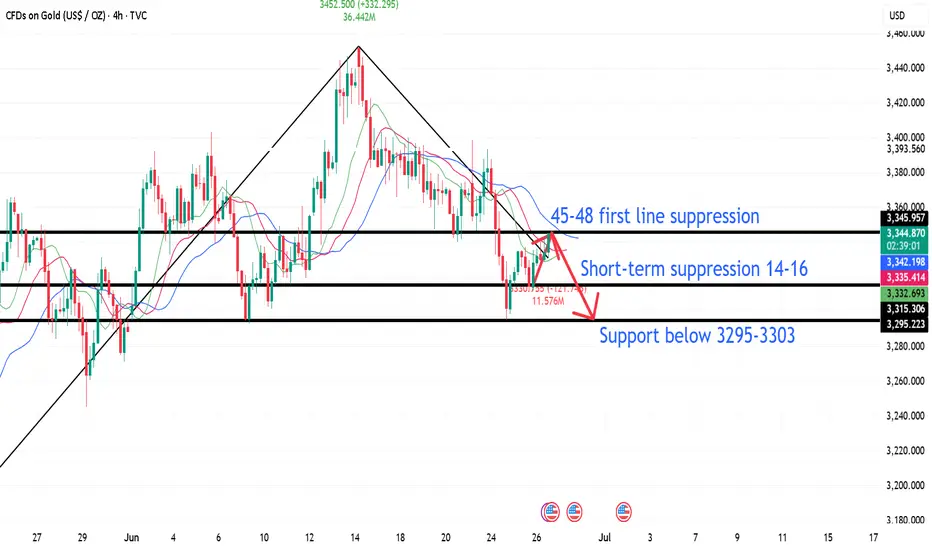
6.26 Gold intraday operation strategy, rebound 42-48 line shortFrom the 4-hour analysis, the upper resistance is around 3342-48. The intraday rebound relies on this position to continue to be short and follow the trend to fall. The short-term support below is around 3314-3316 integers. The upper pressure is around 3342-48. The overall support relies on this range to maintain the main tone of high-altitude low-multiple cycles. The short-term long-short watershed is 3370. It is difficult to say that it is strong before the daily level breaks through and stands on this position. I will remind you of the specific operation strategy during the session, so please pay attention to it in time.
Gold operation strategy:
1. Short the gold rebound at 3345-48, stop loss at 3356, target 3317-3325, and continue to hold if it breaks;
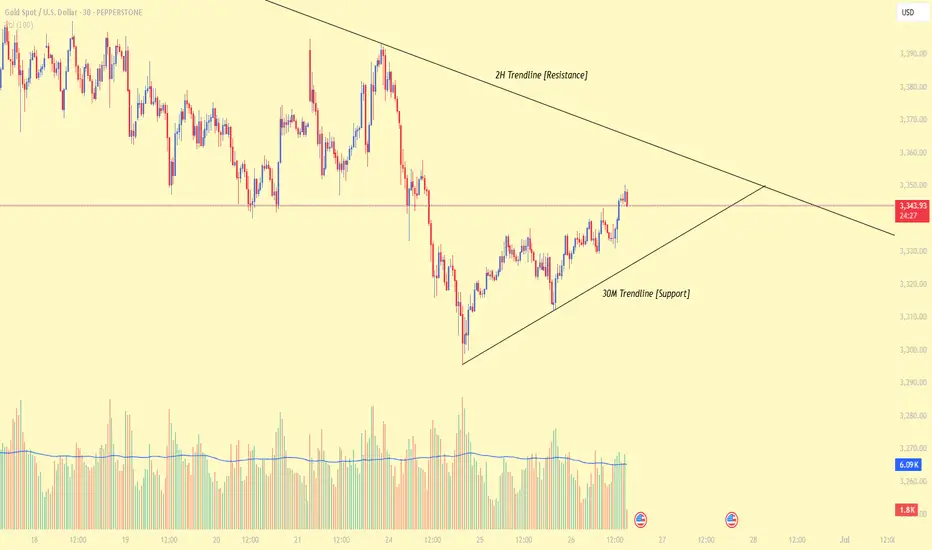
Gold Price ActionHello Traders,
There’s a potential Buy/Sell opportunity here based on the current price action. I’ve marked trendlines on two different timeframes, which highlight key Support and Resistance levels.
I've shared more detailed analysis on my channel, so feel free to check that out for deeper insights.
When the price reacts (rejects) from these support or resistance zones, we can look to confirm our entry by analyzing volume—this helps us avoid false signals.
For trade management, consider using a Risk-Reward ratio between 1:2 and 1:5, depending on your personal trading style. Most importantly, avoid trading blindly—always wait for confirmation.
Wishing you all the best and happy trading!
Thank you!
Gold fluctuated slightly, retreating to low-multiple operations
📌 Gold news
During the North American trading session on Wednesday, gold prices remained stable, rising by more than 0.30% as easing tensions between Israel and Iran boosted risk sentiment. Meanwhile, disappointing US housing data may prompt the Federal Reserve (Fed) to take action in the future. However, Fed Chairman Jerome Powell's continued tough stance has limited further upside for gold.
📊Comment analysis
Gold fluctuated in a small range yesterday, and the daily line closed with a positive cross star.
Daily support is around 3327-3324, and you can go long if you touch it.
Daily resistance is around 3368, and you can go short if you touch it.
If the market goes down to yesterday's low, the bottom continues to look near this week's low, and I am more inclined to be bullish
💰Gold operation strategy
If gold is close to 3327, you can go long, with a target of 3345.
Look for opportunities to short around 3350-3360, with a target around 3330.
I hope Labaron's article can help you with your investment. If you don't understand something, you can find me. I am not only a mentor, but also a friend worth making in your life.
⭐️ Note: Labaron hopes that traders can properly manage their funds
- Choose the number of lots that matches your funds
XAU/USD – Smart Money Building Toward $3360? |26 June 2025Gold (XAU/USD) is pushing into fresh highs around $3337, and we may be approaching a key inflection point. But beneath the surface of candles and wicks lies the real story — one written by liquidity, displacement, and smart money positioning.
This outlook breaks down gold’s price action using Smart Money Concepts (SMC), price structure, and Fibonacci confluence, to help identify the most probable high-value trade zones for both swing and intraday traders.
4H Outlook – Institutional Flow & Structure
Market Structure
Gold recently broke above the $3310–$3320 resistance, confirming a bullish Break of Structure (BOS). This keeps the market in a sequence of higher highs and higher lows, validating continued bullish pressure.
Smart Money Insights
BOS: Clean break above $3320 signals strength.
CHoCH: None yet — trend remains bullish.
Liquidity Sweep: Sell stops below $3295 have already been taken.
Buy-Side Liquidity: Sits above $3350 — price may gravitate there next.
FVG: Unfilled Fair Value Gap between $3314–$3322 — possible retracement zone.
Bullish OB: Identified between $3300–$3310, aligned with FVG and BOS level.
Equilibrium: Using $3275 (swing low) and $3342 (swing high), the midpoint sits near $3308, acting as fair re-entry value.
Key Zones
Buy Zone (Demand): $3295–$3310 — OB + FVG + Fib confluence.
Sell Zone (Supply): $3350–$3360 — next likely liquidity target.
Bias Summary
As long as price remains above $3295, the bullish structure stays valid. Watch for a retracement into $3308–$3316 for potential continuation toward $3350–$3360. Price may briefly dip below $3310 to trigger liquidity before moving higher.
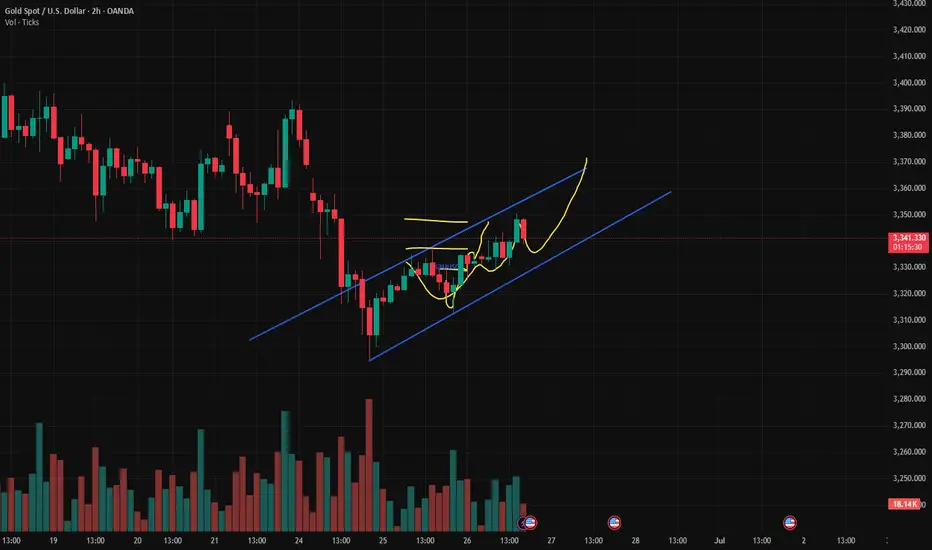
1H View – Precision Entries
Structure
Following the high at $3342, price has pulled back slightly and is forming what appears to be a bullish flag — often a continuation pattern.
Smart Money Zones (1H)
FVG: $3315–$3322 — potential short-term reaction zone.
Order Block: $3305–$3312 — 1H bullish OB aligned with 4H bias.
Sell-side Liquidity: Swept at $3295 earlier this week — supports continuation.
Trade Setups
Long Setup #1 – Optimal Entry
Entry: $3308–$3315
Stop: Below $3295
TP: $3342 (partial), $3350–$3360 (full)
Why: Strong zone combining FVG, OB, and Fib support.
Long Setup #2 – Aggressive Entry
Entry: $3316–$3320
Stop: $3300
TP: $3340–$3350
Why: Quicker entry inside the imbalance — riskier but valid.
Short Setup – Countertrend (Low Conviction)
Only valid on a clear break below $3310 + CHoCH
Entry: Below $3310 (confirmed)
Target: $3295
Note: Lower confidence unless 1H structure turns bearish.
Final Notes
The bias remains bullish above $3301–$3308. This is a high-probability area to look for long setups on retracement. Avoid shorts unless we see a confirmed structural shift with a CHoCH and OB breakdown.
Expect the market to potentially hunt stops below $3310, then aim for liquidity sitting above $3350–$3360.

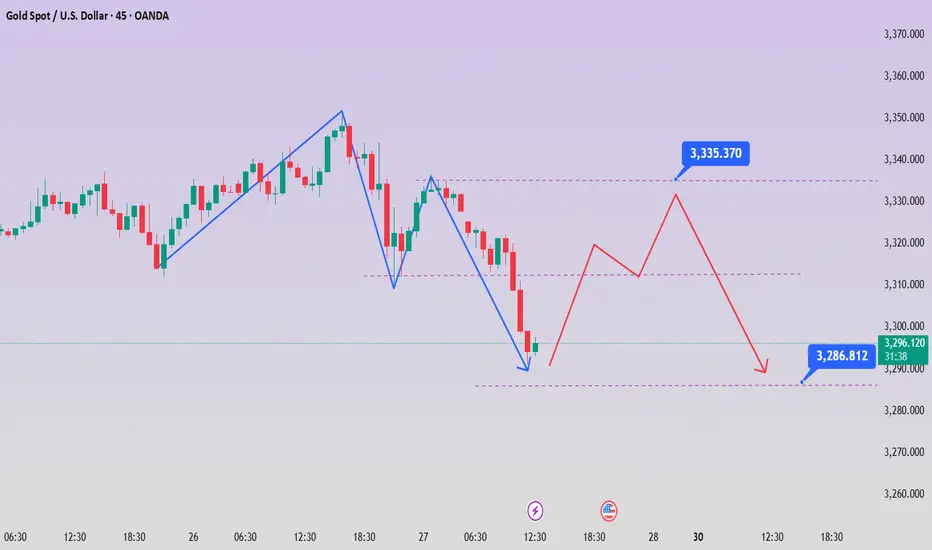
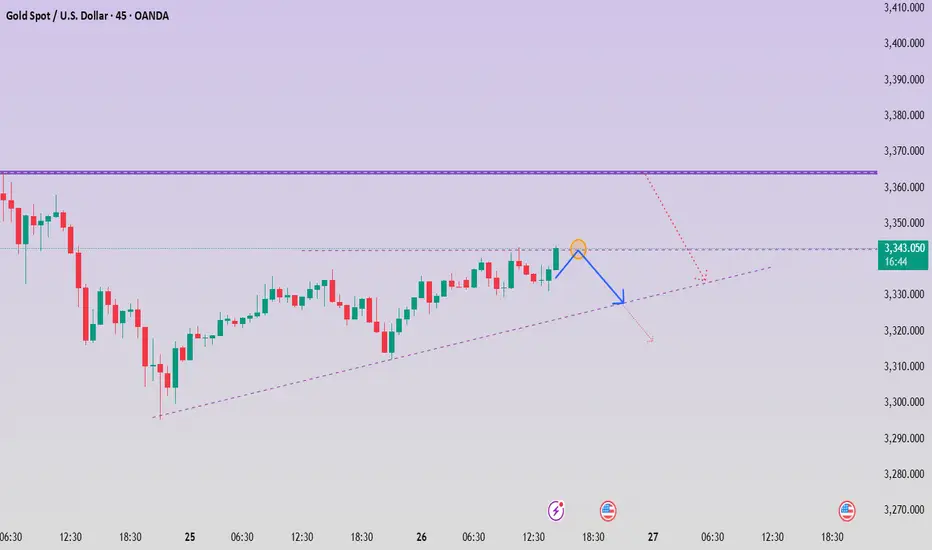
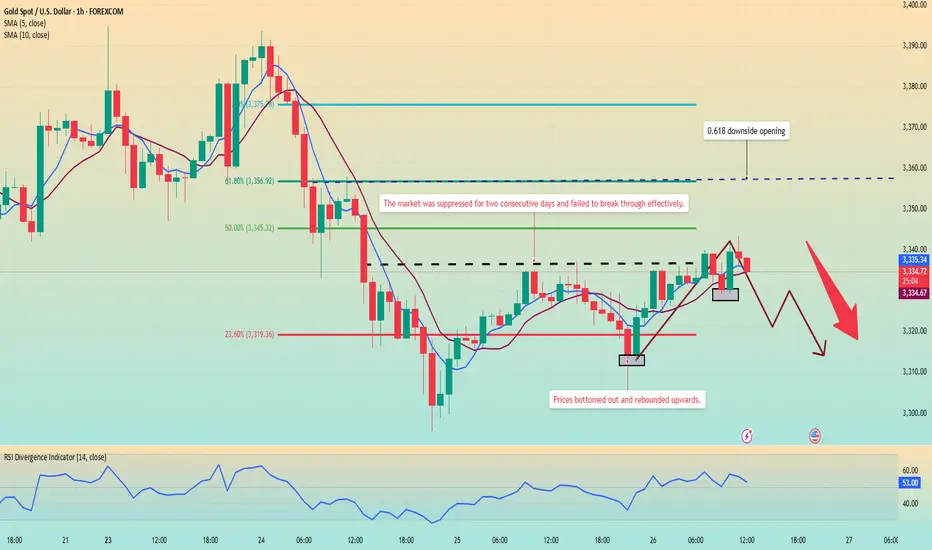
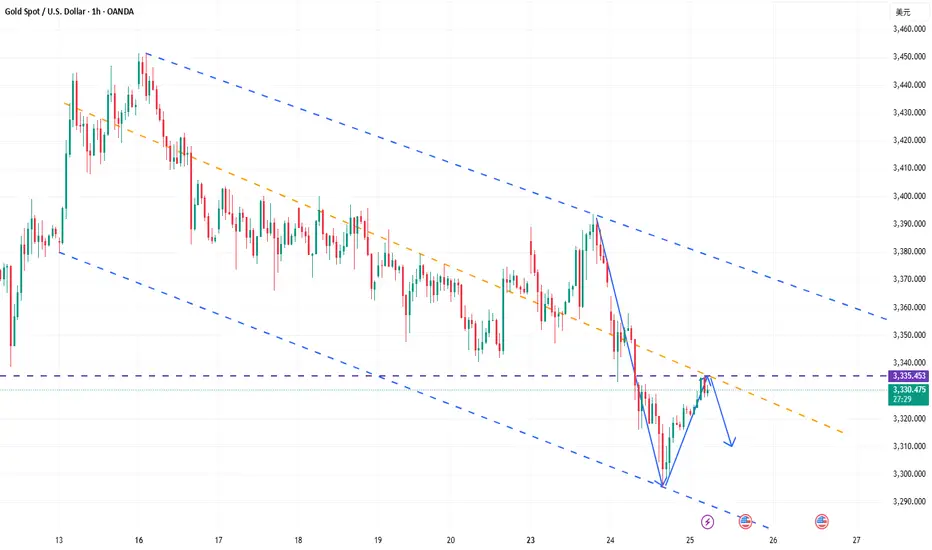
Gold continues to fluctuate. Waiting for a trend?Today, gold has been suppressed below the high of 3345, and the hourly line tends to be weak. Looking at the number of Yin and Yang lines on the hourly line during the fluctuation, we can see that the typical Yin line is continuous and the Yang line is few, plus the weak suppression of the previous day, from the rhythm point of view, it is a weak signal.
From the hourly chart, around 3312, this is the 0.618 position of the retracement of the 3295-3337 fluctuation range. The decline is slow during the day, and the 0.618 position has become a support rebound.
And the current trend, like the previous day, may continue to rebound and then fall. At the same time, there was no cyclical decline in the early Asian session. Instead, it fluctuated sideways, bottomed out and rebounded, and then continued to return to the high of the previous day.
Judging from the current market situation, the Asian market bottomed out and rebounded in the morning, reaching a high of around 3343, and then began to fall back, and is currently fluctuating around 3335.
The trend of the European session is very critical, and the focus is on the watershed below 3328. If this position falls below, the price will most likely continue to fall.
Operation strategy:
Short around 3340, stop loss 3350, profit range 3320-3310.
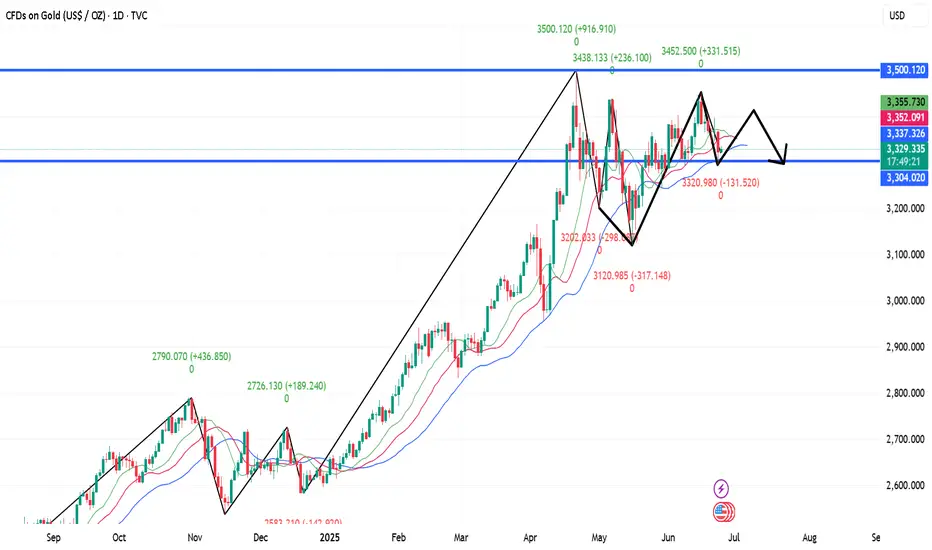
6.26 Gold intraday analysis guideOn Wednesday (June 25), international spot gold rose slightly during the US trading session, but was still suppressed by the 20-day moving average (US$3,355). The RSI (14) was at 48.7, in the neutral range of 40-60, suggesting that the market lacks a clear direction. US$3,355 (20-day moving average) has become the recent watershed between long and short positions. If it breaks through this level, it may test the psychological barrier of US$3,400. The support below is US$3,245 (the low point on May 29). If it fails, it may drop to the integer level of 3,200 and US$3,121 (the low point on May 15). Stability of the geopolitical situation: If the ceasefire agreement in the Middle East continues, the outflow of safe-haven funds may further suppress the gold price. Fed policy expectations: If the July non-agricultural and CPI data show that inflation is cooling down, it may rekindle expectations of interest rate cuts and boost gold. The current gold market is in a "wait-and-see mode", and both long and short sides lack decisive momentum. Traders need to pay close attention to: US economic data: especially employment and inflation indicators for the Fed's policy path. Geopolitical dynamics: Any breakdown of the ceasefire agreement could quickly push up safe-haven demand. Dollar trend: If the Fed maintains a hawkish stance, a stronger dollar may further suppress gold prices. Gold is expected to maintain range fluctuations in the short term, with the $3,355 moving average resistance and $3,245 support forming a key trading range. The direction of the breakthrough depends on new fundamental catalysts.
Personal operation analysis:
Trend: Oscillating trend
Support: Near 3,300.00
Resistance: Near 3,335.50
Strategy:
View logic: Short view near 3,335-3,340, stop loss 3,345, take profit near 3,300--3,280, and follow the stop loss 300 points.
Gold is obviously suppressed, so we must go short!Yesterday, gold continued to fluctuate and fall under pressure at the 3360 mark. The US market further accelerated downward to break through the 3300 integer mark and reached a weak closing near 3295. The daily K-line closed with a suppressed fall and broke the bottom of the middle shadow. The overall gold price continued to fluctuate and fall in a weak rhythm. After reaching the lowest level of 3295, it rebounded and closed at 3323. Today, it opened at 3324. As of now, it has reached the highest level of 3337. At present, we are focusing on the suppression of 3340-3348. If the rebound is under pressure, we can still intervene in short orders. The recent market trends are basically the same - bottoming out and rebounding. In terms of operation, continue to keep shorting under pressure and long positions after bottoming out and rebounding.
From the current market trend, today's upper short-term resistance focuses on the 3338-3342 area. If it rebounds to this range and is under pressure, you can consider choosing an opportunity to arrange short orders. The lower support focuses on the 3315-3305 line. If it falls back and stabilizes, there is a possibility of a short-term rebound. The overall situation is still in a range-bound structure. It is recommended to focus on key points, buy high and sell low, follow the trend, and strictly control risks. For more specific operation points, please pay attention to the 🌐 notification at the bottom.
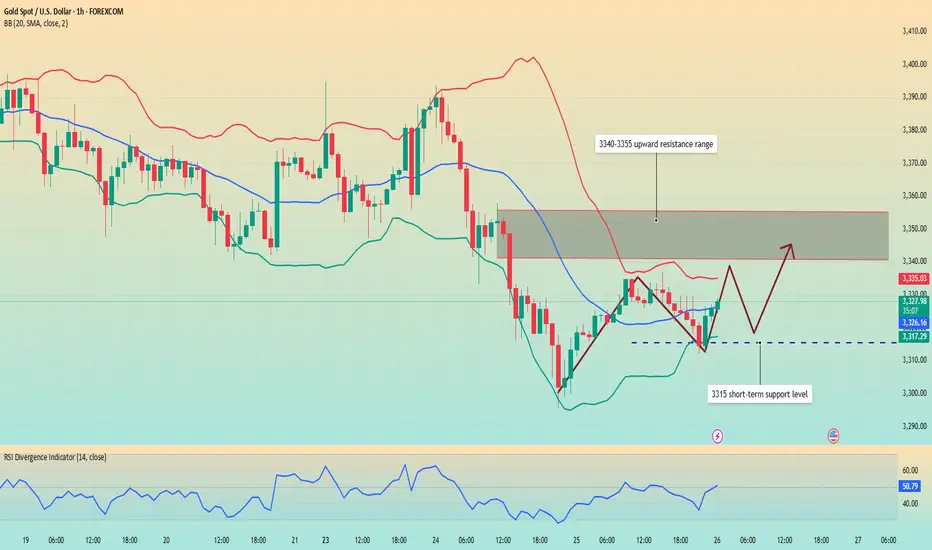
Gold fluctuates upward. Trend change?Yesterday, the gold daily line closed with a middle-yin candlestick with a lower shadow. The closing price has lost the middle and lower rail positions one after another, and the short-term downward pressure adjustment will continue.
The hourly level shows a bottoming out and rebound, and it rose in the early Asian session, breaking through the pressure resistance of 3328-3332 in the European and US sessions yesterday, but it did not continue the rebound and fell into a narrow range. At present, there is still great resistance above 3340, and it has failed to break through after many attempts, but the hourly line track has not been completely lost.
Pay attention to the 3315 support for long positions, and pay attention to the 3340-3355 short position range for upward movement. For the period of shock, strong support or resistance will inevitably produce inertial puncture behavior, and some errors are normal. We need to pay attention to the market trend at all times and change strategies in time.
Today we need to focus on the response strategies for resistance and support levels, which will determine whether we can achieve profits within the fluctuation range.
Good luck to everyone.
Gold fluctuates sharply, both bulls and bears have opportunities
💡Message Strategy
1. The decline in gold prices is directly due to the cooling of market risk aversion caused by the ceasefire agreement between Israel and Iran. The attractiveness of gold as a safe-haven asset has weakened. The ceasefire agreement is fragile. Israel and Iran have accused each other of default. Trump criticized both sides. Its sustainability is questionable, adding uncertainty to the gold market.
2. Federal Reserve Chairman Powell testified at a congressional hearing on June 24 that it is necessary to observe the impact of tariffs on inflation before cutting interest rates. He is not in a hurry to cut interest rates, which has cooled expectations for a rate cut in July. Gold, as a non-interest-bearing asset, is under pressure under high interest rate expectations. The uncertainty of inflation caused by tariffs also limits the attractiveness of gold as an inflation hedging tool.
3. The U.S. Consumer Confidence Index fell to 93.0 in June. Consumers are worried about employment and economic prospects. Although the one-year inflation expectations have fallen, the expectations for rising interest rates have risen, which has weakened the safe-haven demand for gold. In the long run, gold's anti-inflation and safe-haven properties are still there. Global economic uncertainty and a weaker dollar may rekindle demand for gold. Investors need to pay attention to the Fed's policies and the situation in the Middle East and seize the opportunity to allocate.
📊Technical aspects
1. The weekly level switches space around the 10-day moving average. This week has not yet closed, so there is no final conclusion. You can keep it in mind first.
2. The daily line lost the lifeline support area that has been held for a month. The top and bottom are converted to each other. The lifeline position 3355 becomes the resistance range. However, please note that the pattern is closing, which means that the switching space is not the direction. The opening and volume must be opened to guide the direction.
Note that two points are also contradictory points. One is the lifeline 3355 switching space, and the other is that the pattern further closes and accumulates momentum, waiting for the opening to guide the real direction.
3. Five consecutive negatives in four hours, a drop of more than 100 US dollars from 3396 to 3295, and then began to rebound from a low position. This is very embarrassing. If it is a trend, there will be no consecutive positives. action, and will not linger for so long
Then there is only one explanation left, or sweep, pay attention to the lifeline position 3350, the double-line upper rail position 3364, together become the pressure line position of the partial sweep method
There can be a rise in leverage, but it cannot be a breakthrough of continuous rise or steady rise, otherwise the nature will change again
4. The double lines of the hourly chart are close and superimposed in the 3350-3355 area, which coincides with the four-hour lifeline. At the same time, this is also the last rebound to determine the resistance area yesterday afternoon, so as to change the nature
5. The large channel cooperates with the small channel interval. After breaking through yesterday, it further fell in volume. Now the position along the large channel is in the 3340 area. This will be the acceleration point today. Breaking through accelerates the rise, and breaking through accelerates the fall
💰Strategy Package
Short Position:3345-3355,SL:3365,Target: 3300-3290
Long Position:3280-3290,SL:3265,Target: 3340
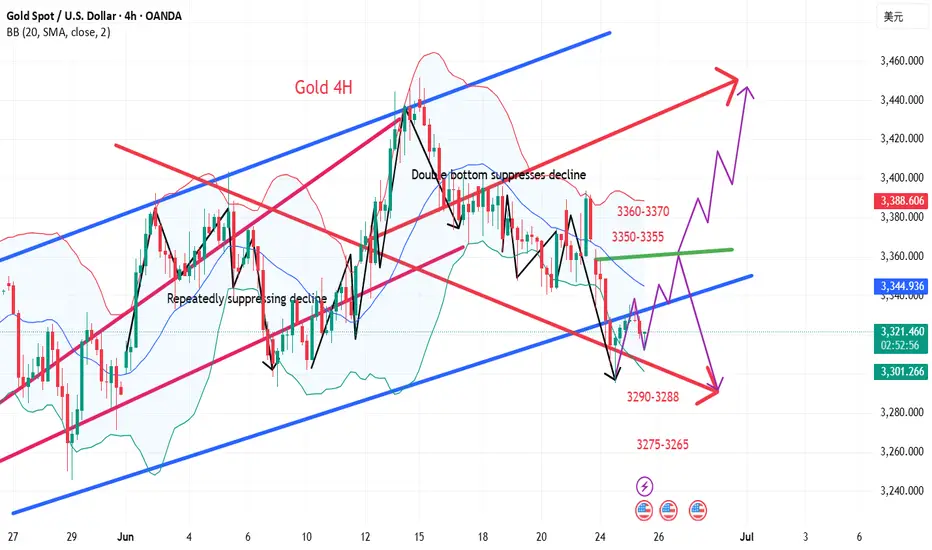
Gold fluctuates, 3300 may fall below.Gold fell to 3333 on Tuesday and then rose to around 3358, then began to fall slowly due to resistance, continued to fall in the European session, and fell to around 3295 in the US session, and rebounded in the late trading, rebounding to around 3325, and the daily line closed with a negative line with a lower shadow.
In addition, Israel and Iran both accused each other of violating the agreement, which brought uncertainty to the gold market.
After the sharp drop in gold last week, except for the correction of the cross positive line on Tuesday last week, the daily level has closed five consecutive negative lines since last Wednesday until now, fully demonstrating that the gold price has shown a weak feature of fluctuating downward in recent transactions.
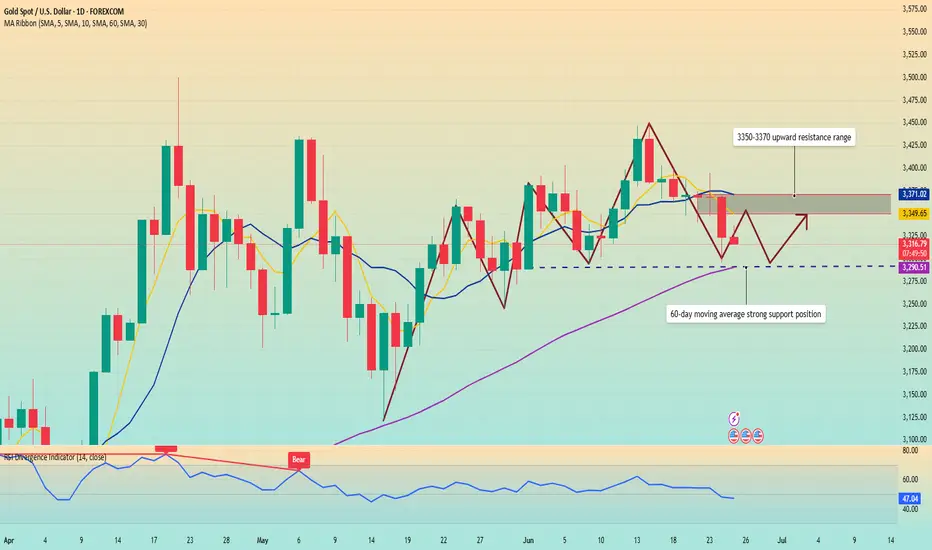
From the technical indicators, the 5-day moving average and the 10-day moving average cross downward, which indicates an important signal that the market trend is weakening in the short term. The current gold price continues to run below the moving average, further verifying the current market situation where shorts dominate.
In terms of resistance, the 5-day moving average is currently around 3350, and the 10-day moving average is around 3370. These two price levels constitute the key resistance range in the upward process of gold prices. As long as the gold price fails to effectively break through this resistance band, it is likely to continue to be weak in the short term. At the support level, pay attention to the 60-day moving average around 3290.
Operation strategy:
Short gold rebounds around 3350, stop loss 3360, profit range 3320-3310.
Go long gold falls back to around 3295, stop loss 3285, profit range 3330-3340.
The market conditions are often not what we ideally want. This is the market, and it is also a form of trading practice.
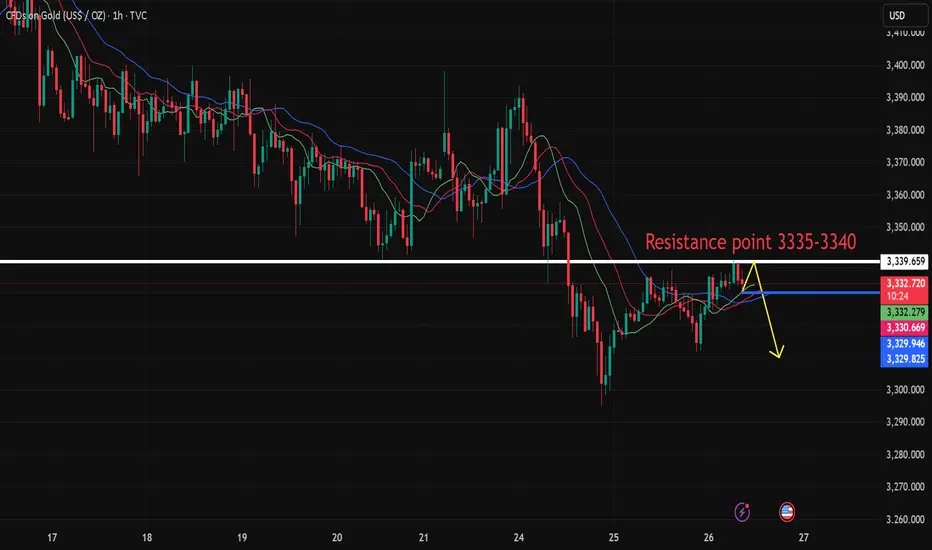
The current price of gold is 3330-3335, go short directly!Gold rebounded after hitting the bottom of 3295. At present, gold is just a rebound, not enough to reverse directly. Gold rebounds and continues to be short. After all, the daily line has fallen continuously, so the short momentum of gold is still there. In the short term, the rebound of gold is just a repair after oversold. Gold is currently priced at 3330-3335 and is directly short.
The 1-hour moving average of gold continues to be arranged in a short position downward. After gold fell below the previous low of 3340 yesterday, gold has not been able to rebound again. In the short term, 3340 has become the key to long and short positions. In the short term, gold rebounds below 3340 and continues to be shorted. If gold breaks through and stabilizes at 3340 again, then gold may start to fluctuate again. Before breaking through 3340, gold is still weak and continues to maintain a short trend.
Gold is under pressure. Will the trend change?Information summary:
The easing of tensions in the Middle East is the main reason for the suppression of gold. Risk aversion has weakened, and the market has entered a risk-taking mode. Gold prices are well supported near $3,300.
Powell released an important signal: The market expected Powell to strongly refute the possibility of a rate cut, but he remained on the sidelines. The market still generally believes that the July 29-30 meeting is unlikely to initiate a rate cut, and the first rate cut is expected to be in September.
Market analysis:
Gold has fallen for seven consecutive weeks, which has changed the current bull structure in stages, so there is no doubt that gold is expected to fall back as a whole. The early decline was near 3355, which is the current long-short watershed of gold. As long as the adjustment does not break through the 3355 position, the overall short-term adjustment pattern of gold will not change.
The early Asian market did not continue to retreat, but the short-term rebound had a long buying force accumulation, but as long as it did not break through 3355, the market trend was still weak, and it was adjusted by low-level shock correction. Today, there is a high probability of movement around the falling range. The short-term support below is around 3290. If this position is lost, it may touch the turning point around 3275.
Operation strategy:
Go long when the price falls back to around 3315, stop loss at 3305, and profit range 3345-3350.
Gold today high-altitude low-multiple operation
📌 Gold news
On Tuesday, the spot gold price plummeted, hitting a two-week low. The main reason was that Iran and Israel announced a ceasefire, which suppressed the demand for safe-haven gold. In addition, Fed Chairman Powell made hawkish remarks, which also hit the gold price trend. Short-term long-short game will focus on the PCE inflation data to be released by the United States. If the economic data performs poorly or inflation continues to fall, it may still provide a medium-term rebound opportunity for gold.
📊Comment analysis
Yesterday, gold was weak overall, and the decline and rebound were limited. It fell directly from around 3357 to 3295, and then rebounded according to the news. It ran around 3326 in the morning. From a technical point of view, the daily low trend line support is around 3290, the 4-hour long lower shadow line bottomed out, and three consecutive positive rebounds, the daily line supports the lower track of the Bollinger band, and the Bollinger band tends to be parallel. There is no sign of opening downward, so the short-term decline of gold prices is limited. Consider paying attention to the support of 3294 during the day, and mainly use this position for defense and low long. Pay attention to the important suppression of the middle track 3363 above, and mainly short.
💰Strategy Package
Focus on the support near 3316-3317 in the short term, rely on this position to go long, stop loss 3307, take profit near 3345, and break 3363. If it falls strongly below 3294, then don't consider going long during the day.
Gold operation strategy: long near 3316, stop loss 3307. Take profit 3345
⭐️ Note: Labaron is not 100% correct here, only a steady operation idea, large warehouse for trend, small warehouse for wave, control the proportion by yourself, there is no unprofitable investment, only unsuccessful orders, whether to make money depends on the timing of buying up and buying down, making money depends on opportunities, investment depends on wisdom, and financial management depends on professionalism.
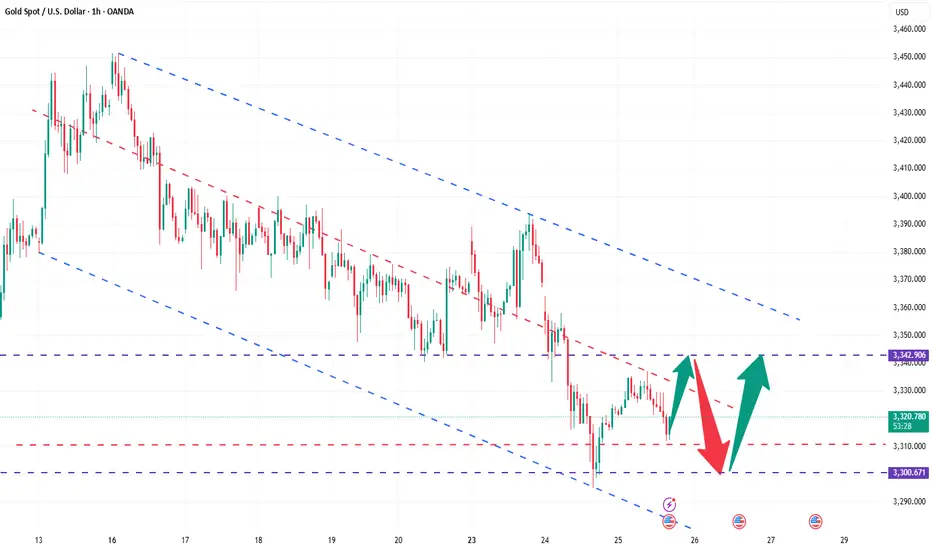
The latest analysis of gold trend on June 25From the perspective of technical analysis, based on the daily level, the gold price is expected to be further under pressure in the future. At the daily level, the current focus is on the 3370 area resistance. The 1-hour line shows that the short-term pressure is at the position of the previous upward trend line retracement. Due to the short-term market volatility and decline, it is necessary to temporarily focus on the current downward trend line area resistance, which is also the daily and four-hour resistance area. The 3330-3315-3310 area will be followed below. If the market is in an extremely weak state, the gold price is expected to test the 3330-3270 area. From the indicator signal, the RSI oscillation around 50 shows that the market is balanced between long and short forces, the MACD red column shrinks, and the fast and slow lines flatten, indicating that the bullish momentum is weakened; the KDJ high dead cross shows that the short cycle may be corrected.
Comprehensive technical analysis, today's short-term operation strategy for gold is mainly rebound short selling, supplemented by low long selling. The short-term focus on the upper side is the 3370 - 3380 resistance line, and the short-term focus on the lower side is the 3330 - 3315 support line.