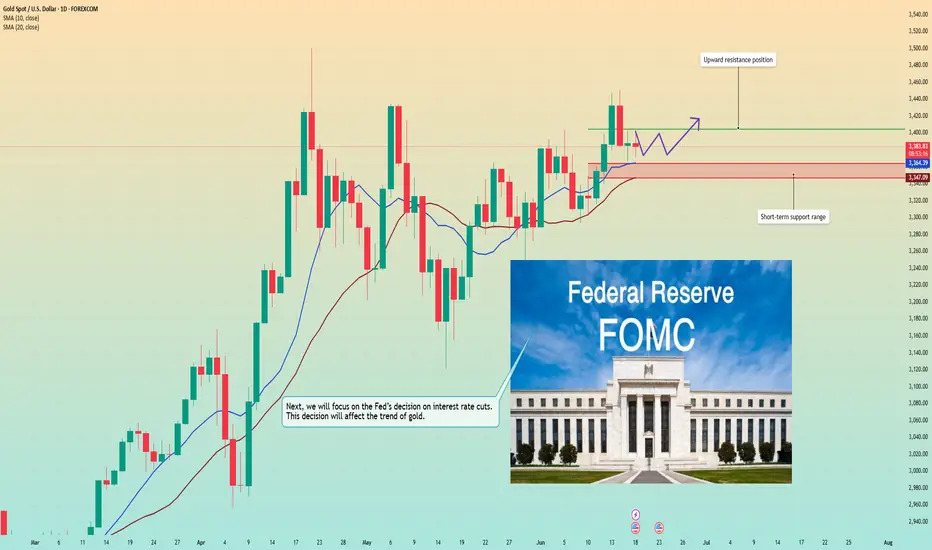
Dark moment for prices. Will it fall even lower?Information summary:
Due to the ceasefire in the 12-day war between Iran and Israel, market risk appetite has rebounded, demand for safe-haven assets has declined, and gold prices have plummeted. As an interest-free asset, gold prices are under pressure against the backdrop of declining risk aversion, but there is still buying support at low levels.
Investors are currently focusing on the speech of Federal Reserve Chairman Jerome Powell at a hearing of the House Financial Services Committee. Powell has been cautious about whether to cut interest rates in the near future.
Market analysis:
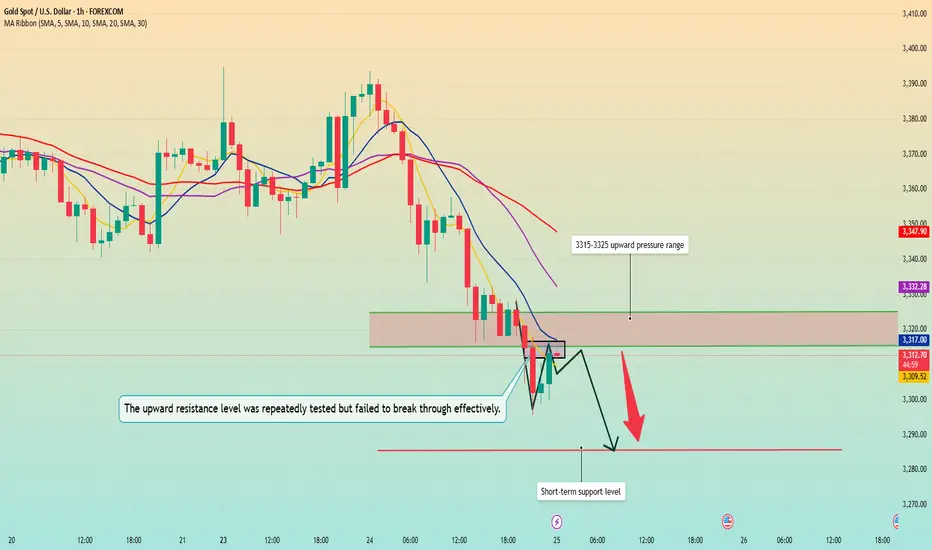
The current market selling sentiment has increased significantly, and for gold, falling has become the only path. It seems that the market has lost hope in gold, and the current gold price has fallen to around 3295, then rebounded slightly, and is currently fluctuating around 3313. The break of 3300 declares that gold still has further room to fall, and from the trend point of view, it is likely to continue to fall.
The current trend shows that the important support is around 3285. It is possible that it will fall directly to the current position. The Fed is still speaking, and it is unpredictable whether it will cause drastic fluctuations in gold in the future. However, from today's trend, shorting is the best solution at present, and the upper resistance position is in the range of 3315-3325.
Operation strategy:
Short around 3320, stop loss 3330, profit range 3290-3285.
Goldpriceaction
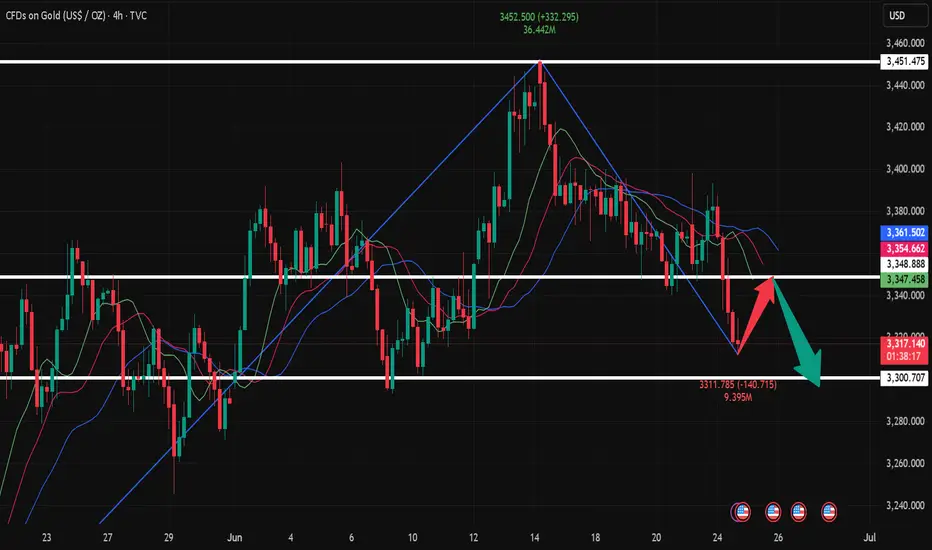
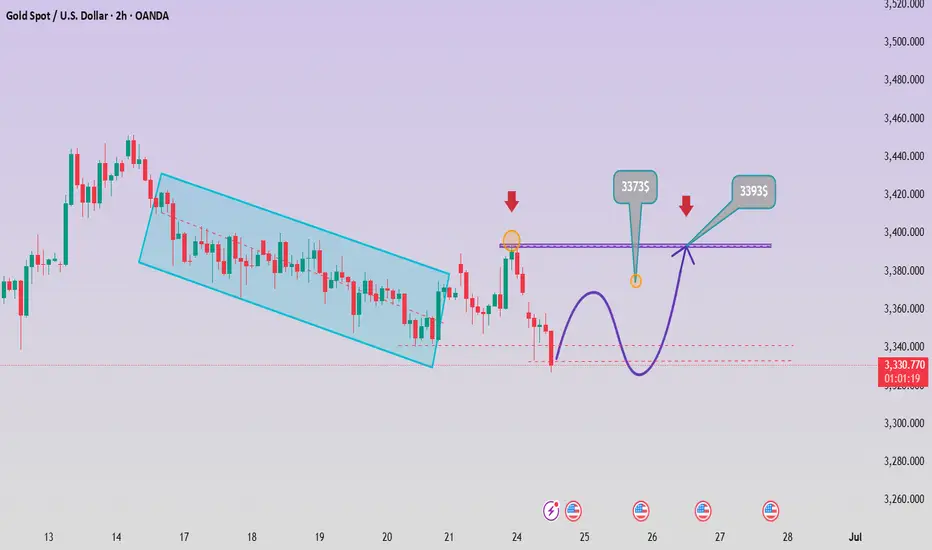
Buy gold first, and short on gold after filling the gapGold is currently continuing to retreat, and the lowest has reached around 3333. Gold is quite weak, and the bears have completely taken the upper hand. The overall center of gravity of gold is shifting downward, and the short-term support below is 3330-3325. Once gold falls below this support area, gold may continue to fall to 3300, or even 3280; since gold has fallen to the 3340-3330 area, we cannot rush to short gold in the operation, because there is a technical gap above that needs to be filled, so gold still has a rebound to 3360-3370 in the short term.
Therefore, before gold falls below the short-term support of 3300-3325, we can appropriately consider going long on gold; after gold rebounds technically and fills the gap above, we can consider continuing to try to short gold in the 3360-3370 area.
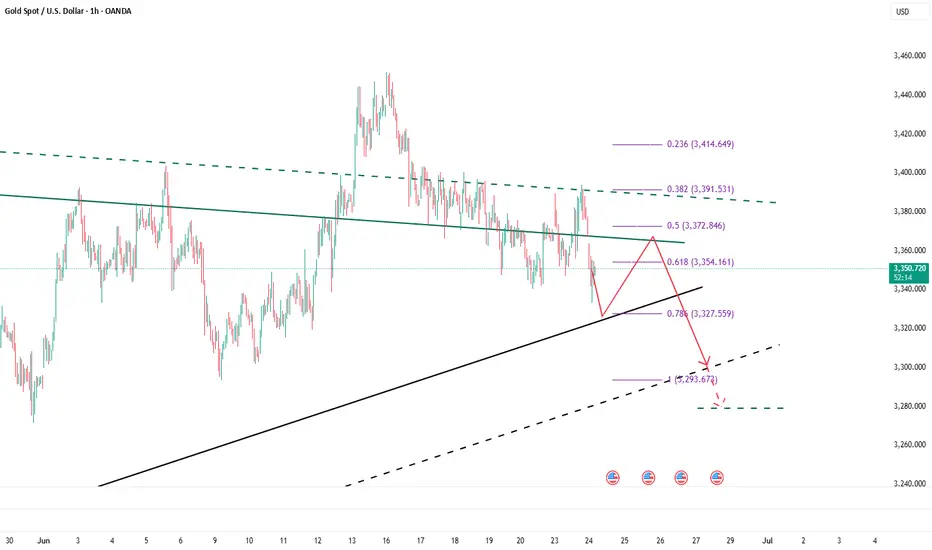
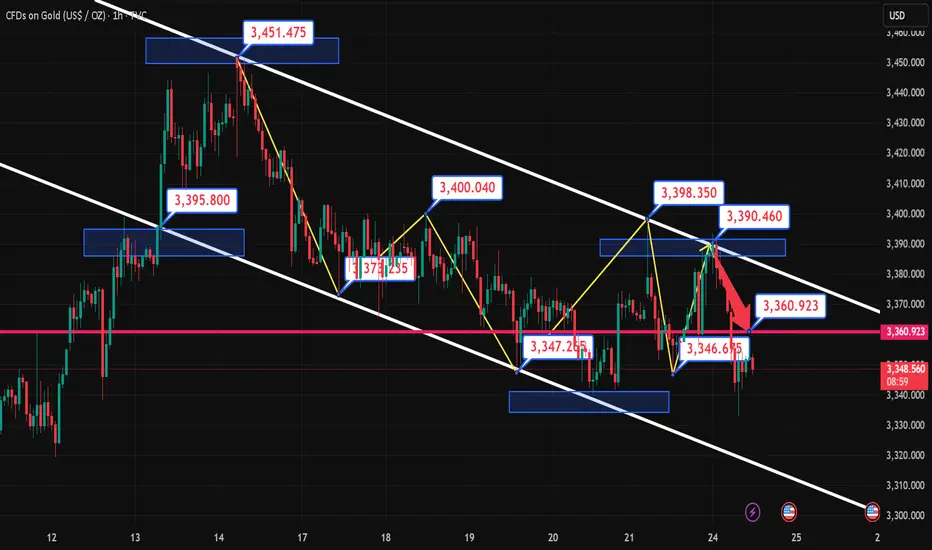
Continue to short after the rebound on 6.24Judging from the current market trend, the upper short-term resistance is around 3343-48, the lower short-term support is around 3310-15, the short-term long-short strength watershed is 3300-05, the daily level is under pressure and continues to see suppression and adjustment, and the main tone should actually be rebound shorting.
Gold operation strategy:
Gold rebounds to 3343-48 and shorts, stop loss 3356, target 3317-3323, continue to hold if it breaks;
Gold continues to decline, can it still change the trend?Information summary:
Will the Fed cut interest rates in July? The latest statements of Fed officials have released a heavy signal. Fed Governor Michelle Bowman said that as long as inflationary pressures remain moderate, she will support a rate cut at the next policy meeting in July. At the same time, Trump has continued to put pressure on the Fed.
Next, investors need to pay attention to the testimony of Fed Chairman Powell on the semi-annual monetary policy report to the House Financial Services Committee today.
Market analysis:
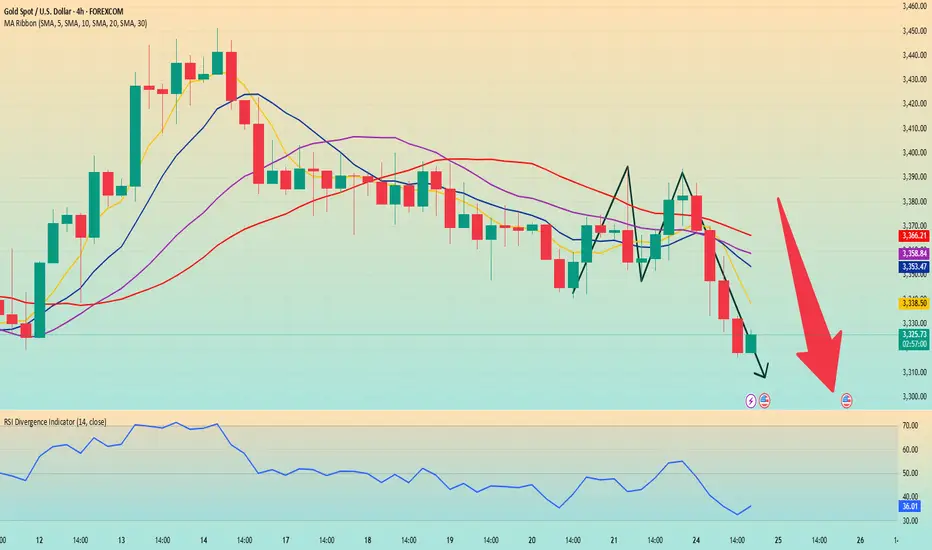
Gold fell sharply today, directly breaking the key support level of 3350. From a 4-hour perspective, the MA moving average shows a short trend arrangement, and the MA5\10 moving average crosses the MA20/30 long-term moving average downward, which indicates that the short force is dominant. In addition, the RSI indicator also fell rapidly and entered the oversold area, but this may also suggest that prices have a rebound trend in the short term.
I think the current market price decline trend is more obvious, unless there is significant positive data, the gold price may continue to decline.
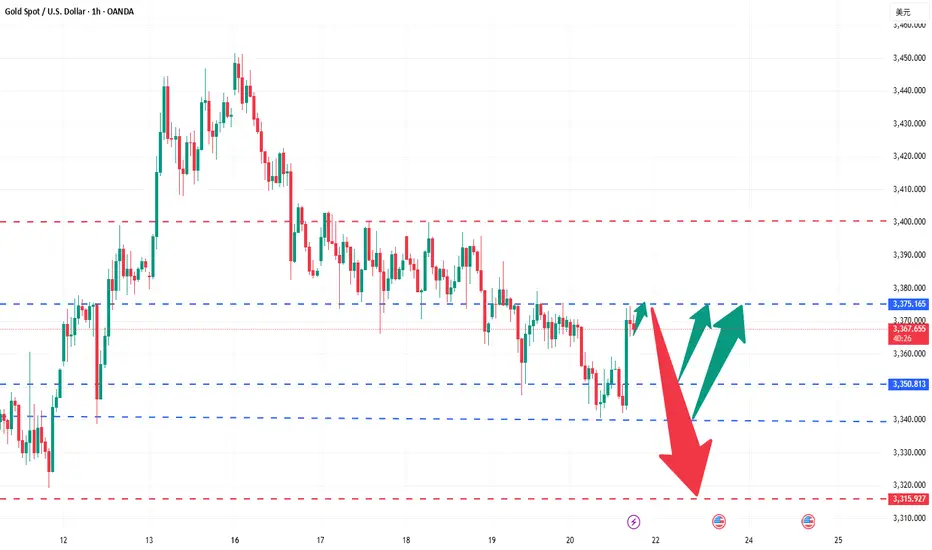
Gold Short Term OutlookYesterday’s chart idea is playing out as analysed.
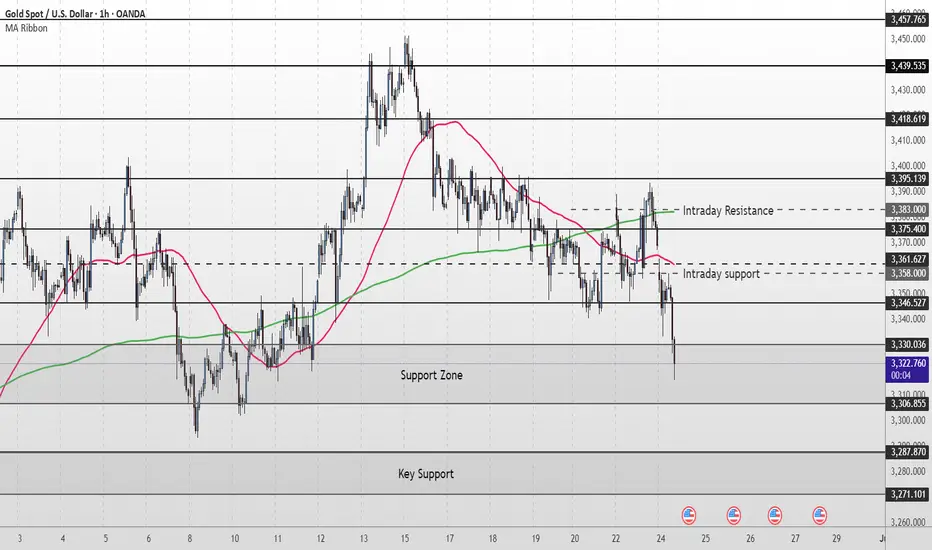
Gold failed to break above the $3,395 resistance and has now pulled back, currently testing the first support zone — aligned with the 4H 200MA and Daily 50MA.
If this area fails to hold, price is likely to head toward the next key support zone, where we expect a potential reaction.
To resume bullish momentum, we need to see a strong close above $3,346. Key bullish zones remain $3,375 and $3,395.
📌 Key Levels to Watch:
Resistance:
$3,375 • $3,395 • $3,418 • $3,439
Support:
$3,361 • $3,346 • $3,330 / $3,306
$3,287 – Critical demand zone
🧠 Fundamental Focus:
All eyes are on Fed Chair Powell’s testimony today, which may offer clues about the Fed’s rate outlook and inflation stance. Any hint of continued hawkishness could weigh on gold, while dovish commentary may trigger renewed upside interest.
Expect heightened intraday volatility around his remarks — stay cautious.
Iran and Israel ceasefire? Gold price falls and adjusts
📌 Gold information:
Gold prices continued to be well supported during the North American trading session following the breaking news of Iran's retaliatory attack on the US military base in Qatar. The escalation was a response to Washington's weekend attack on Iran's nuclear facilities. As geopolitical tensions in the Middle East dominated the headlines, investors largely ignored US economic data
Macroeconomic indicators have taken a back seat as the intensification of the conflict has affected market sentiment. Arab TV cited Israeli media reports that Iran used missiles to attack US bases in Qatar, Kuwait and Iraq. In further escalation, Tehran approved the closure of the strategic Strait of Hormuz and launched more missiles at Israeli targets, which amplified the safe-haven demand for gold.
The situation in the Middle East has mixed signals. Trump announced a "stop" to the Iran-Israel conflict, while the exchange of fire between the two sides continued, and the proportion of gold longs fell back
📊Commentary Analysis
Gold prices responded to the reduction of positive news on peace in the Middle East and continued to rise.
💰Strategy Package
Short when the price rebounds to around 3370, stop loss at 3480, target at 3350-3388 points
Long around 3310-3320, stop loss at 3300, target at 3360-3368 points
⭐️ Note: Labaron hopes that traders can properly manage their funds
- Choose the number of lots that matches your funds
6.24 Gold safe haven fades and gold falls
Technical aspect: After the gold price hit the 3400 integer mark overnight, it fell rapidly under the impetus of negative news. The overall fluctuation range is still within the 3330-3400 range we expected. This shows that the current market dominated by news lacks continuity. We make a golden section of the high and low points of the overnight decline to the current level, and the current position of 0.618 is 3370.
Pressure level: 3370\3375\3400
Support level: 3330\3300
Israel and Iran have a truce. Gold fluctuates sharply.Information summary:
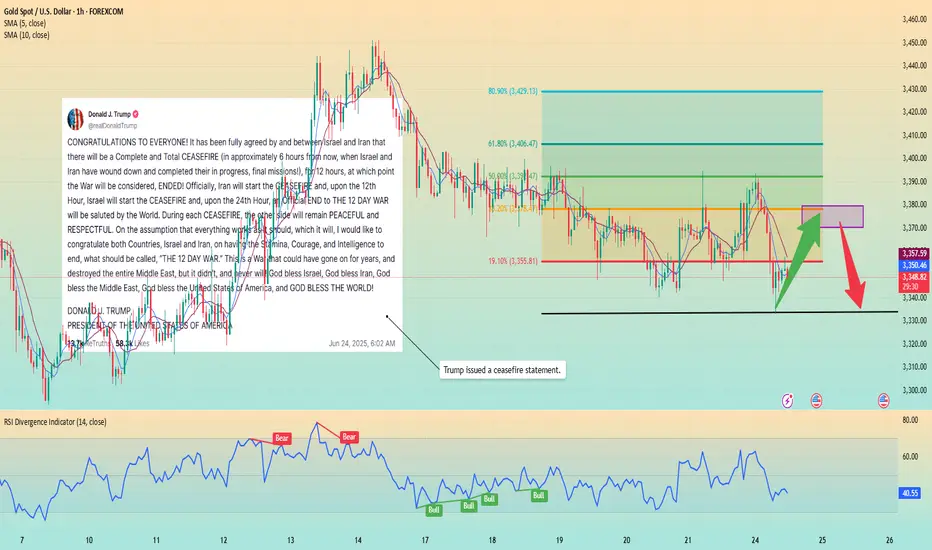
Trump said on Truth Social that Israel and Iran have fully agreed and there will be a complete and thorough ceasefire. (About 6 hours from now, when Israel and Iran have finished and completed the last mission they are doing!).
After 12 hours, the war will be considered over. Iran will start a ceasefire first, and after the 12th hour, Israel will start a ceasefire, and 24 hours later, the world will salute the official end of this 12-day war.
Senior Iranian officials have confirmed that Tehran has agreed to a US-proposed ceasefire with Israel brokered by Qatar.
Market analysis:
From the current point of view of gold, the news market has been digested in the early Asian market, and gold has also fallen to around 3330. Now it is obvious that there may be a bottoming rebound.
But from the trend point of view, gold is still in the short position, and 3380 and 3400 have not been stabilized.
Judging from the current hourly chart, gold is likely to rebound to 3370-3380. Then it will quickly fall from this position to the early trading low of 3330. At the same time, we can also see that the trend near 3378 is at the Fibonacci 0.382 position. Moreover, the previous trend also rebounded from 3330 to 3380, and then fell back again.
So we need to be patient and wait for the price to rebound before going short. Of course, we can also choose an aggressive long strategy. Of course, we can also choose an aggressive long strategy.
Operation strategy:
Short near 3380, stop loss 3390, profit range 3350-3330.
Long near 3345, stop loss 3335, profit range 3370-3380.
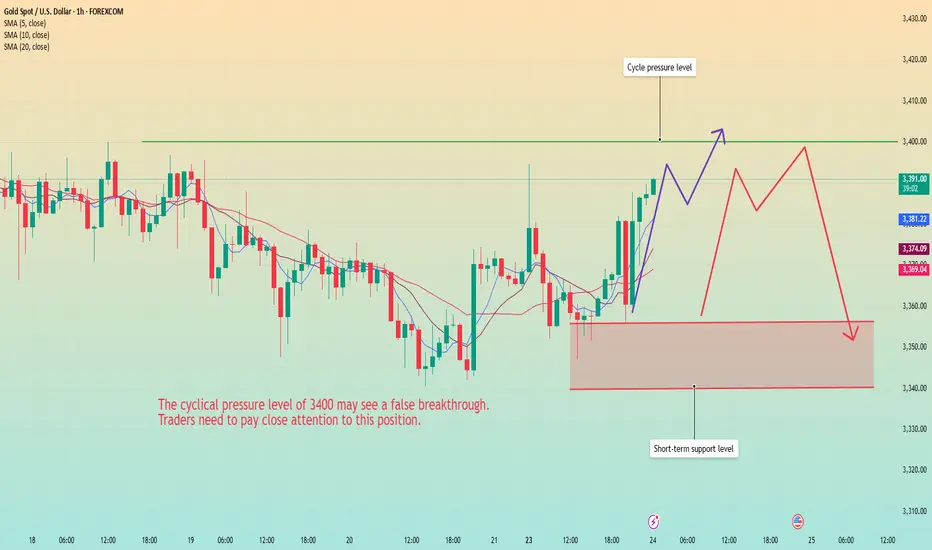
Gold is moving upward. Testing the ultimate pressure.Gold opened high at around 3397 and then quickly retreated. After hitting the lowest point of around 3346 in the European session, it continued to rebound. It fluctuated in a large range around 3360-80 many times, which also added a lot of confusion to the market.
After retreating to around 3355 again, it continued to move upward, reaching a high of around 3389. At present, the market still has upward momentum, and the key pressure above is maintained at 3400, which is also the previous high point and the last line of defense for the bears. If this position continues to be broken, the bulls may continue to move upward without resistance in the later period, with the target price around 3430-3450. The key support below is still maintained in the range of 3355-3340.
Judging from the current market, the short-term fluctuations may continue to expand, and the ultimate target above is maintained at around 3400. This position is likely to be broken, but the probability of continuing to rise is small. The current bulls may still be in a form of enticing more.
Operation strategy:
Short near 3395, stop loss 3410, profit near 3375.
If it continues to break below 3370, it will be seen around 3340. If it breaks through the extreme pressure level of 3400, we need to consider stopping the loss in time. .
6.23 Gold Short-term Technical AnalysisStimulated by geopolitical conflicts such as the US airstrike on Iran's nuclear facilities on Monday, gold opened $24 higher at 3398 in the early trading. However, it failed to continue the upward trend and quickly fell back to the 3360-65 area. Retrieve all the gains!
Technical analysis: 4-hour head and shoulders top pattern: right shoulder 3373 neckline 3340 MACD dead cross diverges downward Bollinger band opening expansion and price running near the lower track, short-term trend is bearish, and the daily line is still in the rising channel!
Short-term operation:
SELL: 3375\3385 Stop loss: 3390
$1:3360 $2:3340
BUY: 3338\3345 Stop loss: 3353
$1:3380 $2:3400
Operation suggestion: High-altitude is the main, low-multiple is the radiation
6.23 Gold Short-term Technical GuidanceThe current price is in the double-line interval of 3350-3375 on the hourly chart. Please note that the four-hour lifeline 3368 is also the resistance point determined by the last rebound in the Asian session.
The Asian session fell under pressure and returned to the sweeping range. It was treated as a sweep. The European session was able to hold the 3350 mark. Look up to find the 3368 area, followed by 3375 and 3385-3388.
If the European session falls below and closes below 3350, the short-selling forces are dominant. The four-hour lifeline 3368 is used as suppression. Look down to find 3333-3331, followed by 3320-3315
Middle East war, gold breaks through 3400 early next week
Hello everyone:
Let's analyze the gold price next week (June 23, 2025 to June 27, 2025)
📌Gold information:
Gold prices held steady on Friday, hovering around $3,369, and are expected to fall nearly 1.90% this week as the market digests U.S. President Donald Trump's decision to abandon immediate military action against Iran and turn to diplomacy. As of writing, XAU/USD fell 0.11%.
While easing geopolitical tensions helped boost risk sentiment, concerns that the United States may restrict allies operating semiconductor factories in China put additional pressure on gold, according to Bloomberg. Trump's restraint on Iran encouraged risk appetite and suppressed the appeal of this safe-haven metal.
What has President Trump been busy with in the past 24 hours? (2025-06-22)
1. Announced the successful airstrike on Iran's three nuclear facilities - Trump issued a message saying that he had successfully launched attacks on Iran's three nuclear facilities, including Fordow, Natanz and Isfahan. The main target Fordow nuclear facility was bombed with a full load of bombs. All fighter jets are returning safely. Iran's Fordow (nuclear facility) no longer exists.
2. Was willing to go to Turkey to negotiate with Iran in person - According to the AXIOS website, sources said that when Trump attended the G7 summit last Monday, Erdogan called and proposed to hold talks between US and Iranian officials in Istanbul the next day to explore diplomatic solutions to the war. Trump agreed, and he was willing to send Vice President Vance and White House envoy Vitkov, and even if necessary, he was willing to go in person. But it was later cancelled because Khamenei could not be contacted.
3. Threatening to strike Iran again if the conflict does not stop - According to Reuters, US President Trump said in a telephone interview that tonight was a stunning success and Iran should immediately achieve peace and stop the war, otherwise they will be hit again.
4. Saying that Iran will either usher in peace or fall into tragedy - Trump said that the US goal is to destroy Iran's nuclear enrichment capabilities and stop Iran's nuclear threat. Iran's facilities have been completely destroyed. Iran will either usher in peace or fall into tragedy. Many goals have not yet been achieved. Tonight's strike is the "toughest target". If peace is not achieved in the future, other targets will be accurately struck.
5. Warning Iran not to retaliate - Trump posted on social media: "Any retaliatory action by Iran against the United States will lead to a military response 'far beyond what we saw tonight.'"
6. US Democratic lawmakers call for Trump's impeachment - On the evening of June 21, local time, according to NBC, New York Democratic Congresswoman Alexandria Ocasio-Cortez said that President Trump's decision to attack Iran without the authorization of Congress "absolutely and clearly constitutes grounds for impeachment." She said that the US President's disastrous decision to bomb Iran without authorization was a serious violation of the Constitution and Congress' war powers.
📣Personal analysis:
Tensions in the Middle East escalate, and gold prices will continue to rise above 3400 at the beginning of next week
🔥 Technical:
Based on the resistance and support levels of gold prices on the 4-hour chart, Labaron identified the important key areas as follows:
Resistance: $3395, $3448
Support: $3302, $3255
⭐️ Note: Labaron hopes that traders can properly manage their funds
- Choose the number of lots that matches your funds
Precise short orders in 3370-3375 area are launched!Gold has been volatile recently, with intraday fluctuations ranging from 1 to 200 US dollars, which greatly increases the difficulty of operation for retail investors. On the surface, there are many opportunities, but there are only a few real big market opportunities. If you miss the rhythm, you can only watch your funds shrink. Remember that risk management is crucial.
From the 4-hour analysis of gold, there are repeated resistances from bulls before the downward break; once it breaks down, the market will go further down, and the focus below is 3340. The upper short-term is 3370-3380, and the important resistance is 3400. Only by breaking through the bulls can the rebound continue. In terms of operation, sell high and buy low, and pay attention to the breakthrough!
There are too many long orders accumulated at the current high level of gold, and the market will not rise sharply easily. The current international situation is so tense, and gold is still slowly declining. In this situation, it is difficult to rebound sharply.
Operational suggestions: For short orders above, focus on the layout of the 3370-3375 area, strictly set a stop loss, target more than 20 points, control risks, and follow the trend.
Gold XAUUSD Summer Price Action - Trading Psychology☀️ Summer Trading Blues? Here’s How to Stay Sharp Without Burning Out
Summer trading on Gold isn’t for the impulsive or the greedy. Liquidity dries up, sessions lose momentum, and the clean, aggressive price action we love? It goes on vacation too.
But that’s not a bad thing. It’s an opportunity.
This is the season where traders either burn out... or build.
Here’s how to keep your edge sharp while the markets slow down — and why a positive, focused mindset is your biggest asset until volatility returns.
Why Summer PA Feels “Off” on Gold
You’re not imagining it — gold price action does shift in the summer, and here’s why:
🏖️ Bank Holidays & Institutional Slowdowns
• Major global banks take scheduled breaks — including in the US, UK, EU, and Asia.
• Trading desks reduce activity, and high-volume players shift into passive management mode.
• This results in lower volume, fewer impulsive moves, and more algorithmic fakeouts.
📆 Official Holidays + "August Mode"
• US Independence Day (July 4), UK Summer Bank Holiday (late August), and more → NY and London sessions thin out or lack follow-through.
• Most institutional traders go on leave. Some desks run skeleton crews. No joke.
• Unless a major geopolitical catalyst (e.g. war escalation or surprise central bank move) hits the headlines, price will drift or trap.
🏄♂️ Retail Overreach & Emotional Traps & Vacation Time
• Retail traders often “force” trades in quiet markets to stay busy.
• This leads to chasing, overtrading, and emotional fatigue — the exact trap smart traders avoid.
• Most regular traders also go on vacation or scale back — unless they’re mentally obsessed with Gold and can’t let it go.
Bottom line:
Summer PA is slower, trickier, and full of emotional bait. Learn to read the stillness — not fight it.
💡 Your Summer Trading Mindset Kit
Instead of complaining about the range, use this time to train your mindset.
Here’s how:
⚖️ Stay Emotionally Neutral — Even When Price Isn’t
Summer markets bait your emotions: fake breakouts, slow reactions, and dead zones.
To stay in control, build structure around your execution:
✅ Pre-market: Make a clear plan with meaningful zones and set alerts — don’t wing it on hopes and dreams
✅ Post-market: Write down why you stayed out or why your trade was clean — not just wins or losses
Neutrality isn’t passive — it’s disciplined clarity, even when the chart’s doing nothing.
🎯 Focus Over FOMO
Short sessions. Laser focus. Clean execution.
→ Limit distractions
→ Trade only clear, structured setups
→ Respect no-trade days as productive days
Flow isn’t magic — it’s discipline + environment.
🤝 Find the Trading Circle That Matches Your Style — to reinforce your style
Not every group fits you — and not every voice deserves your attention.
Look for people who:
• Respect structure over noise
• Give thoughtful, honest feedback
• Celebrate patience and growth, not screenshots and bragging and 20-30 pips wins
A real trading circle matches your energy and raises your game — not your cortisol.
💭 Reconnect With Your “Why”
If you’re here just to “make money,” summer will test you hard.
Purpose anchors you when price doesn’t. Ask yourself:
• Why do I trade?
• Who am I becoming through this process?
No purpose = burnout.
Purpose = clarity, even in silence.
📈 Discipline Pays When Gold Doesn’t
Forget chasing fireworks in dead markets.
Summer rewards the trader who does less but does it right:
✅ You skipped noise? That’s a win.
✅ You waited for your zone? Pro-level move.
✅ You tracked your behavior? You’re not guessing — you’re evolving.
While others burn out chasing crumbs, you’re stacking discipline — and that’s what you’ll cash in when the real moves return.
Final Words: Quiet Traders Get Loud Later
Summer might be slow. But your growth doesn’t have to be.
While others force trades, smart traders sharpen edge.
You’re not falling behind by sitting out chop — you’re building mastery for when real money moves return.
🗓️ So in September YOU are going to show up: stronger, clearer, and 3x more prepared.
If this lesson helped you today and brought you more clarity:
Drop a 🚀 and follow us✅ for more published ideas.
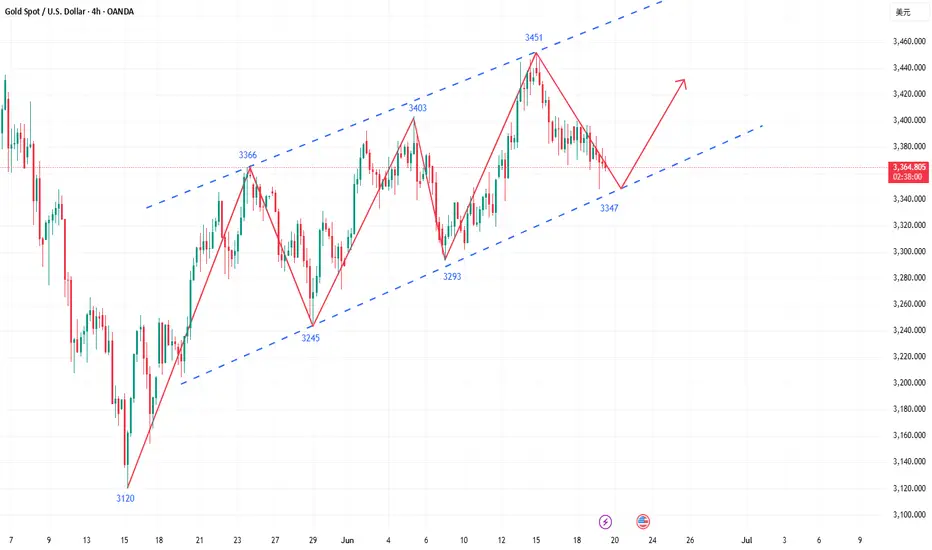
Gold (XAU/USD) 4-Hour Analysis- 20 June 2025On the 4-hour chart, gold has been trading in a fairly wide range.
The market has not clearly broken down, and many analysts see it as still structurally bullish as long as key support holds. Currently price is pulling back toward a confluence of support around $3,353–$3,355 (a zone overlapping a trendline and prior demand).
In other words, buyers have defended roughly the 3,340–3,355 area recently. Resistance lies just above in the $3,370–$3,380 region, with a major psychological pivot at $3,400. One analyst notes gold is “boxed between resistance at $3,450 and support at $3,340–$3,335”, so the immediate bias depends on these zones.
A clean break above 3,380–3,400 would signal bullish continuation (targeting 3,450+), while a drop below the 3,340–3,350 support zone would shift the bias bearish.
Overall, the market structure on H4 is mixed-to-bullish: we see higher swings in larger timeframes, and only a minor short-term down leg so far. As one analysis notes, gold remains “structurally bullish” and an upside break could chase the $3,500–$3,550 area.
Key Zones and Levels (4H)
Strong Support (Demand) Zone: ~$3,340–$3,355. This zone (around the recent swing lows) has attracted buying. Analysts mark $3,350–$3,355 as a key buy zone. Breaking below ~$3,340 would be a warning, putting 3,300 as the next floor.
Supply Zone / Resistance: ~$3,370–$3,380. This is the near-term resistance cluster (multiple analysts cite 3,370–3,380 as key). A rejection here would keep gold rangebound.
Major Pivot: $3,400. This round number is acting as an important hurdle. A decisive close above $3,400 would open the door to the $3,434–$3,450 area (prior highs). Conversely, failure at $3,400 can push price back toward the support zone.
Larger Resistances: If the uptrend resumes, look to ~$3,450 (April swing high) and beyond. Many long-range targets point to $3,500+ in a strong bull move.
Secondary Supports: Below the main support zone, watch ~$3,300 and down at $3,281 (the 50-day moving average). These act as deeper floors if weakness continues.
4-Hour Bias
In plain terms, as long as $3,340–$3,355 holds as support, the bias tilts bullish or neutral. We can say bullish bias above that zone: buyers will look to enter on pullbacks there. If price stays under $3,370, gains will likely be capped short-term. A break above $3,380/$3,400 would confirm a bullish breakout. On the flip side, a break below $3,340 shifts us to a bearish bias, with attention turning to lower support levels. On indicators, shorter-term momentum has eased (recent RSI is flattening around 60), suggesting some fatigue. But the longer-term trend is up, supported by strong safe-haven demand (central bank buying, geopolitical risk).
In summary: neutral-to-bullish on 4H, favor buyers near support but cautious near overhead supply.
Intraday (1H) Setups
Zooming into the 1-hour chart, we look for trades that align with the above bias. The clearest setups involve buying around demand zones and selling near supply areas:
Buy the Dip (~$3,344–$3,355): Wait for gold to dip into the 3,340–3,350 area. If you see a bullish price-action signal (e.g. a clear hammer or bullish engulfing candle), that’s a potential buy. Place a stop just below (~$3,335). Initial targets are around $3,370–$3,380 (near resistance). For example, one analysis suggests: “Buy XAU/USD at 3,344–3,348, TP 3,365–3,370, SL 3,335”.
Sell the Rally (~$3,375–$3,380): If price runs up to $3,375–$3,380 and shows signs of stalling (e.g. bearish candle), consider a short. Stop would be just above (~$3,385), with a target back down toward $3,355–$3,360 or the 1H demand zone. (One example from analysis: “Sell XAU/USD at 3,375–3,380, TP 3,355–3,360, SL 3,385”.) This aligns with fading the high of the range.
Breakout Strategy: If momentum is strong and gold breaks convincingly above ~$3,380–$3,400 on the 1H, one can enter long on the breakout. The next resistances are ~$3,434 and $3,450.
Stops should be very tight in that case (just under the breakout candle).
Risk Management: Keep position sizes small (1–2% risk). Use stops under/above the structural levels. Always wait for a clear 1H candle signal before pulling the trigger, to avoid false moves.
Key 1H levels: We can cite the strong short-term zones: support ~$3,344–$3,348 and resistance ~$3,375–$3,380.
If price skims these areas, watch carefully for a signal to buy or sell as described above. If 1H breaks below $3,340, be ready for a move toward the lower demand zone (around $3,335) or even $3,300–$3,280.
Takeaway
Gold is currently trading between ~$3,340 and $3,380 on the 4H chart. The simplest guidance is to trade the range: buy on dips near $3,340–$3,355 with stops just below, aiming for the $3,370–$3,380 area, and sell near $3,375–$3,380 if rallies stall. Maintain a bullish tilt as long as that $3,340+ support holds, but be ready to switch bearish if gold decisively closes under ~$3,340.
Single Takeaway: Treat ~$3,340–$3,355 as a key demand zone – a bounce here would be a high-probability long entry (targeting $3,370–$3,380), whereas a break below would turn the bias lower.
Gold continues to fluctuate, and range operations are effective!Gold opened high on Monday and then fell sharply. On Tuesday, it fluctuated and corrected with a cross-yang line. On Wednesday, the overall trend was also volatile. However, after the Fed's interest rate decision was announced on Wednesday, the price of gold fell to around 3362. The low point of this decline was just supported by the 10-day moving average. From a technical point of view, the support of the 10-day moving average at 3350 has become a key point. If this support can be effectively maintained, the gold price is expected to maintain a volatile pattern; once it breaks down, the short-selling force may continue, and then it will be necessary to look at the support of the 20-day moving average near 3350. In terms of upper resistance, the 5-day moving average is currently near 3390, which will suppress the upward movement of gold prices. Further resistance depends on the gains and losses of 3405.
There is not much change in the 4-hour chart. The lower track has not opened, and the support of 3360 is strong. It is still a bullish trend. However, it is worth noting that in the continuous rebound, the Bollinger middle track suppression point has not been broken. Relatively speaking, gold is weak and volatile in the medium term. Under the trend today, if it continues to rise, we must pay attention to the gains and losses of the dense suppression point 3405. If 3405 is broken, the trend strength will come out and we can see the high point of 3430. For intraday trading, we still maintain high-altitude and low-multiple, waiting for the trend strength to break through the space, and we are bullish above the support of 3350 during the day.
Gold operation strategy: It is recommended to short at the rebound of 3385-3390, with a target of 3370-3365; gold falls back to 3350-3355 and buys, with a target of 3375-3385;
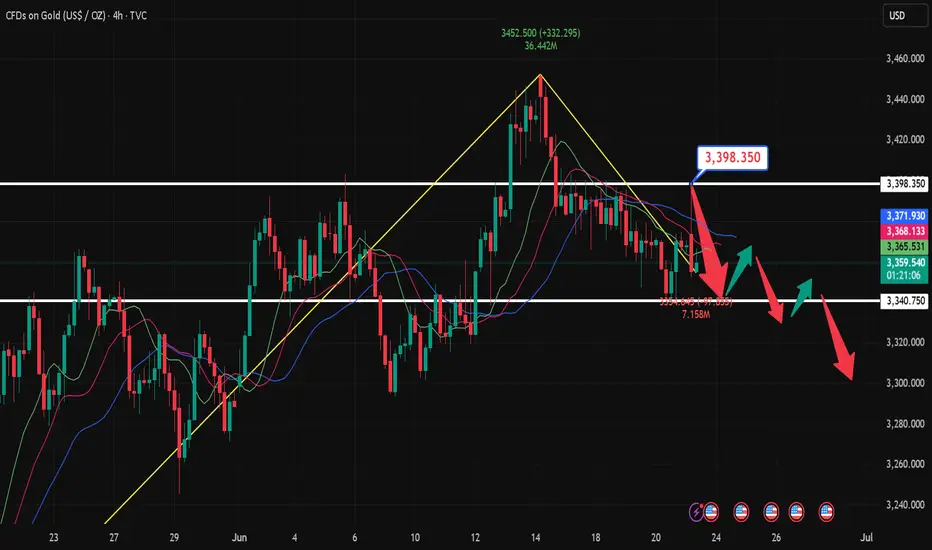
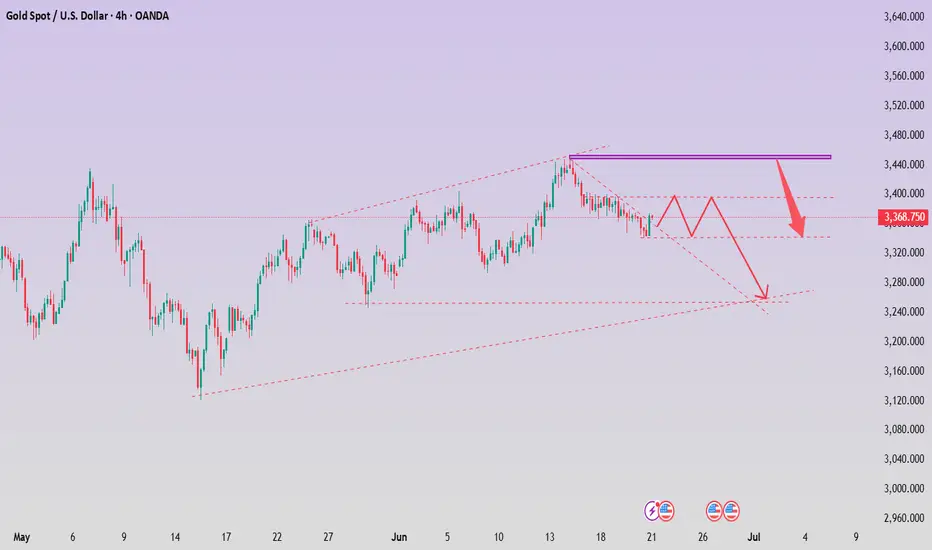
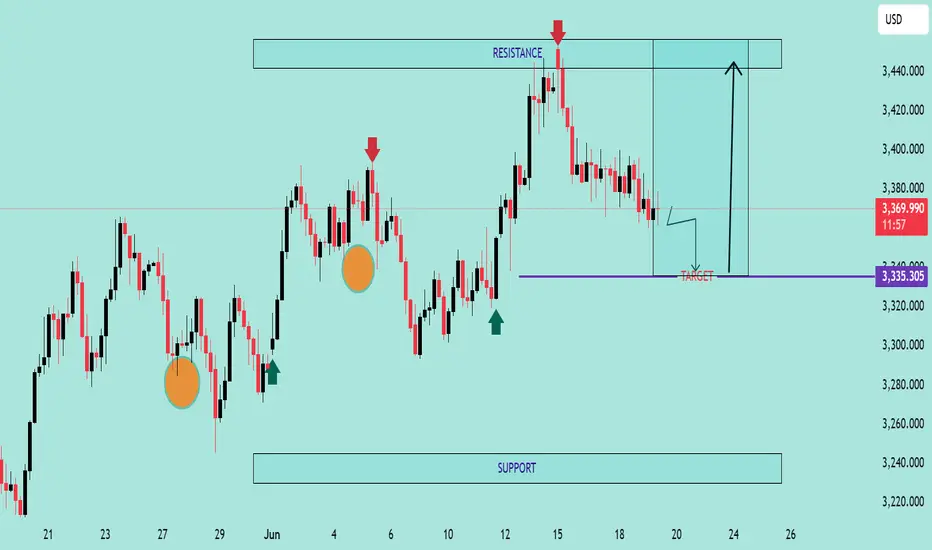
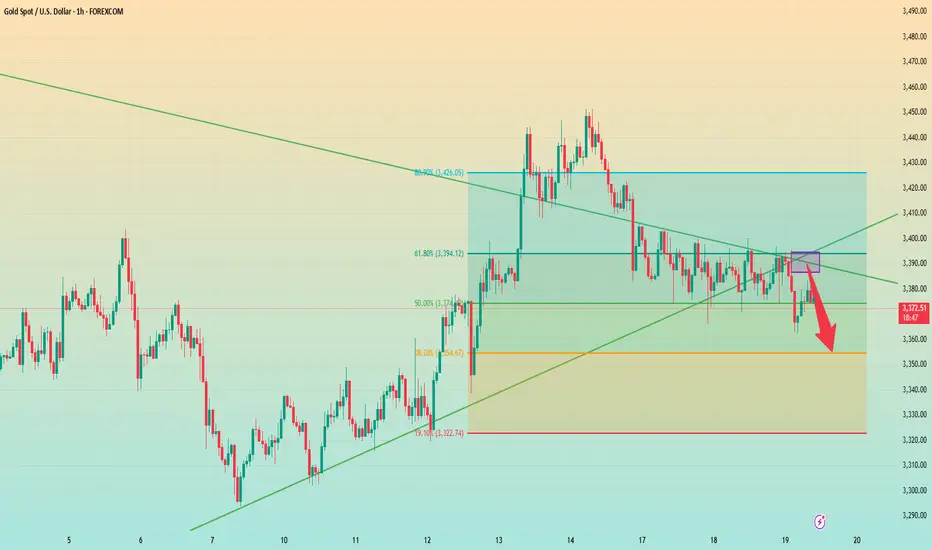
GOLD/USD Support Retest & Breakdown SetupGOLD/USD Support Retest & Breakdown Setup 📉🔍
🔹 Overview:
The chart indicates a potential bearish continuation pattern on GOLD/USD as the price is approaching a key support level at 3,335.305. Previous price action shows multiple rejections from the resistance zone (~3,435), followed by lower highs – a sign of weakening bullish momentum.
📊 Technical Analysis:
🔺 Resistance Zone (~3,435)
Multiple rejections (🔴 red arrows) indicate strong supply pressure.
Price has failed to break above this area thrice, forming a clear ceiling.
🔻 Support Zone (~3,335)
Marked as the target for a short setup.
Price is testing this level again after forming a minor consolidation below lower highs.
A clean break below this purple zone may trigger a continuation to the downside, targeting the broader support range below (~3,240).
🟠 Bearish Structure:
Series of lower highs (highlighted with circles).
Breakdown pattern is developing with declining bullish momentum.
📈 Potential Play:
A confirmed breakdown below 3,335 could lead to a drop toward the next major support.
If support holds, short-term bounce is possible but limited by the dominant resistance.
📌 Conclusion:
GOLD/USD is currently in a bearish setup, with the market eyeing a potential breakdown below a critical support zone. If this level fails to hold, we could see accelerated bearish momentum toward the lower support range.
💡 Caution: Wait for a confirmed close below support before entering any short trades.
XAU/USD 19 June 2025 Intraday AnalysisH4 Analysis:
-> Swing: Bullish.
-> Internal: Bullish.
Analysis and bias remains the same as analysis dated 23 April 2025
Price has now printed a bearish CHoCH according to my analysis yesterday.
Price is now trading within an established internal range.
Intraday Expectation:
Price to trade down to either discount of internal 50% EQ, or H4 demand zone before targeting weak internal high priced at 3,500.200.
Note:
The Federal Reserve’s sustained dovish stance, coupled with ongoing geopolitical uncertainties, is likely to prolong heightened volatility in the gold market. Given this elevated risk environment, traders should exercise caution and recalibrate risk management strategies to navigate potential price fluctuations effectively.
Additionally, gold pricing remains sensitive to broader macroeconomic developments, including policy decisions under President Trump. Shifts in geopolitical strategy and economic directives could further amplify uncertainty, contributing to market repricing dynamics.
H4 Chart:
M15 Analysis:
-> Swing: Bullish.
-> Internal: Bullish.
Following previous high, and printing of bearish CHoCH, price has pulled back to an M15 supply zone, where we are currently seeing a reaction. Therefore, I shall now confirm internal high.
Price is now trading within an established internal range.
The remainder of my analysis shall remain the same as analysis dated 13 June 2025, apart from target price.
As per my analysis dated 22 May 2025 whereby I mentioned price can be seen to be reacting at discount of 50% EQ on H4 timeframe, therefore, it is a viable alternative that price could potentially print a bullish iBOS on M15 timeframe despite internal structure being bearish.
Price has printed a bullish iBOS followed by a bearish CHoCH, which indicates, but does not confirm, bearish pullback phase initiation. I will however continue to monitor, with respect to depth of pullback.
Intraday Expectation:
Price to continue bearish, react at either M15 supply zone, or discount of 50% internal EQ before targeting weak internal high priced at 3,451.375.
Note:
Gold remains highly volatile amid the Federal Reserve's continued dovish stance, persistent and escalating geopolitical uncertainties. Traders should implement robust risk management strategies and remain vigilant, as price swings may become more pronounced in this elevated volatility environment.
Additionally, President Trump’s recent tariff announcements are expected to further amplify market turbulence, potentially triggering sharp price fluctuations and whipsaws.
M15 Chart:

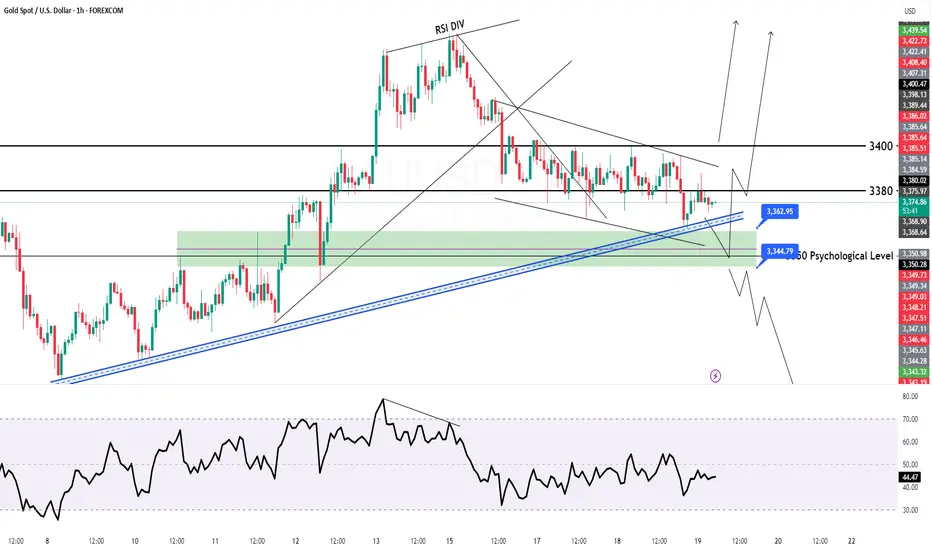
GOLD H1 Intraday Chart Update For 19 June 2025Hello Traders,
For today market still stuck in between 3350 to 3400 Psychological levels we still need to wait for clear breakout of 3400 level
Today scalping range is 3360-90 but remember must placing SL
if market goes below 3350 clearly then it will move towards 3321 Major Support level
Reminder: There is Bank Holiday in US
Disclaimer: Forex is Risky
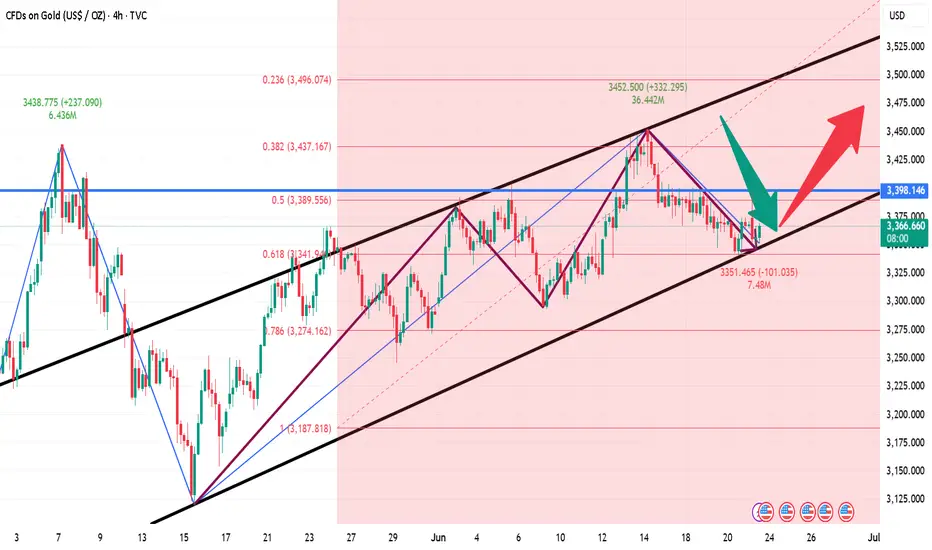
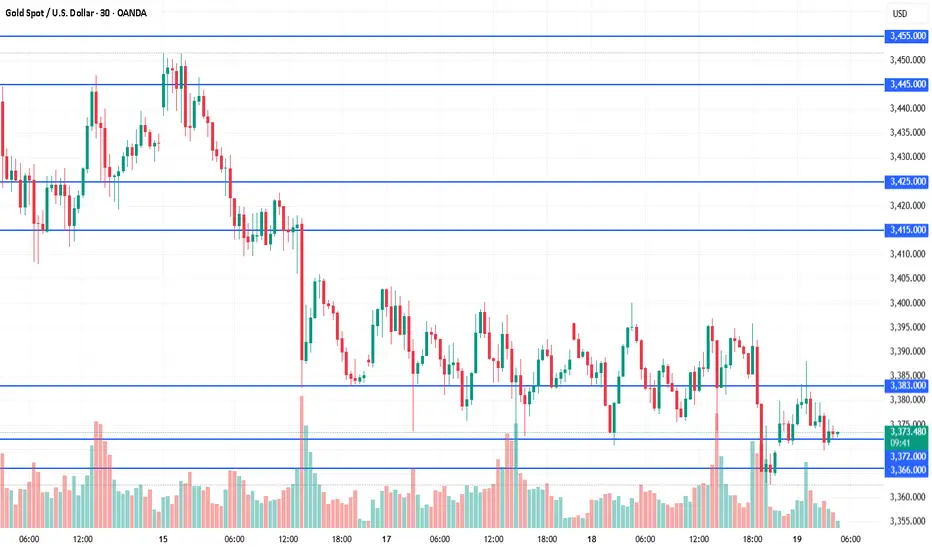
XAU/USD 4H Market Analysis- 19 June 2025XAU/USD 4H Market Analysis
Market Structure: Gold has been in a mild uptrend on the 4‑hour chart, making higher lows and highs since early June. The recent swing high was around ~$3,428 (mid-June), and price has pulled back toward the rising support line near ~$3,373.
A break above the recent high (around $3,404–$3,428) would continue the bull trend; conversely, a drop below the ~3,373 trendline/50% Fib level would signal a bearish turn.
In other words, bulls remain in control as long as ~$3,373 holds – breaking that would threaten lower support around ~$3,338.
Overall Bias: Moderately bullish on 4H. Gold is respecting its rising trendline and 50-period EMA, and analysts note that holding above ~$3,373 keeps the uptrend intact.
Momentum (MACD) is neutral to slightly bearish short-term, so we expect consolidations and range bounces more than a reversal.
In summary, assume an upward bias while price stays above key support near $3,370–$3,380; a firm break below would flip bearish.
Key SMC/Zones:
Price is currently in a range/consolidation roughly between $3,370 and $3,400.
Important zones include:
Demand (Support) Zone:
~ $3,368–$3,378 — this 50% Fib retracement area has been defended as a bullish order block.
Below that, stronger supports sit near ~ $3,354 and $3,333 .
Supply (Resistance) Zone:
~$3,395–$3,415 — a cluster of swing highs and Fib levels. Analysts highlight $3,395, $3,412, $3,435 and even $3,450 as major resistance barriers.
In particular, the $3,400 level is a known psychological and technical ceiling.
Trendlines/BOS: The rising 4H trendline (currently near $3,370–$3,380) is key support.
A break of structure (BOS) below that line would be a bearish Change-of-Character. Similarly, the prior swing low around $3,373 is a flip zone – bulls want to keep that hold.
Liquidity: Stop-loss/liquidation clusters may lie just above recent highs ($3,428–$3,450) and just below recent lows ($3,338–$3,354). For example, stops above $3,428 could fuel a rally if hit, and stops below $3,338 could accelerate a drop.
In short, high-probability zones on the 4H chart are around ~$3,370 (demand/support) and ~$3,400 (supply/resistance).
We’ll look for trades that align with that structure (see setups below).
1H Trade Setups (Aligned with 4H Bias)
Long around $3,370–3,375 (Buy Dip to Demand Zone) –
Entry: ~3,370–3,375 (green zone). Stop: ~$3,365 (≈$5 below zone). Take-Profit: $3,380 first, then $3,390–$3,400.
Reason: This zone is a 4H demand area (50% Fib + order block) and coincides with the rising 4H trendline.
Price has repeatedly bounced here, so a bullish reversal is likely.
Trigger: Look for a bullish 1H signal (e.g. engulfing or pin bar) at ~3,370–3,375, or a break of the short-term 1H down-structure.
Entry on such a signal would target a retest of the mid-range (~3,380) and beyond toward resistance.
Short around $3,395–3,400 (Sell Rally to Supply) –
Entry: ~3,395–3,400 (red zone). Stop: ~$3,405 (≈$5 above zone). Take-Profit: $3,375 first, then $3,365.
Reason: This area is a clear 4H supply zone (near multiple Fibonacci levels/resistance).
It’s just below the $3,400 psychological barrier. A failure or bearish reversal here would likely send price back toward the demand zone below.
Trigger: Watch for a bearish 1H candle or a break of the short-term 1H up-structure in the 3,395–3,400 range. A clear rejection (e.g. bearish engulfing or strong wick) would be the signal to enter short.
(Note: If price breaks cleanly above $3,405–3,410 instead, a bullish continuation trade would then be favored, targeting $3,415+.)
Takeaway: Trade gold with the 4H structure in mind. With price above the ~$3,370 trend support, favor longs on pullbacks into that demand zone and shorts only at proven supply near $3,400. Always use a tight ~$5 stop beyond each zone and scale out at logical pivot levels to manage risk.
Data is stable. Will the price go down?Information summary:
The Fed kept the benchmark interest rate unchanged at 4.25%-4.50%, and did not make a rate cut decision for four consecutive meetings, which was in line with market expectations. The Fed said that uncertainty about the outlook has eased, but it is still at a high level. The Fed lowered its GDP forecast for 2025 to 1.4%, while raising its inflation forecast to 3%.
The Fed kept interest rates unchanged, which may suggest that the pace of future rate cuts will slow down.
Market analysis:
From the current 4-hour chart:
The price has fallen below the key support level of 3380. If it returns to below 3370 again, it is very likely to reach today's low. The low point of the downward trend is at the extreme position of 3350-3330.
From the hourly chart, the downward range has also been broken. The early rebound in the Asian market also failed to stabilize above the support level. Then from the hourly Fibonacci, the 0.382 position below is around 3350.
Therefore, if it goes down, the first target is also around 3350.
Operation strategy:
Short around 3380, stop loss at 3390, profit range 3350-3330.
Accurate operation, both long and short gains!Gold has experienced a typical volatile market today, first rising to 3400 and then falling back to around 3380 as expected. The short order plan we arranged in advance was successfully closed, and we successfully took this wave of callback profits. What is more worth mentioning is that we also accurately entered the long order in the previous round of retracement and steadily harvested the rebound profits. The rhythm of long and short switching is smooth, the strategy is clear, and the execution is decisive - this is what trading should be like. The market is repetitive, and opportunities are always there. Whether you can put the profit steadily into your pocket depends not on how many times you are right, but on whether you can execute it at the key points.
At present, the trend of gold shows that although there is a rebound after each decline, the strength is generally weak and it has never been able to break through the 3405 suppression level. The overall situation is still in a range of fluctuations, and market sentiment is still waiting for further guidance from the Fed. Therefore, short-term operations are still based on key points, and the market rhythm is slow, requiring more patience. In the case of no break at present, continue today's thinking to operate, unless there are sharp fluctuations in the short term or sudden news or geopolitical situations, then make adjustments.
Gold operation suggestions: 1. Gold short orders: short near 3397-3405, target 3385-3375. 2. Gold long orders: long near 3375-3370, 3365-3360 can cover positions, target 3380-3390-3400.
If you still lack direction in gold trading, you might as well try to follow my pace. The strategy is open and transparent, and the execution logic is clear and definite, which may bring new breakthroughs to your trading. The real value does not rely on verbal promises, but is verified by the market and time.

Data is about to be released. Will it affect the trend of gold?Information summary:
The Federal Reserve is about to announce the latest interest rate decision, and the market generally expects it to maintain the policy interest rate range of 4.25%-4.50% unchanged. Trump recently asked the Federal Reserve to cut interest rates by one percentage point immediately. However, the market reacted cautiously to this, believing that a sharp interest rate cut may increase inflation risks, especially in the context of Middle East conflicts pushing up oil prices.
Fed Chairman Powell's statement at the press conference will become the focus of market attention. The market expects the Fed to maintain a "cautious and patient" tone, and the guidance on the interest rate outlook may be vague.
Market analysis:
Technical indicators, from the daily chart, the support level is near the 10-day moving average and the 20-day moving average, and the 3365-3345 range forms an important support. In terms of resistance, yesterday's high near 3405 constitutes a key resistance above. If the price wants to reverse the current weak pattern, it needs to break through this resistance level strongly to open up the upward space.
From the 1-hour chart, the price started to fall after reaching a high point, and maintained stability in the upper and lower ranges; it is now close to the low point in the early trading, and the trend is relatively slow.
In the absence of an upward or downward breakthrough, we still follow the strategy of selling high and buying low.
Short around 3400, stop loss 3410, profit range 3380-3365;
Long around 3365 when the price falls back, stop loss 3355, profit range 3380-3400.