GOLD/USD Bullish Breakout PotentialGOLD/USD Bullish Breakout Potential 🚀📈
🔍 Chart Analysis (June 15, 2025):
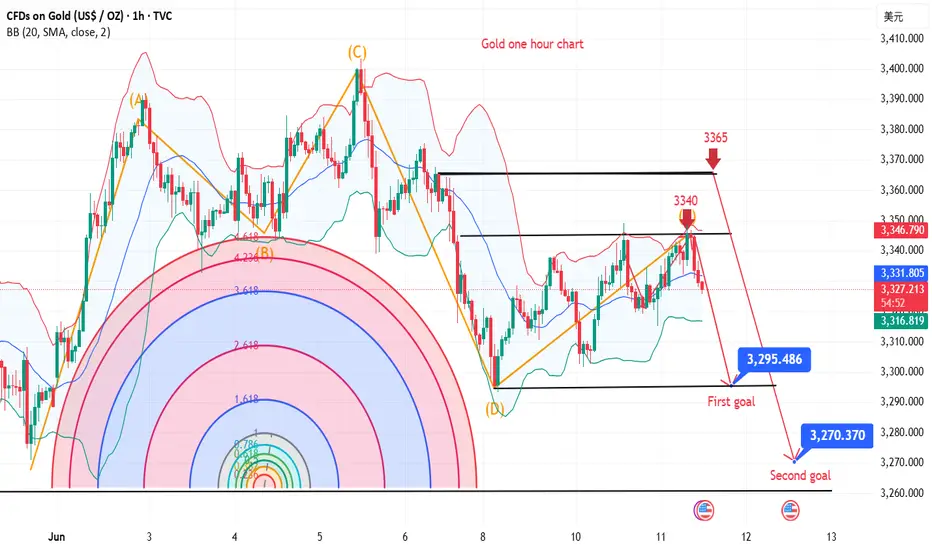
The GOLD/USD price action shows strong bullish momentum after a successful breakout above the previous resistance zone (now turned support) around $3,400. This level had previously acted as a key resistance multiple times (evidenced by the price rejection in early June), but has now been flipped into a support zone. The chart highlights two major elements:
📌 Key Highlights:
✅ Support Zone:
The $3,390–$3,410 range is now a confirmed support area after price broke above and retested it. This zone was previously tested multiple times (marked by arrows) and is expected to act as a launchpad for further upside.
🎯 Target Point:
The projected bullish target lies in the $3,610–$3,640 range. This level has been highlighted as a potential area where price might face resistance again.
📈 Bullish Projection:
A bullish continuation is expected if the price remains above the $3,400 level. The chart suggests a possible pullback to support before continuation towards the target zone.
⚠️ Technical Outlook:
As long as price holds above support, the bias remains bullish.
A drop below $3,390 would invalidate this bullish scenario and call for reassessment.
Conservative entry may wait for a confirmed bounce from support.
🔮 Summary:
Bullish bias is active for GOLD/USD with a short-term target around $3,620. Watch the $3,400 support closely for confirmation of the upward momentum.
Goldpriceaction
Adjustment over? Uptrend coming?Information summary:
A new round of air strikes by Israel against Iran on Friday has significantly escalated the conflict in the Middle East. Investors have quickly poured into traditional safe-haven assets such as gold, U.S. Treasuries and the Japanese yen. The market's current first choice for hedging geopolitical risks is gold, not the U.S. dollar. The U.S. dollar index rebounded slightly this week, but it has not become the main target of safe-haven fund flows, and gold has dominated the flow of safe-haven funds.
Although risk aversion has become the main theme of the gold market this week, the Fed's policy trends are still the core variable affecting the long-term direction of gold prices. In this week's FOMC meeting, the Fed kept interest rates unchanged and hinted that it may only cut interest rates once this year. But Powell also pointed out that future policies will still depend on data, leaving speculation about reversals.
Market traders generally believe that if the future inflation data falls more than expected or the job market slows down, the Fed's stance may turn dovish again, and gold prices may therefore gain new upward momentum.
Trend analysis for next week:
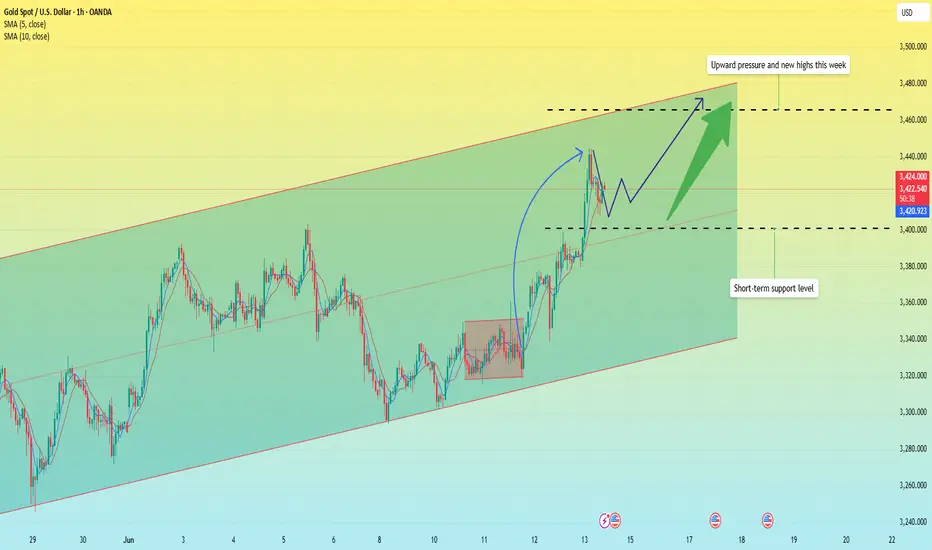
The weekly bullish trend extends, and there is still a lot of room for growth. After a round of decline last week, the weekly line closed this week again in a very strong position, and the daily rising trend channel resumed its operation. From the market alone, the gold price trend has been stabilizing above the middle track, and the bulls continued to line up at the opening of Monday. From the indicators, the middle track has been extending upward. Since May, the price has continued to create highs in the rising channel and has a tendency to challenge the historical high position of 3500, indicating that there is still room for upward movement in the short term.
From the 1-hour chart, the price rose to 3447 and then made a short-term correction to 3420, and the correction has been sufficient. 3420-3415 forms the most important support area. If this position is touched, it is an opportunity for long trading; but the price may not fall back to the support line and rise directly. Before breaking the important neckline, no short strategy will be adopted at the beginning of next week. We can patiently wait for the opportunity to go long after the correction.
Operation strategy:
Buy at 3415-3420, stop loss at 3410, profit range at 3450-3455.

4-Hour Analysis for XAUUSD (14 June 2025)4-Hour Analysis: The Bigger Picture
Price Action & Market Structure
Current price is at $3432.835.
The market has printed a higher high above the previous swing at ~$3425.
Last Break of Structure (BOS): Occurred to the upside at ~$3412.
Recent CHoCH (Change of Character): None yet to the downside—bullish structure still intact.
Conclusion: Bullish Market Structure is dominant.
Fibonacci Levels
Measured from the swing low at $3362 to the recent swing high at $3437:
38.2% retracement: ~$3410
50% retracement: ~$3399
61.8% retracement: ~$3388
These are our retracement zones where demand is likely to step in.
Smart Money Key Concepts
Imbalance: Clean imbalance exists between $3408–$3415.
Bullish Order Block (OB): 4H candle at $3394–$3402
Liquidity Grab: Sweep below $3411 (old low) before reversal signals smart money accumulation.
Premium/Discount Zone: Current price is above 50% of last impulse → In premium zone (better to look for sells here until retracement).
Key Zones (Interaction Points)
Buy Zone Cluster (Discount Price)
Zone A (OB + 61.8% + Liquidity Pool) → $3385–$3402
Zone B (Imbalance + Fib 50%) → $3408–$3415
Sell Zone Cluster (Premium Price) – for retracements
Zone C (Last Supply + Swing Highs) → $3437–$3445
Zone D (Rejection Block + Liquidity Above) → $3455–$3462
4-Hour Bias: Bullish
We are in a bullish continuation phase. Ideal trades are buys from demand zones, aiming for new highs or liquidity sweeps above swing points.
Zoom-In: 1-Hour Chart – Trade Setups
Setup 1: Buy from Demand + OB Reaction
Entry Zone: $3394–$3402
Direction: Buy
Stop-Loss: $3384
Take Profit 1: $3430
Take Profit 2: $3445
Trigger Condition: Bullish engulfing or bullish BOS on 15-min chart after liquidity grab into the zone.
Reason: Overlap of OB, 61.8% fib, and clean liquidity pool below $3400.
Setup 2: Buy from Imbalance Tap
Entry Zone: $3408–$3415
Direction: Buy
Stop-Loss: $3398
Take Profit 1: $3432
Take Profit 2: $3440
Trigger Condition: CHoCH on 15m with FVG fill (imbalance closes with bullish follow-through).
Reason: Bullish continuation with low-risk entry within imbalance zone and close to 50% fib retracement.
Setup 3: Short from Supply Zone for Retracement
Entry Zone: $3455–$3462
Direction: Sell
Stop-Loss: $3472
Take Profit 1: $3432
Take Profit 2: $3415
Trigger Condition: Bearish engulfing or 1H CHoCH inside the zone.
Reason: Price likely to grab liquidity above highs before retracing; this is a countertrend scalp within premium pricing.
Final Takeaway:
“Stay bullish on Gold while it’s above $3394—but let price correct into demand before looking to join the trend.”
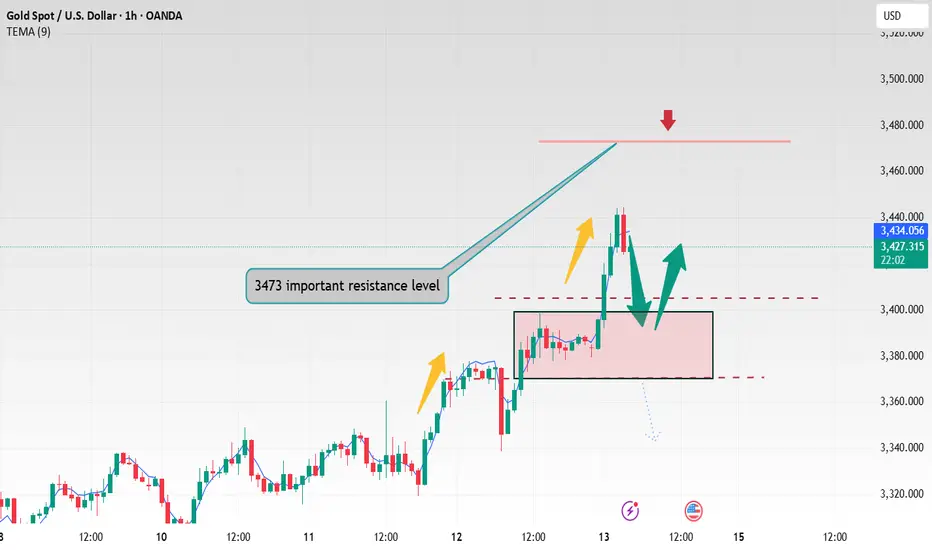
Hit the target with one strike! Gold perfectly cashed in 3435Gold closed sideways at a high level yesterday, and closed positive again overnight. It opened back to 3379 and pulled up strongly, breaking through the 3400 mark and then increasing in volume. The recent low-multiple bullish ideas have been realized. There is no doubt that it will continue to be bullish and long today. The market has turned from the previous sweeping upward to a strong unilateral trend. The upper side will first look at the previous high pressure of 3435. Continued breakthrough will further open up the upper space, or it will hit 3500 or even a new high again. The lower support focuses on the top and bottom conversion position of 3395-3405, and then pay attention to the 1H cycle support near 3410. The intraday operation is mainly long on the decline.
Operation suggestion: Go long on gold when it falls back to 3395-3345, and look at 3434 and 3450. If it is strong, continue to go long with the support of 3415-3410.
When operating, be sure to strictly set stop loss, strictly control risks, and respond to market fluctuations steadily.
The situation escalates, and gold rises again.Information summary:
Israel issued a statement: The attack on Iran has been completed. All Israeli Air Force pilots and crew members who participated in the attack on Iran returned to the base unscathed.
Iran issued a statement: The attack could not have happened without the coordination and permission of the United States. The United States is responsible for the consequences of the Israeli air strikes.
The unpredictable international situation has caused the price of gold to continue to rise after retreating.
New forecast:
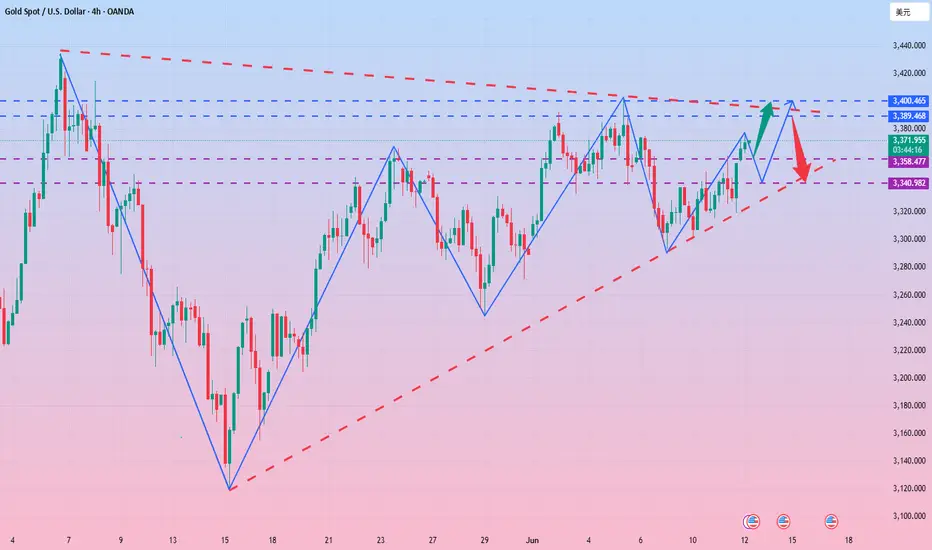
After a strong rebound in the 3338 shock area and forming a high point, it is currently in a clear upward channel. The recent breakthrough of the 3398.4 area indicates that the trend will continue and point to the resistance line near 3465. At present, the price is testing the trend line that broke above, which may become a springboard for the next round of rise.
Buy trigger point: rebound from near 3405, with strong trading volume.
Risk attention:
The possibility of triggering a false breakout trap near 3440.
If gold loses the 3380-point trend line, its momentum may stagnate.
Broader macro data could overtake technical support near resistance levels.
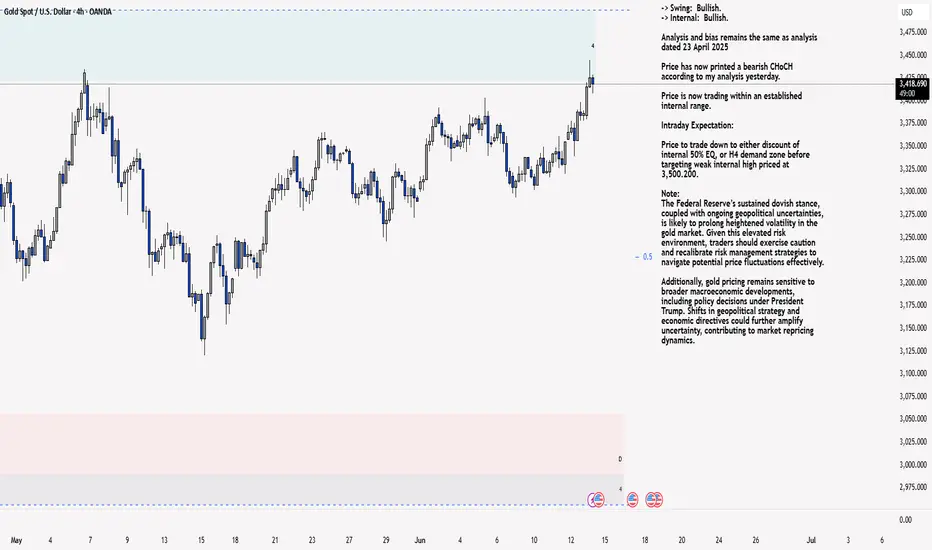
XAU/USD 13 June 2025 Intraday AnalysisH4 Analysis:
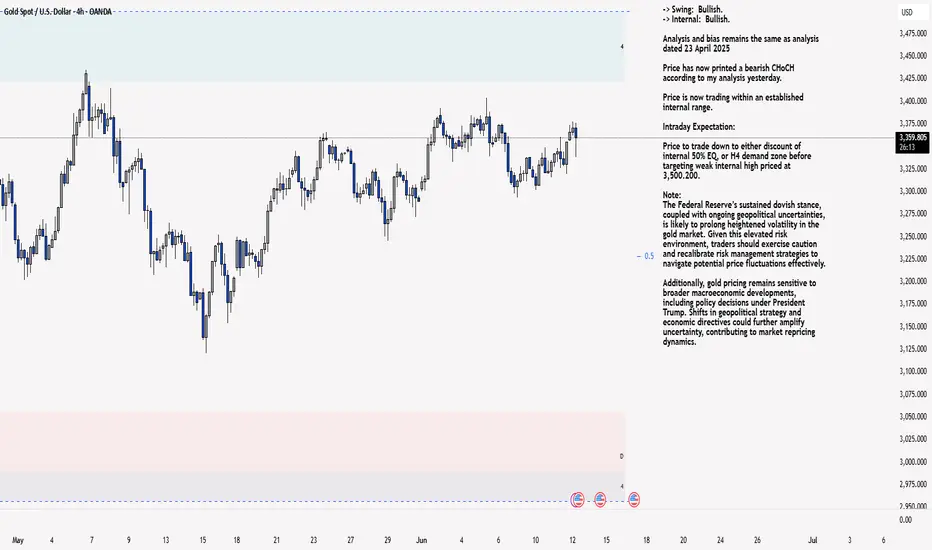
-> Swing: Bullish.
-> Internal: Bullish.
Analysis and bias remains the same as analysis dated 23 April 2025
Price has now printed a bearish CHoCH according to my analysis yesterday.
Price is now trading within an established internal range.
Intraday Expectation:
Price to trade down to either discount of internal 50% EQ, or H4 demand zone before targeting weak internal high priced at 3,500.200.
Note:
The Federal Reserve’s sustained dovish stance, coupled with ongoing geopolitical uncertainties, is likely to prolong heightened volatility in the gold market. Given this elevated risk environment, traders should exercise caution and recalibrate risk management strategies to navigate potential price fluctuations effectively.
Additionally, gold pricing remains sensitive to broader macroeconomic developments, including policy decisions under President Trump. Shifts in geopolitical strategy and economic directives could further amplify uncertainty, contributing to market repricing dynamics.
H4 Chart:
M15 Analysis:
-> Swing: Bullish.
-> Internal: Bullish.
As per my analysis dated 22 May 2025 whereby I mentioned price can be seen to be reacting at discount of 50% EQ on H4 timeframe, therefore, it is a viable alternative that price could potentially print a bullish iBOS on M15 timeframe despite internal structure being bearish.
Price has printed a bullish iBOS followed by a bearish CHoCH, which indicates, but does not confirm, bearish pullback phase initiation. I will however continue to monitor, with respect to depth of pullback.
Intraday Expectation:
Price to continue bearish, react at either M15 supply zone, or discount of 50% internal EQ before targeting weak internal high priced at 3,444.495.
Note:
Gold remains highly volatile amid the Federal Reserve's continued dovish stance, persistent and escalating geopolitical uncertainties. Traders should implement robust risk management strategies and remain vigilant, as price swings may become more pronounced in this elevated volatility environment.
Additionally, President Trump’s recent tariff announcements are expected to further amplify market turbulence, potentially triggering sharp price fluctuations and whipsaws.
M15 Chart:
Israel attacks Iran, gold soars
⭐️Gold information:
Israel attacks Iran's capital Tehran! Gold and crude oil soar rapidly!
The Middle East bully attacks Iran, and the risk aversion sentiment affects the early trading of gold at 3380. 30 US dollars
⭐️Personal comments:
Due to the escalation of geopolitical tensions in the Middle East, market risk sentiment has slightly rebounded, and investors are more inclined to buy traditional safe-haven assets-gold
Moving towards 3480
⭐️Set gold price:
🔥Sell gold area: 3478-3480 SL 3485
TP1: $3462
TP2: $3450
TP3: $3435
🔥Buy gold area: $3375-$3377 SL $3370
TP1: $3389
TP2: $3400
TP3: $3412
Geopolitical tensions, gold prices may reach 3480 points⭐️Personal comments:
Due to the escalation of geopolitical tensions in the Middle East, market risk sentiment has slightly rebounded, and investors are more inclined to buy traditional safe-haven assets-gold
Moving towards 3480
⭐️Set gold price:
🔥Sell gold area: 3478-3480 SL 3485
TP1: $3462
TP2: $3450
TP3: $3435
🔥Buy gold area: $3375-$3377 SL $3370
TP1: $3389
TP2: $3400
TP3: $3412

Israel attacks Iran, gold price correction can be long gold
📣Gold news
Today, Israel launched an attack on Iran, and the gold price reached a high of $3,433/ounce, the highest level since May 6, and the weekly increase exceeded 3.6%, the highest level since the week of May 19.
Spot gold continued to rise during the US trading session on Thursday, reaching a weekly high of $3,398.55/ounce. However, in the afternoon of the same day, the Chinese Ministry of Commerce stated that China and the United States reached a principled agreement on implementing the consensus of the heads of state call and consolidating the results of the Geneva talks, and made new progress in resolving each other's economic and trade concerns. Affected by the easing of the Sino-US trade situation, the safe-haven demand for gold dropped sharply, and the price fell rapidly by $30 from the high, reaching a low of $3,338/ounce. The market risk appetite has rebounded significantly, and the risk aversion sentiment has cooled significantly. Combined with the fact that the monthly and annual rates of the US CPI released in the evening were both lower than expected, indicating that inflationary pressure has not intensified. After the data was released, the market's expectations for the Fed to cut interest rates by 50 basis points before the end of the year have further increased.
📊Technical analysis:
Technically, the upper track of the daily line is still in a flat state. The current market has reached a high of around 3444. After the rise on Thursday, it is expected that there will be little room above. Since the market is in a volatile rise, it is not suitable to directly chase the rise. The 4-hour Bollinger band continues to diverge upward, and the moving average is arranged in a bullish pattern, indicating that the current market is in a strong position. If it breaks high on Thursday, there will be a chance of rising on Friday. In terms of operation, keep the idea of calling back and going long. If it falls below 3367 again, there will be repeated fluctuations.
Today's operation strategy💰
If the gold price falls back to around 3375, go long. If it is around 3370 and 3365, add more. Stop loss at 3360. Target 3420-3430
Sell short near 3430. Add shorts in batches near 3430 and 3435. Stop loss at 3440. Target 3380-3374
(If you have just entered the market, the gold market is confusing. The operation direction is always reversed. The entry price is not sure. The position is trapped. You can contact Labaron to get the gold price trend analysis And online guidance for unwinding! )
There is no unsuccessful investment, only unsuccessful operation. We have been deeply involved in the industry for more than ten years, with rich practical operation experience and unique trading concepts. We have a global and stable trading system here. We have studied gold, crude oil and other investment fields for many years, with a solid theoretical foundation and practical experience. We are good at combining technical and news operations, focusing on fund management and risk control, and have a stable and decisive operation style. We are recognized by the majority of investment friends for our easy-going and responsible personality and sharp and decisive operations. The analysis article only describes the possible future of the market and expresses opinions. It is not used as a basis for investment decisions. Investment is risky. Trading may not pay attention to reasonable position allocation, fund management and risk control. Do not trade without risk control. Don't let the transaction get out of control.
The situation escalates. Will the price of gold continue to riseEvent summary:
On June 13, Israel launched an air operation codenamed "Lion Rising" against Iran. So far, five rounds of air strikes have been launched.
As the situation in the Middle East escalates, gold has risen again due to risk aversion, directly breaking through 3,400. Gold risk aversion has increased, and there is no sign of easing for the time being, so gold risk aversion continues to rise, and gold prices are expected to continue to rise. Under the blessing of risk aversion, gold bulls have begun to dominate again.
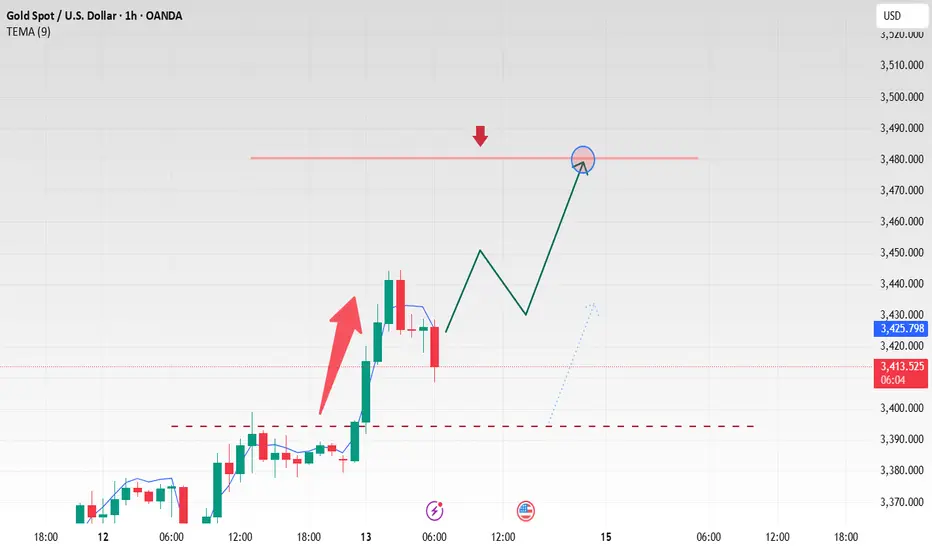
Market analysis:
The 1-hour moving average of gold has formed a golden cross and formed an upward trend. The upward momentum of gold is getting stronger and stronger. In the early Asian session, it once surged above $3,440, only $60 away from the historical high of 3,500. The outbreak of risk aversion is entirely the release of accumulated kinetic energy. Only when it is fully released can the strength of gold bulls weaken. The decline of gold means going long. If the price of gold falls back to the support level near 3,400 during the Asian session, buy on dips.
Focus position:
First support level: 3405, second support level: 3390, third support level: 3380
First resistance level: 3440, second resistance level: 3450, third resistance level: 3470
Operation strategy:
Long strategy: Buy near 3405, stop loss: 3395, profit range: 3430-3450;
Short strategy: Buy near 3455, stop loss: 3465, profit range: 3400-3380;
If you want to trade aggressively, you can buy at the current price and wait for the price to reach a high point near 3350.

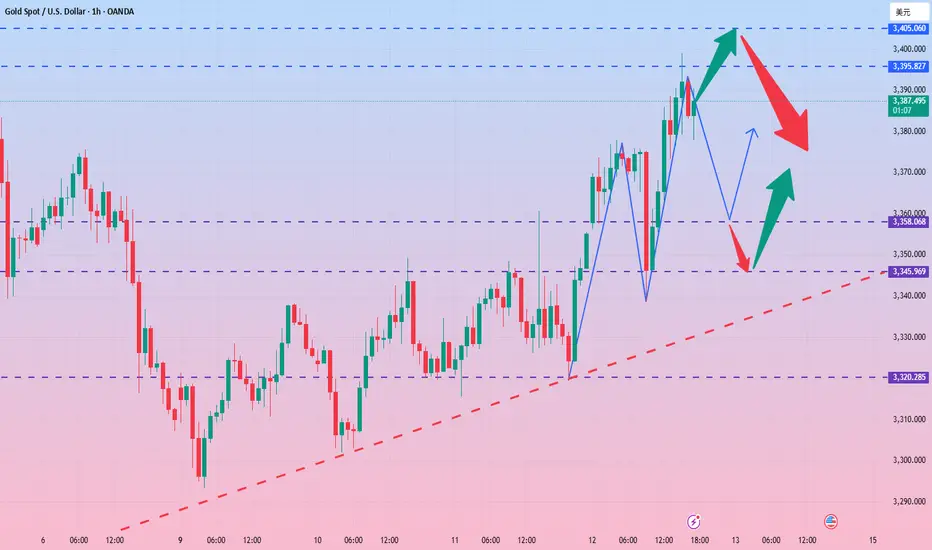
Accurately capture golden trading opportunitiesBased on the current trend, it is recommended to focus on low-long operations, but be wary of the market repeating the pattern of the previous few days of high-rush, wash-out and fall. From the perspective of key points, 3360 has been converted from a previous resistance level to a support level. At the same time, the hourly line forms an important support near 3358. If there is a stabilization signal at this position, it can be regarded as a good opportunity to go long. However, if the market falls below the 3356 line, it is not ruled out that the price will further fall to around 3345. This position is the key long-short watershed during the day. Once it is lost, the short-selling force may increase; in extreme cases, if there is a deep wash-out, the gold price may even pull back to 3325. For the upper resistance, pay attention to 3395-3405 first. If it can break strongly, it can further look to 3414.
Based on the above analysis, the trading strategy is as follows:
If gold falls back to the area near 3345-3355 and does not break, you can consider arranging long orders;
When the price rises to the area near 3395-3405 and does not break, you can try to arrange short orders.
When operating, be sure to strictly set stop losses and control risks.
Today's market trend is completely in line with the predicted rhythm, with a clear shock structure and flexible response around key points. With precise layout based on two-way thinking, we can achieve a double kill of long and short positions and a steady harvest. If your current gold operation is not ideal, and we hope to help you avoid detours in your investment, please feel free to communicate with us!
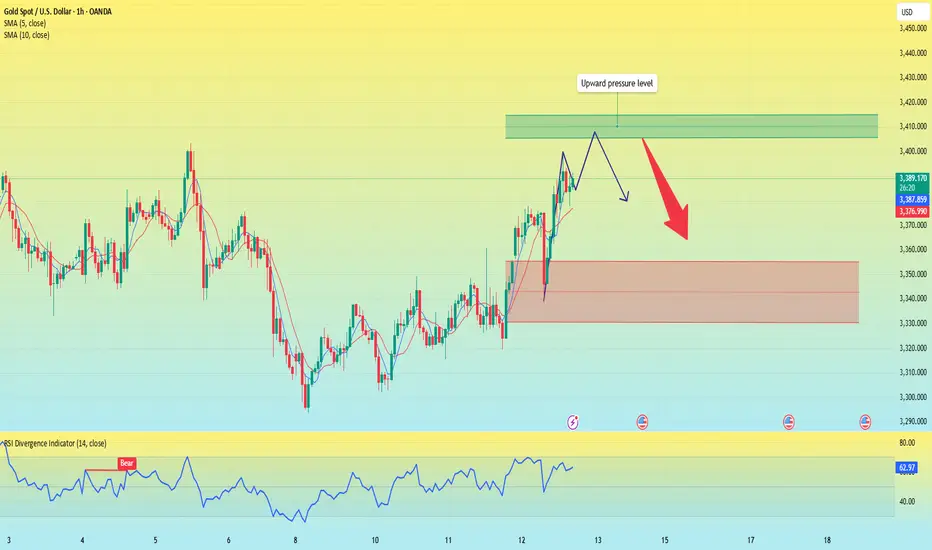
Gold is rising, will there be a new intraday high?Yesterday, gold closed with an engulfing positive line, and the closing line stood above the 5-day and 10-day moving averages.
From the analysis of gold in 1 hour, the current price is still in a fluctuating upward channel. Based on this technical pattern feature, if the subsequent economic data is positive and pushes the gold price to further strengthen, it may form a trading opportunity for shorting at a staged high. Although the gold price showed a rapid upward trend after the data was released, there has been obvious resistance in the historical trading concentration range of 3400-3410. The current bullish momentum has no technical conditions to break through this position, and the technical correction after the price surge is in line with the price behavior logic.
The current price has reached a high of around 3398. After today's rise, there is not much room for upward movement; since the market is rising in a volatile manner this week, it is not suitable to chase the rise directly. Although the 4-hour Bollinger Band opening continues to diverge upward and the moving average is arranged in a bullish pattern, the upward momentum is slightly insufficient and may be under pressure to move downward near 3410. I suggest that all traders short at high levels.
Operation strategy:
Short around 3410, stop loss at 3420, profit range 3360-3355. If it breaks through 3355, it may hit the intraday low below 3340.
Gold rose as expected, how to operate after the bulls hit 3400
📌 Gold News
Spot gold prices rose sharply. Analysts pointed out that the US CPI was lower than expected across the board, which hit the US dollar and US bond yields. In addition, tensions in the Middle East escalated, which triggered safe-haven buying of gold
📊Comment Analysis
Middle East issues, and information about high tariffs on countries without trade agreements. Gold prices have rebounded, but there is no long-term stability.
💰Strategy Package
🔥Sell Gold Zone: 3428-3430 SL 3435
TP1: $3410
TP2: $3395
TP3: $3387
🔥Buy Gold Zone: $3345-$3343 SL $3338
TP1: $3365
TP2: $3377
TP3: $3390
⭐️ Note: Labaron hopes that traders can properly manage their funds
- Choose the number of lots that matches your funds

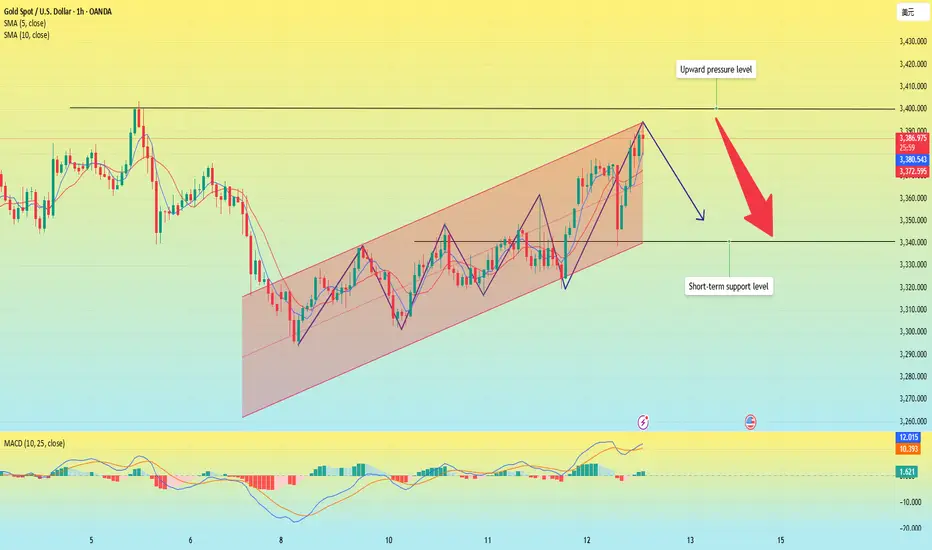
Gold is rising, beware of a pullback.Since last Friday, the daily line has shown an alternating trend of yin and yang. In the three trading days this week, the lows and highs have been rising continuously, which shows that the short-term trend is strong. Today's intraday trend also illustrates this point. At present, gold has risen directly to the 3388 line, directly refreshing the intraday high again.
From the hourly chart, we must be careful of the possibility of gold diving. From the previous rules, each rise is about 45 US dollars. This time it also started from 3340-3345, and the increase was close to 45 US dollars. Moreover, each time the rise is completed, the dive callback is 35 US dollars. Therefore, once it starts to fall from 3385-3390, it is very likely to reach 3350-3355.
In terms of short-term resistance, pay attention to the 3400 pressure level above; the support level is around 3340. the support level pays attention to the vicinity of 3340.
Operation strategy:
Short at 3385, stop loss at 3395, and profit range is 3360-3350.
XAU/USD 4H Updated Technical Analysis 06/12/20254H Market Structure & Trend
Gold (XAU/USD) is trading around $3,383, showing a generally bullish market structure on the 4-hour chart. The price has been making higher highs (HH) and higher lows (HL) – a classic uptrend pattern
Recently, bulls broke above a notable resistance level (a Break of Structure, or BOS), confirming continued upside momentum
So far no Change of Character (CHOCH) signal (which would require a lower low to hint at a trend reversal, meaning the uptrend remains intact. Gold is also trading above its daily pivot point (3370), reflecting a bullish intraday bias
Overall, sentiment on the 4H timeframe is positive unless key support levels give way.
Key Support & Resistance Zones (Demand vs. Supply)
Support (Demand Zones): Immediate support lies in the 3355 – 3340 region (marked by S1 and S2). This zone lines up with prior price congestion and is viewed as a demand zone, where buyers have historically stepped in
In fact, multiple support levels cluster here (e.g. previous lows and trendline intersection), creating a broad buy zone. The idea is that as price dips into this area, buy orders are likely waiting, and the deeper it goes into the zone, the more attractive it becomes for bulls
If 3340 fails, the next support is around 3325 (S3), another potential demand area where gold found a footing earlier. Traders will watch these support zones for bullish reversal signals (like a strong bounce or candlestick patterns) to confirm that demand is indeed active. Resistance (Supply Zones): On the upside, initial resistance is seen at 3385 (R1), with a stronger supply zone around 3400 (roughly the R2 3402 level). Here, multiple technical levels overlap – including a recent swing high and a psychological round number. This convergence of resistances creates a supply zone where sellers may be waiting.
As gold approaches 3385–3402, it’s likely to encounter profit-taking or new short positions. If price does punch through 3400, the next resistance is around 3415 (R3), which could attract even more selling interest. Within the 3385–3415 zone, expect price to possibly stall or reverse, unless bulls muster a strong breakout. Traders should be cautious about bullish positions as price nears this supply area, and watch for any bearish reversal clues (like wicks or a double-top) indicating that sellers are active
Fibonacci Retracement Confluence
Recent price swings show Fibonacci retracement levels aligning with the above zones, adding confidence to those areas. For instance, the rally from the last 4H swing low (around 3325) up to the recent high (~3385) has a 50%–61.8% Fibonacci retracement roughly in the 3340–3355 range. Fibonacci levels often pinpoint where price might stall or reverse during a pullback, and indeed this $3,340-$3,355 support zone corresponds to the popular 50%–61.8% retracement band – a prime spot where bargain-hunting buyers could step in.
In an uptrend, a pullback to these Fib levels is considered a healthy correction rather than a trend change. Thus, if gold dips to that area, many bulls will be watching for a bounce. On the flip side, if gold extends higher, Fibonacci extension levels suggest the 3400+ region might be a measured move target (for example, 100% extension of the last pullback lands near 3400). This reinforces that the 3385–3415 supply zone is a critical hurdle. In summary, Fibonacci analysis supports the idea that mid-$3300s is a value zone for buyers, while around $3400 is a potential exhaustion area for the current upswing.
Smart Money Concepts (SMC) Insights
From a Smart Money Concepts perspective, institutional footprints are visible on the chart. The ongoing bullish structure (higher lows, no lower low yet) means no CHOCH (trend change) has occurred
Smart money likely continues to favor longs until a key low breaks. We can identify a possible bullish Order Block in the 3340 area, which is essentially the last small bearish candle on 4H before the strong push up
This order block (an institutional buy zone) overlaps with our demand zone, suggesting big players placed buy orders around 3340. If price revisits that zone, it could ignite another rally as those orders get filled. There are also liquidity considerations in play: Above $3,400, there may be clusters of buy stop orders (from breakout traders or short stops) – what SMC traders call buy-side liquidity.
It wouldn’t be surprising to see gold spike above 3400 to grab that liquidity (stop-loss hunt) before either accelerating higher or sharply reversing. Conversely, below $3,340, many bulls likely have stop-losses (sell orders) – sell-side liquidity resting under support.
A quick dip under S2 (liquidity grab) followed by a recovery would actually be a bullish signature (a bear trap by smart money). However, if price breaks significantly below 3325 and holds, that would mark a bearish CHOCH (first real trend change signal) and indicate the smart money possibly switching to selling rallies. Until then, the path of least resistance is still up. Any fair value gaps (imbalances) left from the rapid rise may exist around 3360 (for example), but so far gold has been backfilling these moves, keeping the trend steady.
Potential Trading Setups (4H Outlook)
Given the above analysis, here are two possible trade ideas on the 4H timeframe – one bullish and one bearish – with high-conviction zones in focus:
Bullish Buy Setup (Buy the Dip):
A pullback into the 3355–3340 support demand zone could offer a buying opportunity. This area has multiple factors of confluence: pivot S1/S2 supports, a Fibonacci 50–61.8% retracement, and an order block. If gold’s price action shows a clear reversal here (for example, a bullish engulfing candle or double bottom on 1H/4H), buyers can consider going long. The upside targets would be a return to 3385 (R1), with stretch targets near 3400–3415 (R2/R3). A prudent stop-loss could be placed just below 3325 (just under S3 and below the demand zone) to avoid a deeper reversal. This setup aligns with the prevailing uptrend (trading with the trend) and aims to “buy low” in the value zone.
Bearish Sell Setup (Sell the Rally):
If gold surges into the 3385–3402 resistance supply zone without slowing, traders should watch for signs of buyer exhaustion. In a still-range-bound market or if momentum wanes near the top, one might consider a short position in this zone if bearish signals emerge (e.g. a 4H shooting star candle, bearish divergence, or a minor BOS downward on lower timeframe). The idea is that smart money could use the liquidity above 3385/3400 to sell into. Initial downside targets could be the pivot area around 3370 and then the 3355 support. A stop-loss would ideally be just above 3415 (clear of the R3 level), in case gold breaks out to new highs. This counter-trend style trade is riskier since the 4H trend is up, so it’s crucial to wait for confirmation of a reversal before selling. Essentially, you’d be selling high at known resistance, but only if the market shows it can’t push further.
Both setups hinge on patience and confirmation. Rather than blindly picking tops or bottoms, let the price action confirm that the zone is holding. Remember that support and resistance levels are zones, not exact lines – price can wick through slightly before reversing. Always manage risk carefully.
Key Levels Snapshot
Pivot: 3370
R1: 3385 – R2: 3402 – R3: 3415
S1: 3355 – S2: 3340 – S3: 3325 These levels are derived from the classic pivot point formul, using recent price data. The pivot point at 3370 is the average of the previous session’s high, low, and close.
Trading above this pivot supports a bullish bias, while below it turns the bias bearish.
The R1/R2/R3 levels mark successive resistance hurdles above the pivot, and S1/S2/S3 mark support floors below it. Traders often use these as guideposts for intraday moves.
Takeaway:
Gold’s 4H chart shows bullish momentum with key support in the mid-$3300s and resistance near $3400. It’s wise to trade the reaction at these zones – buy dips near support in an uptrend, or sell rallies at resistance if momentum fades. In all cases, wait for price to confirm direction and stick to your trading plan. Happy trading!
Go with the flow and seize the gold trading opportunityGold rose and fell yesterday due to the influence of CPI data, and fluctuated violently during the session. There were obvious signs of a wash. In the evening, it rose again driven by the news, closed positive on the daily line, continued its strong upward trend at the opening and set a new high, showing an obvious bullish pattern. The overall structure maintains the bullish idea of low-long and trend-following.
From the 4H cycle, gold rose continuously after stepping back and stabilizing the middle track. The moving average system showed a bullish arrangement, and the Bollinger band opened and expanded, further confirming the continuation of the strong pattern. However, the current price is still running within the triangle convergence range, and has not yet effectively broken. It is not advisable to blindly chase more in the short term.
In terms of operation, it is recommended to take the step back and do more. Pay attention to the short-term support below the 3360-3358 range, and focus on the 3350-3340 range. You can rely on the support to arrange long orders in batches. Pay attention to the 3389 and 3400 areas on the upper short-term pressure. If the high is weak, you can try short-selling in combination with the actual trend.
Operation suggestion: It is recommended to buy gold near 3340-3350, and the target is 3366 and 3382. If it is strong, it is recommended to buy gold at the support of 3358-3360!
All recent trading strategies and ideas have been realized, and the point predictions are accurate. If your current gold operation is not ideal, we hope to help you avoid detours in your investment. Welcome to communicate with us!
XAU/USD 12 June 2025 Intraday AnalysisH4 Analysis:
-> Swing: Bullish.
-> Internal: Bullish.
Analysis and bias remains the same as analysis dated 23 April 2025
Price has now printed a bearish CHoCH according to my analysis yesterday.
Price is now trading within an established internal range.
Intraday Expectation:
Price to trade down to either discount of internal 50% EQ, or H4 demand zone before targeting weak internal high priced at 3,500.200.
Note:
The Federal Reserve’s sustained dovish stance, coupled with ongoing geopolitical uncertainties, is likely to prolong heightened volatility in the gold market. Given this elevated risk environment, traders should exercise caution and recalibrate risk management strategies to navigate potential price fluctuations effectively.
Additionally, gold pricing remains sensitive to broader macroeconomic developments, including policy decisions under President Trump. Shifts in geopolitical strategy and economic directives could further amplify uncertainty, contributing to market repricing dynamics.
H4 Chart:
M15 Analysis:
-> Swing: Bullish.
-> Internal: Bearish.
Analysis and bias remains the same as analysis dated 22 May 2025.
In my analysis from 12 May 2025, I noted that price had yet to target the weak internal high, including on the H4 timeframe. This aligns with the ongoing corrective bearish pullback across higher timeframes, so a bearish internal Break of Structure (iBOS) was a likely outcome.
As anticipated, price targeted strong internal low, confirming a bearish iBOS.
Price has remained within the internal range for an extended period and has yet to target the weak internal low. A contributing factor could be the bullish nature of the H4 timeframe's internal range, which has reacted from a discounted level at 50% of the internal equilibrium (EQ).
Intraday Expectation:
Technically price to continue bullish, react at either premium of internal 50% EQ or M15 demand zone before targeting weak internal low priced at 3,120.765.
Alternative scenario:
Price can be seen to be reacting at discount of 50% EQ on H4 timeframe, therefore, it is a viable alternative that price could potentially print a bullish iBOS on M15 timeframe.
Note:
Gold remains highly volatile amid the Federal Reserve's continued dovish stance and persistent geopolitical uncertainties. Traders should implement robust risk management strategies and remain vigilant, as price swings may become more pronounced in this elevated volatility environment.
Additionally, President Trump’s recent tariff announcements are expected to further amplify market turbulence, potentially triggering sharp price fluctuations and whipsaws.
M15 Chart:
Gold surged, what will be the trend today?Information summary:
On Wednesday, the US dollar index plunged during the session as the CPI data that was lower than expected boosted the market's expectations of interest rate cuts. As of now, the lowest point is near 98.2.
After the release of the CPI data, gold rose in the short term and touched the 3360 US dollar mark, and then quickly gave up the gains and retreated to around 3320. However, it rose again due to the sharp escalation of the situation in the Middle East. As of now, the highest is around 3380.
Market analysis:
From the current 4-hour chart:
Yesterday's 3360 pressure level has been broken, and the Asian market has successfully stood above this position in the early trading. Then the suppression position of 3360 has turned into a support level. Therefore, the position we should pay close attention to next should be 3360-3350. If the price falls back to around 3350, it is possible to enter the market and do more. If the price rises again, it is very likely to break through 3400. Once it breaks through 3400, it will most likely reach around 3420.
Secondly, from the hourly chart, there are some signs of head and shoulders bottom. It would be perfect if it can fall back and then go up again. But gold cannot fall below 3345 again. If it falls below 3345 again, it cannot be long.
Operation strategy:
Go long when the price falls back to around 3350, stop loss at 3340, profit range 3375-3400.
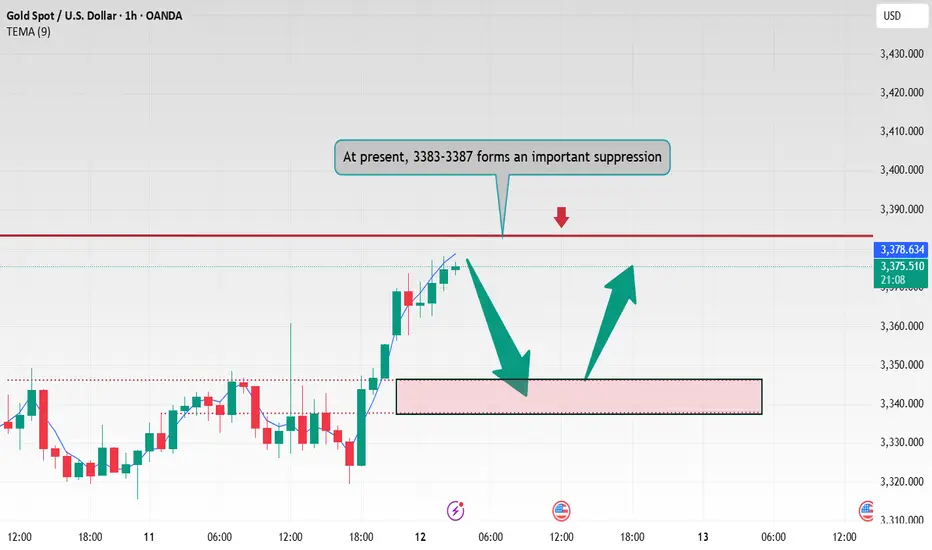
Gold (XAU/USD) Intraday Outlook – 12 June 2025Current Price: ~$3,373 (intraday) –
Gold is holding near recent highs after a sharp rally. Bullish momentum has improved markedly, fueled in part by favorable fundamentals (soft US CPI and geopolitical tensions lifting safe-haven demand)
On the charts, the short-term trend is upward, with buyers firmly in control following a breakout above prior resistance.
4H Trend & Key Levels
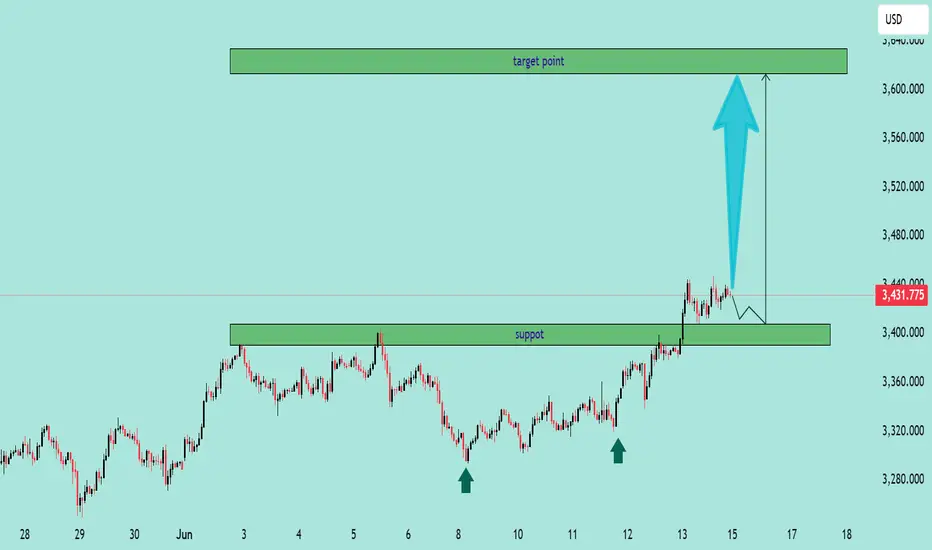
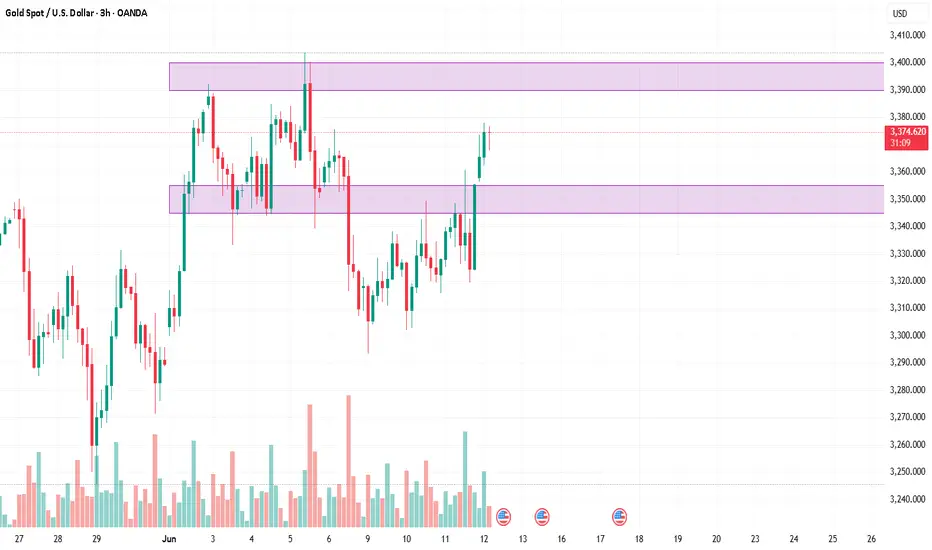
4H chart highlighting break of structure, demand (green) and supply (red) zones, and key intraday levels. Note the major demand zone that held around 3,214 (green) and the supply zone near 3,284 (red) which was a focal resistance. The 50% retracement of the prior day’s range (blue line near 3,274) acted as intraday resistance in that earlier session
Such annotations show where institutional activity likely set support (demand) and resistance (supply) areas. On the 4-hour chart, gold’s momentum is strongly bullish. The recent surge to 3375 pushed price above its 10-day moving average and widened the upper Bollinger Bands on both H1 and H4 – signs of a powerful uptrend. This came after gold cleared a major resistance around the $3,350 zone, which had capped prices earlier. With that barrier broken, the next upside target on the higher time frame is the $3,400 level (a notable psychological and technical hurdle)
In fact, it can be projected that a clean breakout above the ~3,380/3,390 zone could open the path toward $3,403 and even $3,430 in extension
Reflecting the next supply areas or Fibonacci extension targets above. Support levels on the 4H are stepping up as the trend rises. Previously, $3,320 (the last day’s high in late May) turned from resistance into support after the breakout. Now, immediate support is seen around $3,345–3,350, which corresponds to the top of the recent consolidation and roughly the 38.2% Fibonacci retracement of this week’s rally
Below that, the $3,330–3,335 zone (around the 61.8% retracement of the rally) is a secondary intraday support area
These levels also align with prior demand zones and the previous day’s lows, making them likely zones where buyers might step in on dips. Overall, as long as gold holds above the mid-$3,300s, the 4H bias remains bullish. The 4H structure shows higher highs and higher lows, and technical signals (price above short-term EMAs and an improving RSI) reinforce the short-term bullish outlook
Educational Note: In an uptrend, old resistance often becomes new support. Here $3,350 was a major resistance in the past and could serve as support if prices pull back. Traders also watch Fibonacci retracement levels within the up-move for potential bounce points – for gold, the 35-50% retracement zone of the latest swing (approximately $3,350 down to $3,330) is viewed as an attractive “buy-the-dip” area intraday.
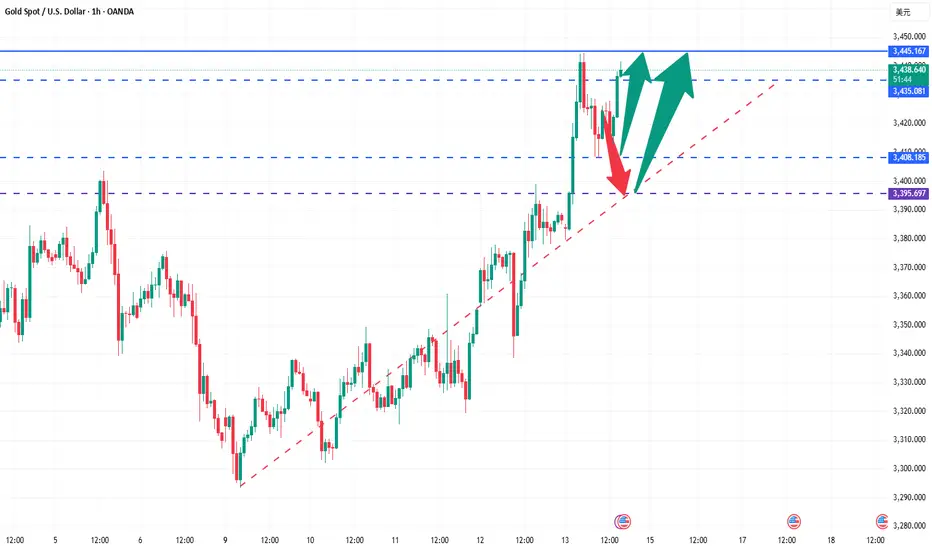
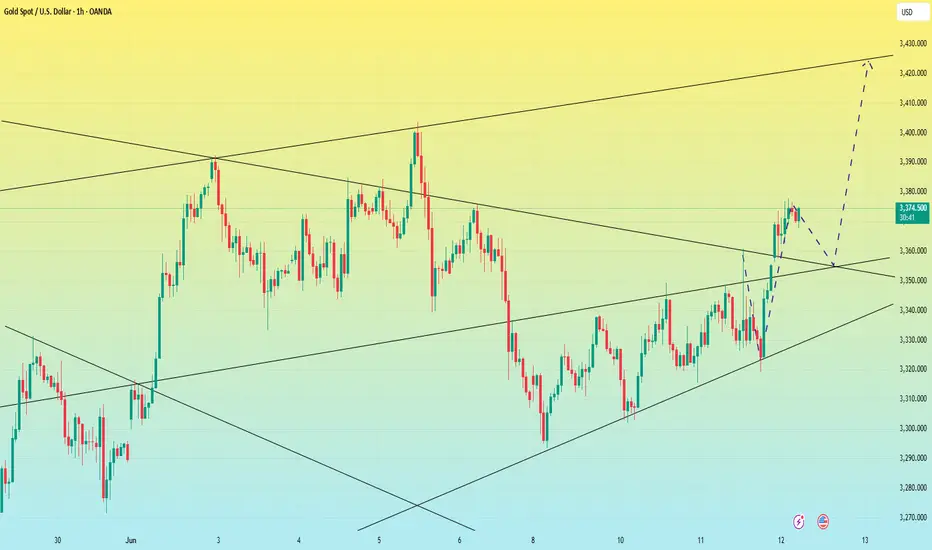
On the 1-hour chart, gold has been oscillating upward within a rising channel. After each push higher, it has formed brief consolidations or bull flags that resolved to the upside.
For example, after the strong push to ~3375, price coiled in a classic bull flag pattern, hinting at momentum building for another breakout. This pattern of consolidation after a rally shows healthy bullish behavior – buyers pausing before continuing the move. Higher lows (HL) and higher highs (HH) are clearly present, indicating a steady uptrend structure on the 1H
In fact, gold’s price action has been “taking out liquidity then taking out highs and creating new highs,” leaving no sign of bear control so far. This means each time the price dips and grabs some stop-loss liquidity from weak longs, it quickly reverses and surges to a fresh peak – a hallmark of a strong trend supported by larger players. From an SMC perspective, we can spot where institutional traders may be active. Recently, gold retested a major demand zone in the low $3,300s and rocketed higher. Specifically, price dipped to about $3,297 (just below a prior support), which appears to have been a liquidity grab (fake-out) below the obvious support level
Smart money often drives price briefly below such a level to trigger stop-losses, then buys into that liquidity. Indeed, a strong bullish rejection off $3,297-3,300 occurred, indicating aggressive buying (accumulation) by big players at that historical support
This confirmed a solid demand zone, and bulls defended it vigorously – a clear sign that institutional demand underpins that area. After the fake-out and bounce, gold quickly resumed making higher lows, confirming the uptrend’s resumption. Now, the focus shifts to the overhead supply zone. Gold is trading just below $3,380–3,390, a zone that previously acted as major intraday resistance.
In past attempts, price sharply sold off from this area, suggesting it’s a pocket of supply (sell orders) or profit-taking for institutions. This makes $3,380-$3,390 a key decision point: if bullish momentum is strong enough to drive a clean break through this supply, we could see a swift move higher (as mentioned, targets in the low $3,400s become viable)
However, if gold struggles and prints bearish signals (e.g. aggressive wick rejections or a change in character to lower lows on 15m/1H) near 3380-3390, it may indicate that sellers are defending this zone again, potentially causing a pullback. Traders are watching closely to see if smart money will cap the price here or let it run. It’s worth noting that intraday liquidity has built up around certain levels. Minor equal highs around $3,375-3,377 were taken out earlier (as gold hit a weekly high of ~$3,377) ,and now liquidity might reside just above $3,390 (at buy stops of breakout traders) and below $3,340 (sell stops of longs). The path of least resistance intraday appears upward unless those lower support levels start breaking. As long as gold remains inside this rising structure, the bias is to buy dips rather than sell rallies. Only a clear break below the $3,337–3,340 support (recent range floor) would hint at a short-term trend shift down. Until then, bulls are in charge. Educational Note: Order blocks and supply/demand zones are areas where price saw a sharp move, indicating institutional orders. In gold’s case, an H1 demand block near $3,300 (origin of the recent rally) is such an area – price dipped into it and then launched higher
Conversely, the $3,380-$3,390 area is a supply zone from which price fell previously.
Watching price behavior at these zones (e.g. strong rejection vs. breakthrough) gives clues: a heavy rejection implies continued range or reversal, while a breakthrough suggests a new leg of trend.
Trade Setups
Buy on Dip (Bullish Setup):
If gold retraces into the $3,345–3,355 support zone, consider a long entry near ~$3,350 (a key Fibonacci support & prior breakout level)
A suggested stop-loss is just below $3,335 (to stay under the 61.8% retracement and recent swing low). Target the $3,375 area for partial profits, and $3,385–3,390 if momentum continues. This buy-on-dips approach aligns with the prevailing uptrend – as one analyst noted, “Gold below 3350 is an opportunity to buy on dips”
(Rationale: You’re buying at support in an uptrend, aiming for a retest of the highs.)
Sell Near Resistance (Bearish Setup):
If gold rallies toward the $3,390–3,400 zone but shows rejection (stalling candles or a bearish reversal pattern) at that resistance, one can consider a short entry around ~$3,395. Place a tight stop-loss above $3,405 (just beyond the major resistance). Target a pullback to about $3,370 first, and $3,350 on an extended drop. This trade fades a possible near-term top in case the supply zone holds. For instance, a suggested plan from another analyst was to “sell around 3397–3400” with stops above 3409, looking for a move back to the mid-$3,300s
(Rationale: You’re selling at an identified supply zone, expecting a short-term correction.)
Breakout Scenario:
For traders who prefer momentum plays, watch $3,380 on the upside and $3,340 on the downside. A 1H candle close beyond $3,380 with strong volume would confirm a breakout – you could then target ~$3,405 and above (trail stops as it goes)
Conversely, a drop below $3,340 might signal a bearish intraday reversal, opening downside targets near $3,315 and $3,300
If trading the breakout, ensure confirmation (no fake-outs) – wait for a retest if possible, and then ride the move. (This scenario is only for when price definitively exits the current range.)
Remember: The intraday trend is bullish, so lean toward long setups unless key supports break. Keep it simple – trade the price action you see. Gold can be volatile, so it's wise to use stop losses and not over-leverage. Happy trading! 📈✨
Iran hardens steel, gold rises!
📣Gold news
On Thursday (June 12, 00:00 in the Asian morning, spot gold continued to rise, reaching a high of $3,377 so far, a new high this week. The lower-than-expected US CPI data in May increased the possibility of the Federal Reserve's interest rate cut in September, and the trend of the US dollar and the decline in US bond yields provided a favorable environment for gold prices. At the same time, tensions in the Middle East escalated on Wednesday, and Iran said it would attack US military bases in the Middle East if negotiations broke down. The sharp rise in geopolitical tensions in the Middle East has significantly increased the safe-haven demand for gold. Although the conclusion of the US-China trade agreement has eased some market pressure, the potential impact of tariff policies on inflation still needs to be vigilant. Looking ahead, investors need to pay close attention to Thursday's PPI data and the Fed's policy trends, while keeping an eye on the situation in the Middle East. Driven by risk aversion and expectations of loose monetary policy, the gold market still has room for upside in the short term.
📣Technical side:
Yesterday's CPI data was bullish. After a brief surge, it fell back to below 3330, and then fluctuated. The rise was not strong. Late at night, Trump again called on the Federal Reserve to cut interest rates by 100 basis points. Confidence in the Iran nuclear negotiations decreased. In the next one to two weeks, he will send a letter to trading partners to set unilateral tariffs. Uncertain risks increased. Gold rose in contact with the CPI data. In the short term, the price broke through the 3348-3353 suppression. Consider going low around this position during the day, looking at the 3383-89 suppression, stop loss 3337, pay attention to risks.
💰Strategy Package
Today's trading strategy: long around 3349. Stop loss 3337, take profit 3383
Short around 3370, stop loss 3374, take profit 3350
Trend value trading is the only way for all investors to make profits. There is no shortcut, and don't be lucky. Any investor needs to go through the process of loss, capital preservation, and profit from the beginning of entering the market. The market is definitely not a long-term paradise for speculators. A successful speculation does not mean that it can be successful from beginning to end. Only stable and continuous profits can make a person successful. There must be rules here. If you don't break the rules, you won't be eliminated.
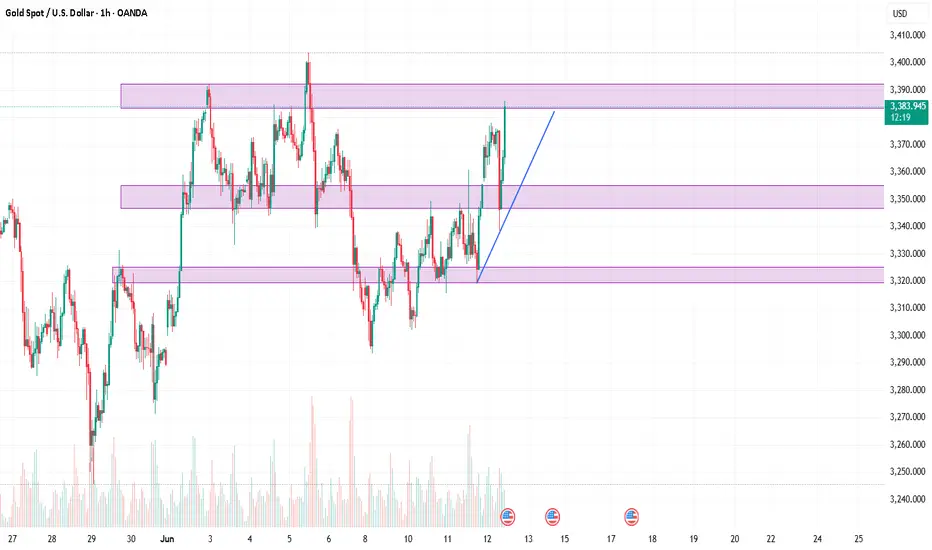
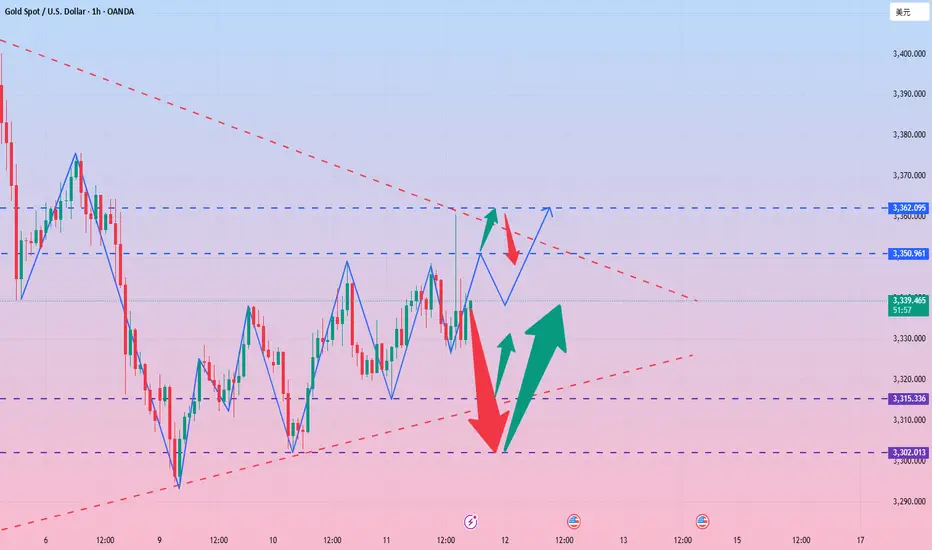
Gold Price ActionHello Traders, I've observed that gold is currently respecting the trendline in both directions. However, there's still a valid Fair Value Gap (FVG) in play. If the trendline fails to hold, there's a good chance that price could reverse from that FVG zone.
So, keep a close watch on both the trendlines and the FVG area, and don’t forget to monitor volume for confirmation.
Wishing you all the best — happy trading, and thank you!

Gold rebound is still a short-selling opportunityFirst of all, let's take a look at why the market is still not reversing after a big rise, and there is a rapid rise and fall?
The data is bullish, and gold is rising rapidly, but we should pay attention to the sustainability of the rise, and secondly, the current trend direction. The overall trend of gold is still fluctuating downward recently, so even if the data is bullish, it is likely to just give an opportunity to "go high and short".
Although gold performed strongly after the data was released, it began to fall under pressure at the 3360 line, the trading concentration area of the last box shock, indicating that the bulls' volume is still not enough to break through the upper resistance. It is reasonable to rise and fall.
Since gold is currently in a market that is tempting to buy more, it means that the main trend is still bearish. The rebound is still dominated by short selling. The gold 1-hour cycle closed with a long upper shadow, indicating that the upward attack is weak, indicating that the area above 3350 is still a strong pressure area. This upward rush is just a short-term effort with the help of data benefits, which is a typical false breakthrough. Therefore, gold rebounded to the 3350-3360 area in the US market, and it is still dominated by high shorts.
This is the charm of the market - some people are always hesitant in the ups and downs, while others can always grasp the key turning points. The premise is to be able to see the trend clearly and follow the trend.
Don't be led by the market, but understand: Is the current fluctuation a trap or an opportunity?
If the direction is wrong, the effort will be in vain; if the direction is right, you will get twice the result with half the effort.
Don't make excuses for failure, just find ways to succeed. Have you found it?
All recent trading strategies and ideas have been realized, and the point predictions are accurate. If your current gold operation is not ideal, we hope to help you avoid detours in your investment. Welcome to communicate with us!
Gold CPI data forward-looking layout
📊Technical aspects
Gold trend from the perspective of technical analysis
From the daily technical chart, the gold price has experienced complex fluctuations. Although there have been ups and downs recently, it is still in a relatively high range. In terms of moving averages, short-term moving averages such as the 5-day moving average and the 10-day moving average show a certain entanglement trend, indicating that the short volume is relatively strong in the short term and the short trend is obvious.
From the MACD indicator, its double lines are running below the zero axis. Although the bar chart has shrunk, it still remains in the positive area, suggesting that the bullish force has weakened in the near future, but the overall market is still in a bearish market pattern, and the upward momentum is gradually fading. At present, the RSI value is further downward, indicating that the bearish force will gradually increase.
From the Bollinger Bands indicator, the gold price is currently running below the middle track of the Bollinger Bands, and the Bollinger Bands opening shows a slight narrowing sign. If the price falls below the middle track of the Bollinger Bands and continues to decline, the bearish trend may intensify. If the downward trend accelerates, gold still has a profit momentum of about $100
💰 Strategy Package
Short Position:3330-3340