Gold rebound is still a short-selling opportunityFirst of all, let's take a look at why the market is still not reversing after a big rise, and there is a rapid rise and fall?
The data is bullish, and gold is rising rapidly, but we should pay attention to the sustainability of the rise, and secondly, the current trend direction. The overall trend of gold is still fluctuating downward recently, so even if the data is bullish, it is likely to just give an opportunity to "go high and short".
Although gold performed strongly after the data was released, it began to fall under pressure at the 3360 line, the trading concentration area of the last box shock, indicating that the bulls' volume is still not enough to break through the upper resistance. It is reasonable to rise and fall.
Since gold is currently in a market that is tempting to buy more, it means that the main trend is still bearish. The rebound is still dominated by short selling. The gold 1-hour cycle closed with a long upper shadow, indicating that the upward attack is weak, indicating that the area above 3350 is still a strong pressure area. This upward rush is just a short-term effort with the help of data benefits, which is a typical false breakthrough. Therefore, gold rebounded to the 3350-3360 area in the US market, and it is still dominated by high shorts.
This is the charm of the market - some people are always hesitant in the ups and downs, while others can always grasp the key turning points. The premise is to be able to see the trend clearly and follow the trend.
Don't be led by the market, but understand: Is the current fluctuation a trap or an opportunity?
If the direction is wrong, the effort will be in vain; if the direction is right, you will get twice the result with half the effort.
Don't make excuses for failure, just find ways to succeed. Have you found it?
All recent trading strategies and ideas have been realized, and the point predictions are accurate. If your current gold operation is not ideal, we hope to help you avoid detours in your investment. Welcome to communicate with us!
Goldpriceaction
Gold CPI data forward-looking layout
📊Technical aspects
Gold trend from the perspective of technical analysis
From the daily technical chart, the gold price has experienced complex fluctuations. Although there have been ups and downs recently, it is still in a relatively high range. In terms of moving averages, short-term moving averages such as the 5-day moving average and the 10-day moving average show a certain entanglement trend, indicating that the short volume is relatively strong in the short term and the short trend is obvious.
From the MACD indicator, its double lines are running below the zero axis. Although the bar chart has shrunk, it still remains in the positive area, suggesting that the bullish force has weakened in the near future, but the overall market is still in a bearish market pattern, and the upward momentum is gradually fading. At present, the RSI value is further downward, indicating that the bearish force will gradually increase.
From the Bollinger Bands indicator, the gold price is currently running below the middle track of the Bollinger Bands, and the Bollinger Bands opening shows a slight narrowing sign. If the price falls below the middle track of the Bollinger Bands and continues to decline, the bearish trend may intensify. If the downward trend accelerates, gold still has a profit momentum of about $100
💰 Strategy Package
Short Position:3330-3340
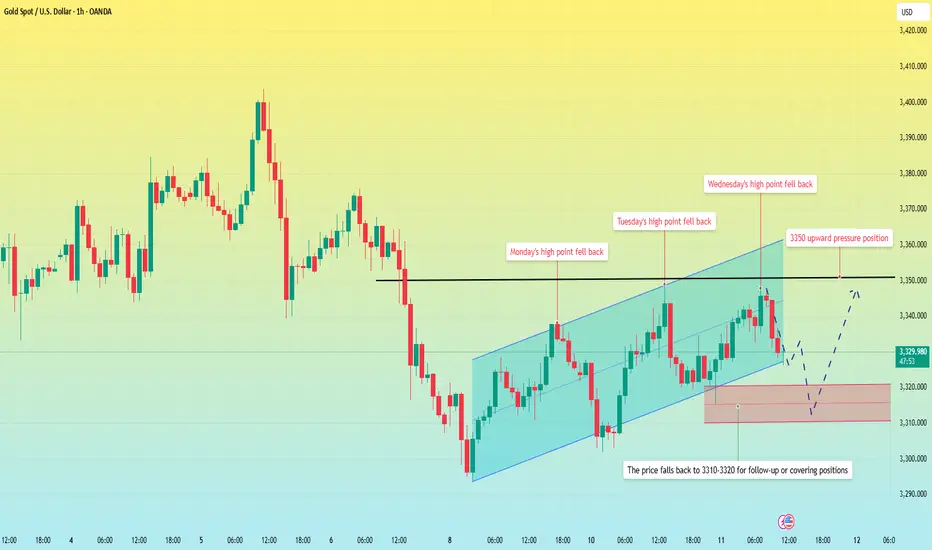
Gold fluctuates, awaiting CPI data.In Asian trading on Wednesday, traders are awaiting the release of the latest U.S. Consumer Price Index (CPI) data for May. Estimates suggest that prices are likely to rise as American households feel the impact of tariffs imposed by the Trump administration. But the easing between the world's two largest economies should have an adverse impact on safe-haven assets such as gold, and the lack of a downward trend in gold prices suggests that investors are waiting for more developments.
In terms of short-term trends, the gold 1-hour chart shows that gold prices remain in an upward channel with a low point. So from the trend, the current momentum for gold to rise will be stronger. The price pullback is giving opportunities to go long.
The change of thinking is actually following the trend. For the current operation, enter the market with the trend, and cover the position when it falls back or break through the profit position to cover the position. In a strong market, during the correction phase, the price is rising, and the amplitude of the correction is often small. The bulls retreated at the opening to accumulate momentum. Above is the pressure level of 3350-3360. Once it breaks through and stabilizes, it will accelerate the upward trend. Just follow the general trend of the market.
Operation strategy:
Go long when the price falls back to 3310-3320, stop loss at 3300, and profit range is 3345-3360.
Gold continues to fluctuate, CPI data becomes the key
Technically, the daily chart continues to fluctuate sideways, the moving average is glued together, and the RSI indicator runs near the middle axis. The moving average of the four-hour chart is also glued together, the price is adjusted near the middle track of the Bollinger Band, and the RSI indicator also runs near the middle axis. The gold price once broke through the 3349 mark yesterday, and then fell back and closed near 3320.
Focus on the 3320 position during the Asian session. From a technical perspective, the gold price continues to fluctuate in a range. Under the premise of the lack of news stimulating negative impact, from a technical perspective, the gold price continues to maintain low buying.
From the daily level, gold has been fluctuating at a high level since the high of 3500. The current highs of 3500, 3435, and 3403 are gradually moving down, and the lows of 3120, 3245, and 3293 are gradually moving up. The range of fluctuations is gradually narrowing. The short-term market may continue to fluctuate. If it breaks through, it will need to wait for major news stimulation to break through the direction!
💰Strategy Package
Then today's lock-up range is 3293-3350. It is recommended to sell high and buy low. Before the effective breakthrough of the range, short-term or ultra-short-term scalping is the main means.
Key points:
First support level: 3320, second support level: 3306, third support level: 3292
First resistance: 3346, second resistance: 3358, third resistance: 3376
Buy: 3303-3305, stop loss: 3292, target: 3320-3330;
Sell: 3350-3353, stop loss: 3362, target: 3330-3320;
⭐️ Note: Labaron hopes that traders can properly manage their funds
- Choose the number of lots that matches your funds

GOLD PRICE ACTION ANALYSIS – June 11, 2025 GOLD PRICE ACTION ANALYSIS – June 11, 2025 🟡
Technical Breakdown & Bearish Scenario Ahead ⚠️📉
🔍 Overview:
The chart presents a clear range-bound structure with strong horizontal resistance around the $3,400–$3,420 zone and support around the $3,120–$3,160 level. Price is currently trading near the upper range of the consolidation.
📊 Key Technical Levels:
🔴 Resistance Zone: $3,400 – $3,420
➤ Price has been rejected here multiple times (highlighted by red arrows and orange circles), showing strong supply pressure.
🟣 Intermediate Support: $3,260.618
➤ This level acted as a minor support and could be tested again if the current pullback deepens.
🟤 Major Support Zone: $3,120 – $3,160
➤ A key demand area where price previously bounced significantly.
📉 Bearish Setup:
A potential lower high is forming just below the resistance zone.
The projected path suggests a minor pullback to form a bearish retest, followed by a potential breakdown below $3,260.
If the $3,260 support is broken decisively, further downside toward the $3,120–$3,160 support is likely (blue arrow projection).
🔄 Bullish Scenario (Invalidation):
A breakout and strong close above $3,420 could invalidate the bearish structure.
In that case, price might attempt to target higher resistance levels beyond $3,440.
📌 Conclusion:
Gold remains in a range with a bearish bias unless the $3,420 resistance is breached.
🔽 Watch for confirmation below $3,260 for bearish continuation.
✅ For bulls, wait for a strong breakout above resistance with volume.

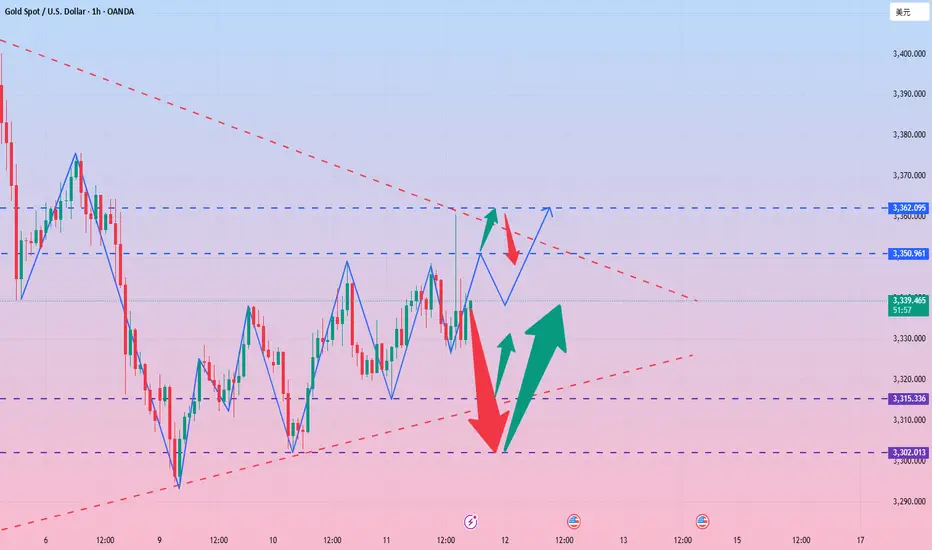
How is the market situation during the China-US talks?Information summary:
On Tuesday, as the China-US trade negotiations entered the second day, the US dollar index fluctuated around the 99 mark.
The gold price once approached the 3,300 US dollar mark in the Asian market, and then continued to rise, reaching the highest of the 3,350 US dollar mark. After the opening of the US stock market, all the gains during the day were given up, and it has been maintained below 3,350 for consolidation.
From the current known negotiation information, the two sides basically agree on the general direction and principles, but it means that more specific content and details have not yet been fully negotiated, and more dialogue is needed to resolve.
Market analysis:
From the current gold market, as long as the 3,350 mark cannot be strongly broken through next, the price will fall again. The consolidation range will remain at 3,300-3,350. As long as the price fails to break through strongly, there will still be a fifth wave of downward trend.
Therefore, gold is still maintaining short selling operations at high points.
Operation strategy:
Short at 3345-3450, stop loss at 3360, the first target is this week's low of 3300, the second target is 3285, and the third target is 3250.
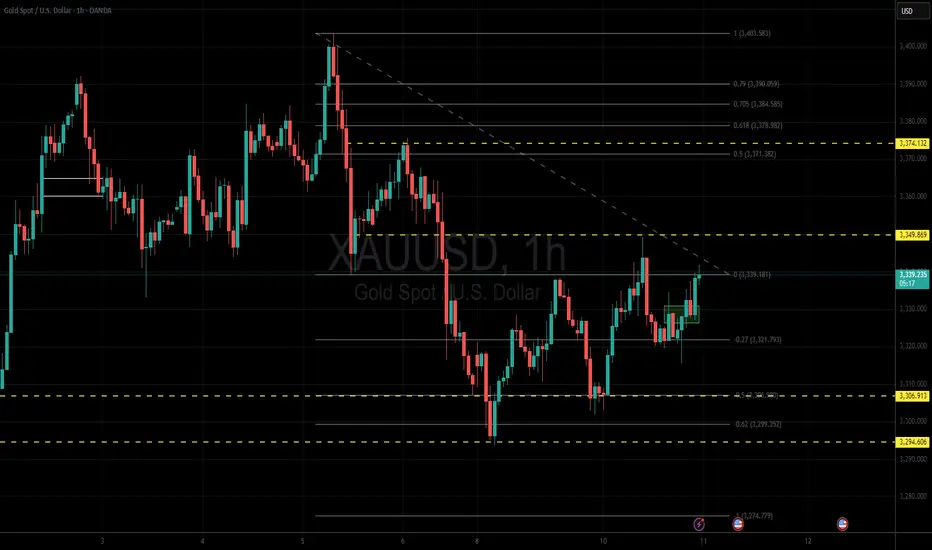
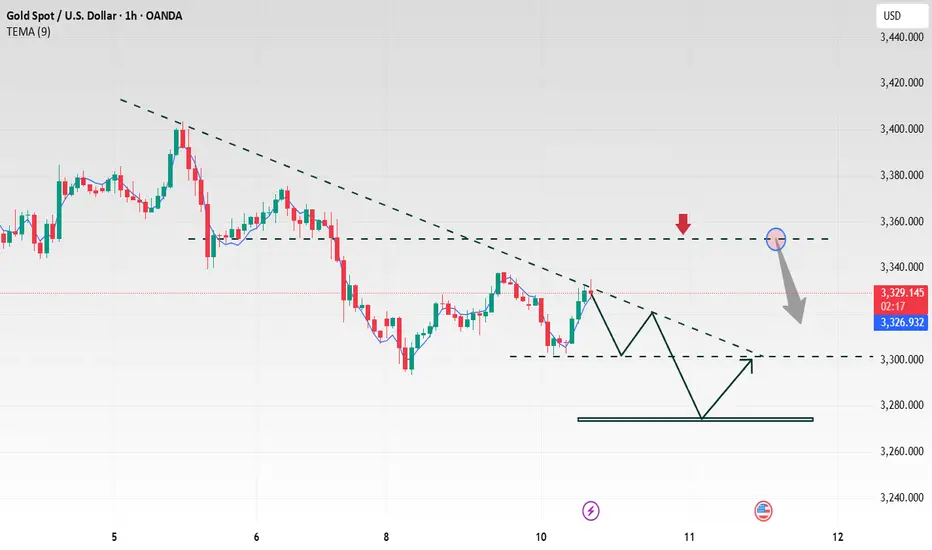
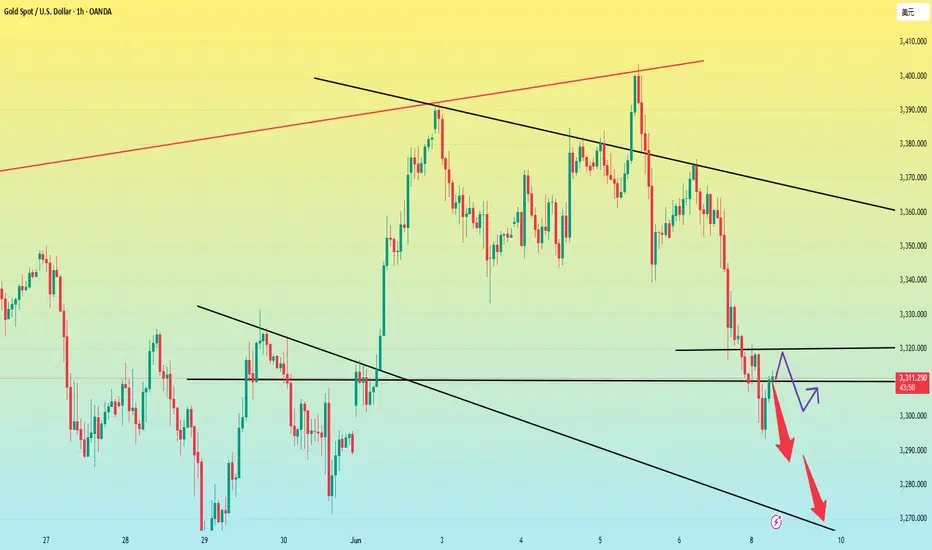
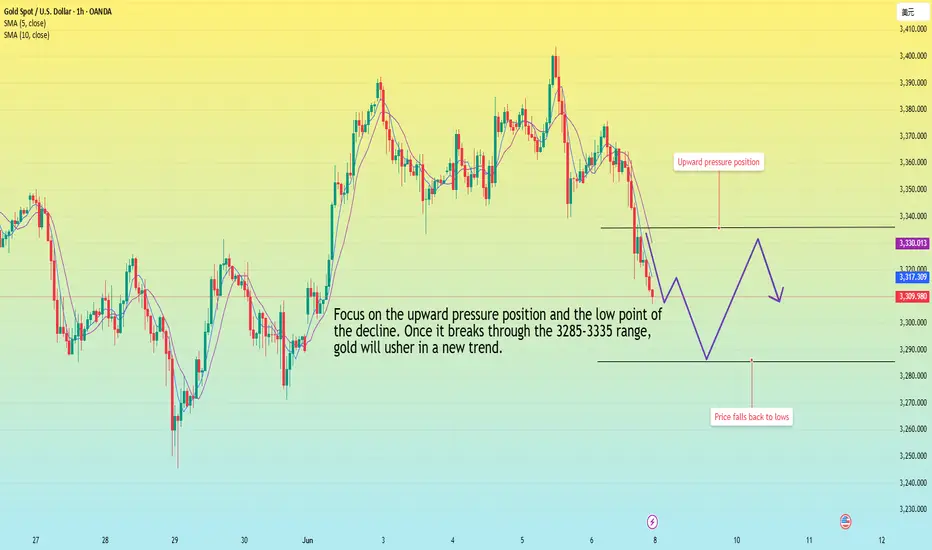
Gold 1H Current levels 6/10/25Just providing an update on the key levels I have observed on the 1H Gold chart.
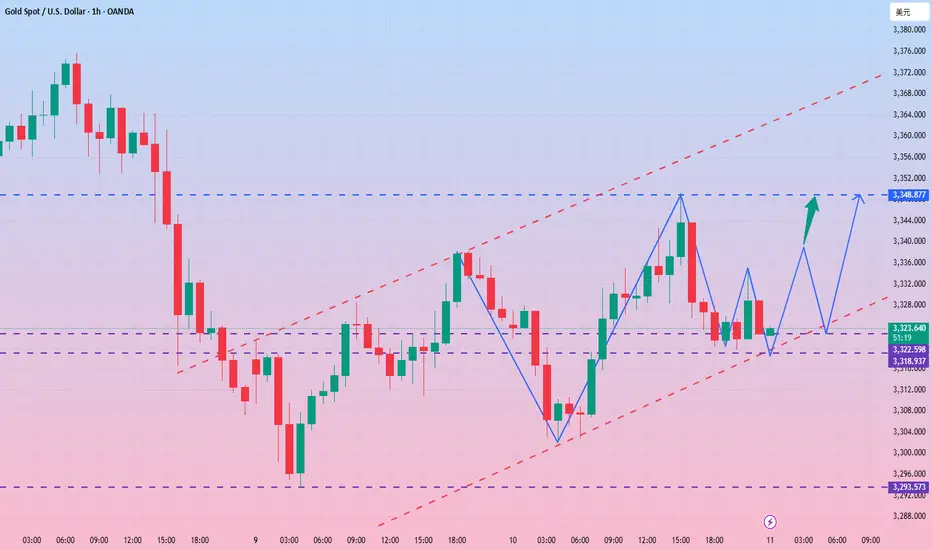
Gold V-shaped reversal still has room to rise In the morning, the market was under pressure at 3328, and two consecutive big negative lines fell to the low of 3302, breaking through the lower track of the descending flag consolidation channel, forming an effective break. 3317 was originally the confirmation point of the channel counter-pressure, and it was also the 618 split resistance at the time. Then the middle track was lost, and the trend was bearish, so it tried to rebound but continued to fall under pressure.
But the market immediately made a V-shaped reversal, breaking through the morning high of 3328, and had attacked to 3342 before the US market. The European session was volatile and strong, and with the help of a pullback before and after the U.S. session to lure short sellers, there is still hope for a second rise
The focus of the support for the retracement is on two positions: one is the 3322 line, corresponding to the middle track and 50% split support; the other is 3318, corresponding to the 618 split support. If it stabilizes after touching it, it will most likely point to the 3348 counter-pressure position.
If the pressure of 3348 cannot be broken, there is still a possibility of repeated fluctuations in the short term. It is necessary to pay attention to whether the secondary low point appears when it pulls back to further consolidate the support structure. If the market directly breaks through and stands above 3348, 3293 may have been confirmed as a short-term low.
The recent trading strategy ideas are all realized, and all the points are predicted accurately. If your current gold operation is not ideal, I hope I can help you avoid detours in your investment. Welcome to communicate with us!
Gold fluctuates widely, strategy remains unchanged
📌Gold news
The US and Chinese delegations will continue talks in London for the second consecutive day. President Trump expressed optimism, saying the talks "should go well". US officials said the talks could lead to Washington lifting certain technology export restrictions in exchange for Beijing relaxing controls on rare earth exports - a material that is critical to industries such as energy, defense and advanced technology. The results of these negotiations may provide a new direction for precious metals
📊Comment analysis
The European session continued to retrace and gave a low of 3293, then slowly strengthened. The current high reached 3349, so today's strategy does not need to be changed for the time being. If the current market is given to 3335-3345 again, short orders can still be entered. The current trend is still weak, and the US market is likely to follow the old path of a second decline, so the current idea of shorting on the pullback remains unchanged for the time being!
💰Strategy package
Gold: Short on rebound 3335-3345, stop loss 3350, target 3300-3280!
⭐️ Note: Labaron hopes that traders can properly manage their funds
- Choose the lot size that matches your funds
-
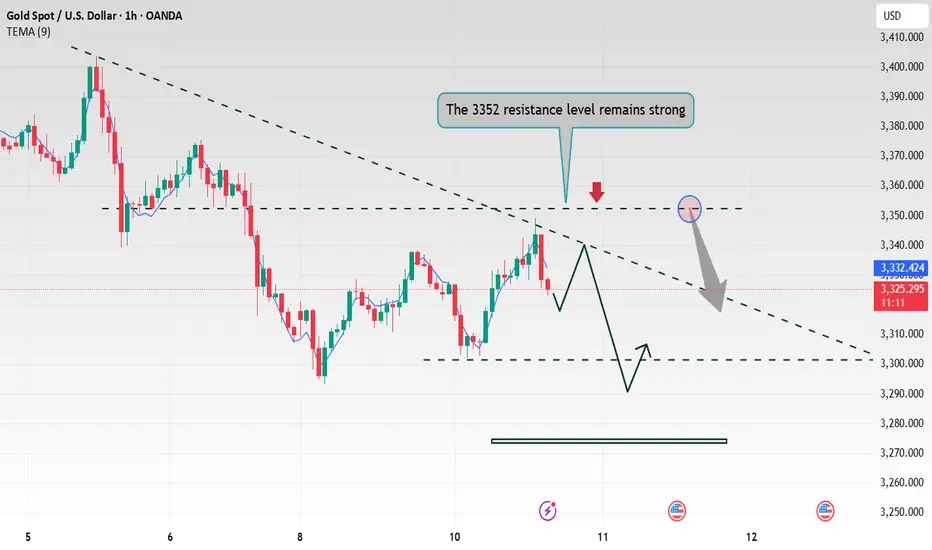
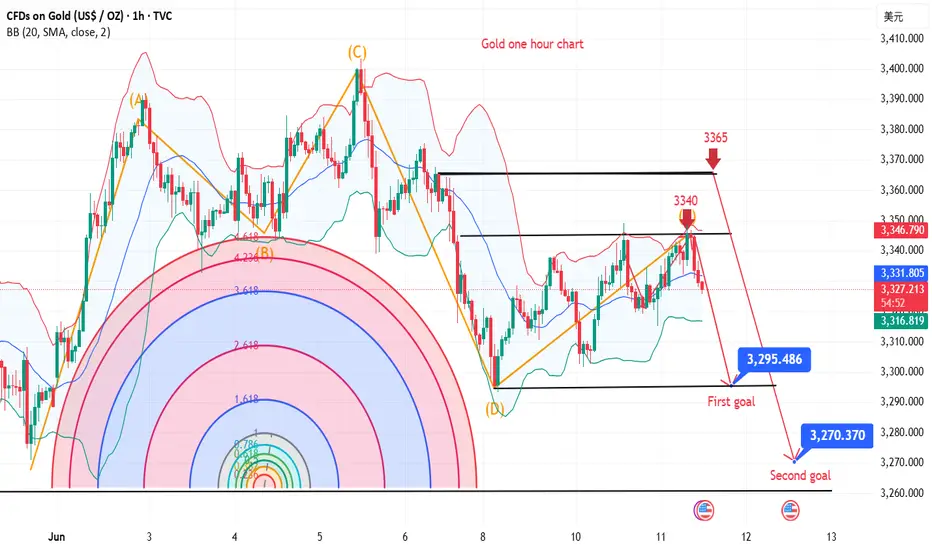
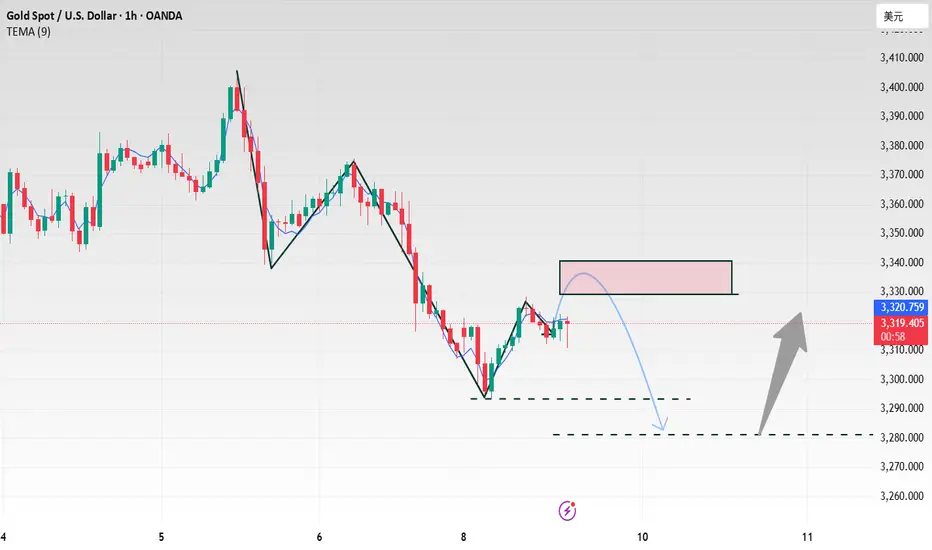
Gold fluctuates repeatedly, hiding great opportunities!After the opening of gold today, the bulls and bears played fiercely. In the early trading, it fell to 3293 and received temporary support, then stabilized and rebounded. It broke through the high point of 3320 in the Asian session and continued to rise above 3330. However, the price was under obvious pressure near 3330, and the momentum indicators (MACD, RSI) showed a top divergence at the same time, reflecting the exhaustion of bullish momentum and limited short-term upside space.
From the technical structure, gold has effectively fallen below the middle track support of the H4 cycle, and at the same time lost the upward trend line built since the low point in June. The two breakout positions are highly overlapped, constituting an obvious technical weakening signal. The current trend is trapped in the key resistance suppression area, and it is expected to enter a high-level shock and weakening stage.
The operation suggestions are as follows:
🔸Strategy direction: short-term thinking
🔸Entry area: 3335–3345 range
🔸Defense reference: stop loss above 3350
🔸Target expectation: look down to 3305, break to 3293 or even 3280 near the extension support
In terms of fundamentals, the US dollar index is under short-term pressure, mainly due to the decline in the US fiscal outlook and US Treasury yields; but the non-agricultural data boosted economic resilience, which cooled the market's expectations for a rapid rate cut this year, restricting the rebound space of gold prices. Although risk aversion has support, it has not yet become a dominant driver. The current market sentiment remains cautiously neutral.
Overall judgment: The short-term rebound of gold prices is limited, and the short-term trend is gradually released after the structural break. It is recommended to follow the trend and go high, control risks, and steadily execute trading plans.
The short-term tug-of-war for gold is starting
Gold prices continued their decline last Friday and stabilized and rebounded. Yesterday, gold prices fell back to the 3,300 mark, then slowly rose to the 3,338 mark, and fell back after encountering resistance, which is in line with the technical consolidation rhythm.
- China-US trade negotiations: The US has released signals that it is willing to relax export restrictions, and the market is waiting for the results of the negotiations, which may affect risk sentiment.
- US May CPI data: Inflation changes will provide key guidance for the Fed's policies.
- The current trend is weak, but the downside is limited. Buy on dips and avoid large-scale shorting.
- Today, it is recommended to wait and see, and wait for the negotiation results to become clear before entering the market to reduce volatility risks.
🔥Sell gold area: 3330-3348 SL 3352
TP1: $3320
TP2: $3310
🔥Buy gold area: $3295-$3305 SL $3290
TP1: $3320
TP2: $3330
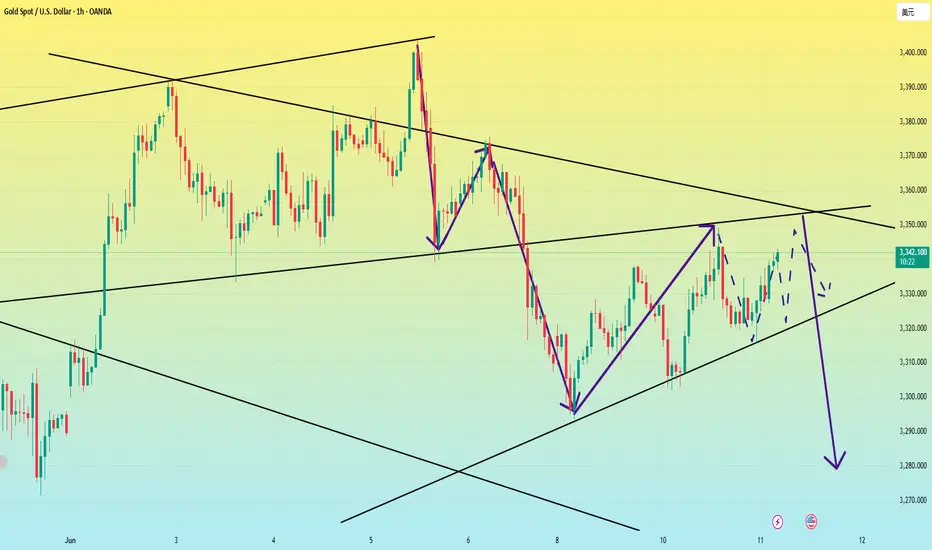
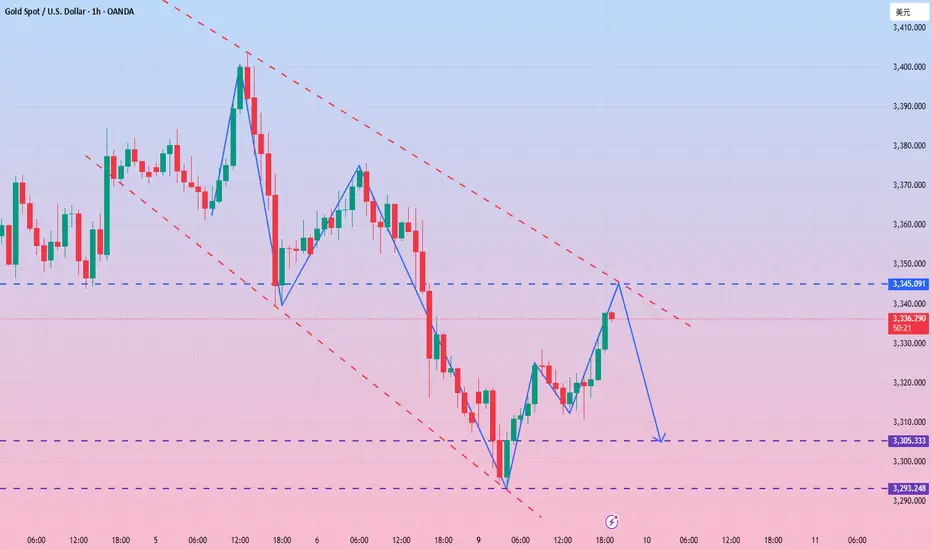
Gold is falling. Where is the low point?Market summary:
Yesterday, thanks to the weakness of the US dollar, the US dollar once fell below the 99.0 mark. Spot gold rebounded from the low of 3293 hit earlier in the session, recovering all the losses during the day, and the highest point was near 3338.
It fell from the high point in the early Asian session on Tuesday, and has been consolidating in the 3300-3310 range so far. In my early analysis, I pointed out that there is a high probability that the fifth wave of the wave trend will fall at the beginning of this week, and as I predicted, it is completing the fifth wave of the downward trend.
Trend analysis:
From the four-hour chart, the fourth wave of rebound has been completed, so today is the fifth wave of the downward trend. Next, we look at the two target ranges.
The first target is around 3280, and the second is 3260-3350. And today, it is highly unlikely to stabilize above 3310, so don't choose to short at the rebound high point, the chance is very slim.
Operation strategy:
Short around 3310, stop loss at 3320, profit range 3380-3350.

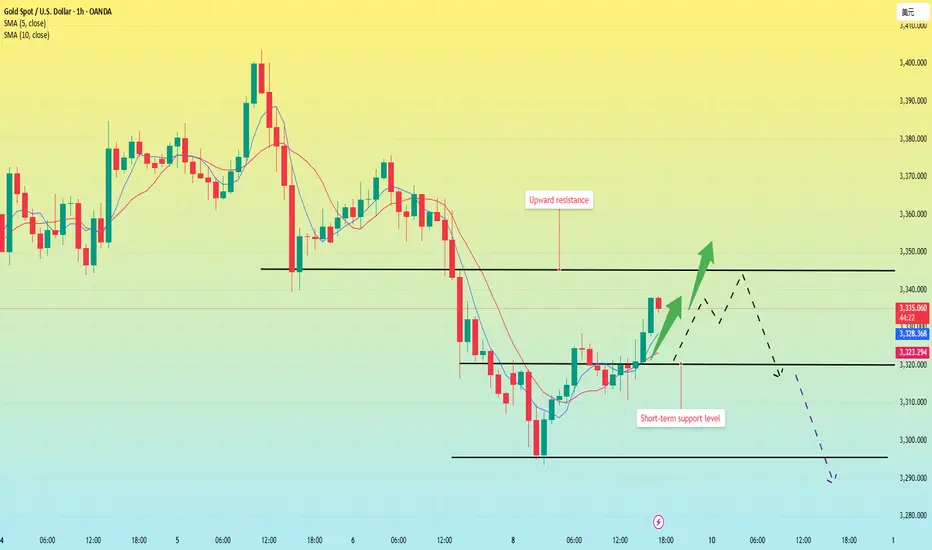
Gold price rebounds, short-term strength?After the opening of the U.S. stock market today, the price of gold rose rapidly, breaking through the first resistance level of 3325, and currently reaching the intraday high of 3337.
However, from the hourly chart, the current price has not reached the upward trend point I predicted, so the price is likely to rise slightly again in the future.
From the 4-hour chart, gold rose again after falling back in the U.S. market, and the price broke through the 3325 position upward, which means that the short-term is strong; in the morning analysis, I predicted that gold would fall back and rush high, and the fall back can be short-term long, and the volatile market can be operated in the short term according to this strategy.
At present, the 4-hour MA5-day and 10-day moving averages have a trend of forming a golden cross upward, and after the fall in the morning, the moving averages are currently showing an upward turning trend.
Therefore, after the price breaks through 3325, the probability of continuing upward is still relatively large, and the pressure position is 3345; this position is the point after the fall back from the high point in May, and it is also an important pressure position after the current price falls back and rebounds.
The price is currently heading towards a retest of 3340-3345 levels. If the dollar continues to fall and gold manages to consolidate above 3345, the bullish trend is likely to continue. However, a false breakout of 3340-3345 area could trigger a further decline following the breakdown of the bullish structure.
Gold hits 3335 in the US market and shorts
⭐️Gold information:
Looking back at last week's trend, after hitting a high on Monday, gold prices fluctuated in a range from Tuesday to Thursday, and closed with a sharp drop on Friday, forming an M-top pattern from a technical perspective.
This week, the market focus is on the high-level trade negotiations between China and the United States held in London. The market expects that the negotiations will proceed smoothly, and this optimism is bearish for gold. Based on the comprehensive technical and fundamental analysis, the gold price is still bearish today. It is recommended to pay attention to the short-selling opportunities in the rebound range of 3330-3340 US dollars.
⭐️Set gold price:
🔥Sell gold area: 3330-3340 SL 3345
TP1: $3320
TP2: $3310
TP3: $3295
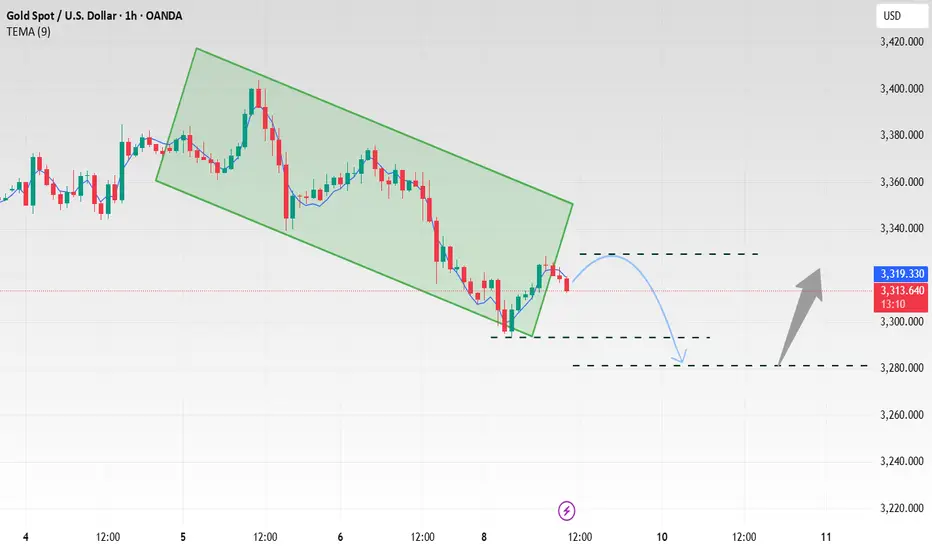
Gold is falling, waiting for the trend to be completed?The Asian market continued to fall on Friday in the early trading on Monday, reaching a low of around 3293. It then bottomed out and rebounded, reaching a high of around 3325, and is currently maintaining a consolidation around 3320.
From the hourly chart, gold is completing the fifth wave in the wave trend; in the short term, gold is in a rebound trend, and has been maintaining this upward trend channel.
As long as it cannot fall below 3310 next, the gold rebound has not ended, and it may directly test the top around 3345. Because 3345 is exactly the bottom of the first wave, the rebound trend from 3293 is likely to be the fourth wave.
As long as the fourth wave rebound cannot strongly break through the bottom of the first wave at 3345, then the fifth wave will most likely show a downward trend.
Therefore, the current trading operation is basically simple;
Long strategy: long at 3315-3320, stop loss at 3305, and profit range at 3340-3350.
Short selling strategy: wait for the price to stabilize near 3345 and then enter the market to short sell.
Important tip: If the price falls from 3345, it is highly likely to go down directly to the low point of 3280-3250.

Gold support near 3280 remains strong!
⭐️Gold information:
Gold prices (XAU/USD) stabilized near $3,310 in early Asian trading on Monday, and gold prices struggled to gain momentum against the backdrop of renewed strength in the U.S. dollar (USD). As of press time, gold was around 3315 points. Although the strengthening U.S. dollar posed resistance to gold, lingering uncertainty surrounding President Trump's tariff strategy continued to provide some support for it.
On Friday, optimistic labor market data boosted the dollar and put pressure on dollar-denominated assets such as gold. The U.S. Bureau of Labor Statistics (BLS) reported that nonfarm payrolls increased by 139,000 in May, exceeding expectations of 130,000 and exceeding the revised 147,000 (originally 177,000) last month. The stronger-than-expected employment report dampened hopes for a near-term rate cut by the Federal Reserve and weighed on the appeal of gold prices.
⭐️Set gold price:
🔥Sell gold area: 3348-3350 SL 3355
TP1: $3340
TP2: $3330
TP3: $3320
🔥Buy gold area: $3281-$3279 SL $3274
TP1: $3292
TP2: $3300
TP3: $3315
The decline is not complete, beware of the low point.Last Friday, the US dollar index rose and recovered the 99 mark as the non-farm data exceeded expectations and weakened the Fed's hope of cutting interest rates this year. Spot gold continued to fall after the release of non-farm data, breaking through the 3345 and 3330 levels.
Market analysis:
First look at the 4-hour chart of gold:
It broke through the 3300 mark in the early Asian session on Monday and is currently maintained near 3310. However, from the current point of view, the decline of gold has not been completed. From the trend point of view, gold must at least test the position near 3280 and 3250 before there will be a relative chance of rebound. Once it falls below 3250, gold may not have a chance to rebound, and it will officially enter a bearish trend, and it will be greeted by a bearish trend at the daily level.
From the hourly chart, if it cannot stabilize above 3310, then gold is likely to fall, and see whether it will break through 3280 or 3250. On the contrary, if it stabilizes above 3310, it may hit the early high near 3320 again. However, as long as it cannot stabilize above 3325, gold will still fall. Now you should pay attention to where to short gold.
Operation strategy:
If the price cannot stabilize above 3310, you can short near 3310.
If it stabilizes above 3310, you can wait for short near 3320.
In the new week, is gold brewing a new market?Information summary:
This week, the market continued to be affected by Trump's tariff policy and the progress of negotiations. On Thursday, the phone call between the Chinese and US heads of state boosted market sentiment. In the early stage, the precious metals market ushered in a collective rise, and the prices of silver and gold performed strongly. Silver rose to a 13-year high on Thursday, breaking through $36 for the first time since February 2012.
After gold hit the $3,400 mark during trading on Thursday, the US dollar rose as friendly talks between China and the United States stimulated the rise of the US dollar; gold fell rapidly and gave up all the gains during the day. On Friday, the US stock market closed at its highest level since February due to the boost of non-agricultural data.
Gold continued its retreat trend again, closing at around 3,310 as of Friday.
Market analysis:
From the trend of the US dollar, there is already an opportunity to bottom out, and the trend at the beginning of the week is critical.
Once the US dollar stands above 99.5 at the beginning of the week, it will continue to touch the 100.0--100.2 mark.
If it stabilizes above this position, gold will most likely fall below 3300 next week.
First, from the weekly chart:
The current moving average support below the weekly line is almost at 3250-3260. If it can hold here, gold may continue to maintain consolidation and wait for an opportunity to choose a new trend. However, if it falls below 3250, it can fall to the 3200 mark. If 3200 falls below again, it will be the low point of 3100.
It can also be seen from the daily chart that the important position of gold is at 3318-3280. If it stands above 3318, gold is in a bullish upward trend. If it falls below 3280, gold will enter a bearish trend. At present, gold has closed below 3318, so from the daily line, the next target is around 3280. If 3280 falls below again, then as the weekly analysis shows, it will test 3250-3260. However, judging from the daily chart, I think the market will not go down too easily.
Therefore, I guess that gold may follow the head and shoulders top structure of the daily chart next week. It may fall to 3250-3260 at the beginning of the week to lure short sellers into the market, and then stretch and rebound to around 3350 to form a shoulder position. Finally, it will directly dive down to around 3150.
The Asian market is about to open, and I hope my analysis can help everyone make some profits in the market. A new week is about to begin, and I wish you all good luck.
Gold will still fall below 3,300 next week!
📣World Situation:
Gold prices fell for the second consecutive trading day on Friday, but are still expected to close with a gain of more than 1.30% as traders readjusted expectations for Fed policy easing after a stronger-than-expected US non-farm payrolls report. At the time of writing, XAU/USD was trading at $3,322, down 0.84% on a daily basis.
The US Bureau of Labor Statistics (BLS) reported that the labor market continued to show resilience, with the unemployment rate remaining stable from April. Meanwhile, Wall Street rebounded modestly from Thursday's losses despite increased political tensions between President Donald Trump and Tesla CEO Elon Musk after the House of Representatives approved a bill to raise the US debt ceiling.
Next Wednesday: ① Data: API crude oil inventory in the United States for the week ending June 6, US May unadjusted CPI annual rate, May seasonally adjusted CPI monthly rate, May seasonally adjusted core CPI monthly rate, May unadjusted core CPI annual rate, pay attention to real-time data changes.
Geopolitical risks and trade tensions have eased, and the call between Chinese and American leaders has released a signal of easing. Trump said that the trade negotiations have reached a "positive conclusion", weakening the attractiveness of gold as a safe-haven asset.
🔥 Technical side:
Based on the resistance and support levels of gold prices on the 4-hour chart, NOVA sorted out the important key areas as follows:
Resistance: $3347, $3400
Support: $3252, $3202
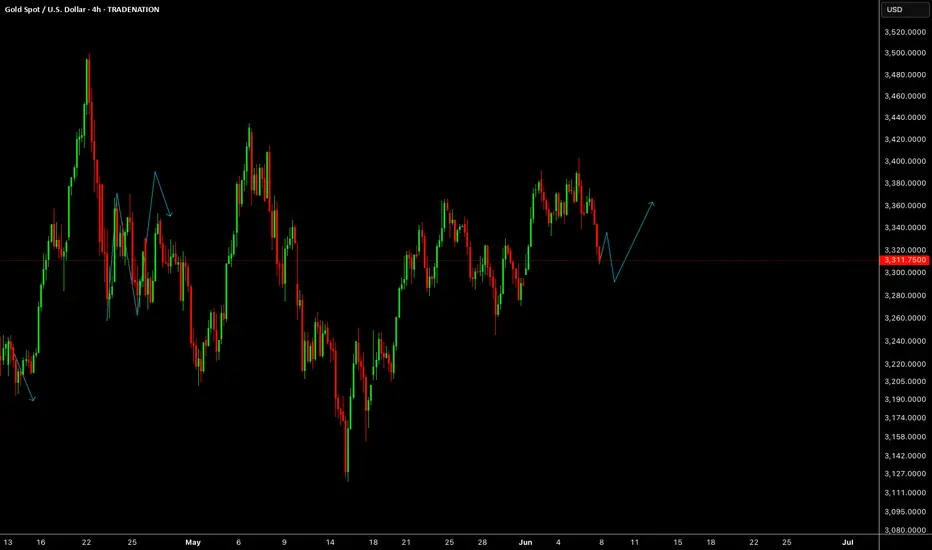
GOLDGOLD is getting ready to go the reaction level before giving us further upside.
Disclosure: We are part of Trade Nation's Influencer program and receive a monthly fee for using their TradingView charts in our analysis.
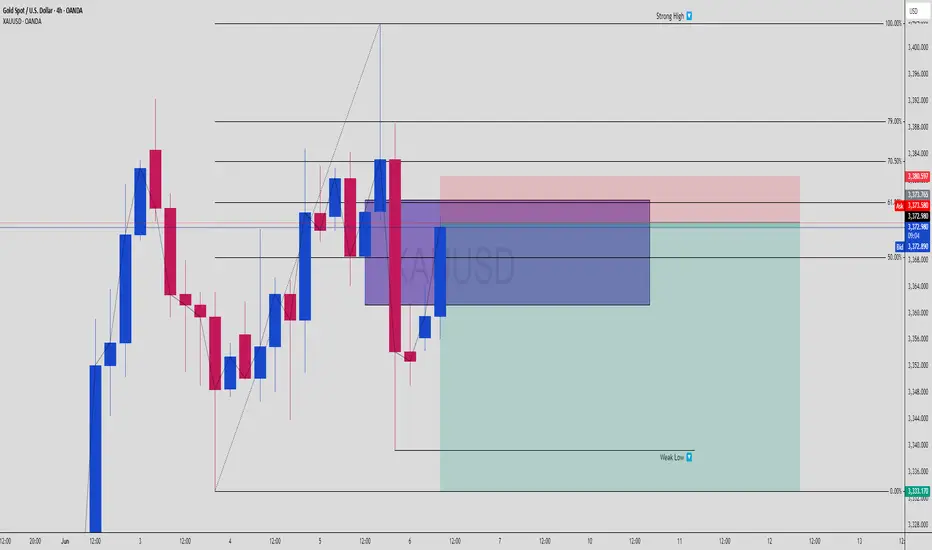
XAUUSD Bearish Setup! OB Rejection + FVG + 61.8% Fib PremiumGold (XAUUSD) | 4H Chart – High-Probability Bearish Setup
XAUUSD is setting up for a bearish move as price taps into a premium zone confluence, including an Order Block (OB), Fair Value Gap (FVG), and a 61.8% Fibonacci retracement. Smart Money Concepts (SMC) traders will recognize this setup as a textbook scenario for a bearish continuation toward a Weak Low target.
🔍 SMC Breakdown:
Market Structure:
The market has shifted bearish after breaking the previous low and forming a lower high. The internal structure confirms bearish order flow, giving us confidence in continuation to the downside.
Liquidity & Inefficiency Play:
Recent sweep of buy-side liquidity above minor highs.
Rejection at premium pricing indicates Smart Money has triggered sell programs.
Internal liquidity pools were engineered and swept, confirming manipulation.
Entry Confluence Zone (Kill Zone):
🔴 Order Block (OB):
3,372 – 3,380 — bearish OB formed before strong impulse move.
🟣 Fair Value Gap (FVG):
Perfect overlap with the OB, leaving a gap that price has now rebalanced into.
📐 Fibonacci Levels from Swing Low to High:
61.8% = 3,373
70.5% = 3,377
79% = 3,380
This entire zone aligns with institutional premium pricing — the high-probability reversal range.
📉 Bearish Projection:
Expecting price to reject from OB/FVG zone and move toward the discount zone, targeting unmitigated lows and imbalance fills.
Key Downside Targets:
50% = 3,368
Full Extension = 3,333 (Aligned with Weak Low)
This level also sits near the 0.00% Fib level — a clean liquidity magnet.
🧠 Chart Ninja Entry Plan:
🔹 Entry: 3,373 – 3,380 (OB + FVG + Fib Premium)
🔻 Stop Loss: Above 3,381 (invalidate OB)
📉 Take Profit: 3,333 (Weak Low + Fib Completion)
⚖ RRR: ~1:4+ — high-confluence sniper setup
💬 Ninja Wisdom:
You're not trading random candles — you're trading intentional liquidity shifts.
This setup screams Smart Money footprint: OB rejection + inefficiency fill + premium pricing.
Be the sniper — not the trigger-happy retail trader. 🥷🎯
📍 Save this setup before it plays out — backtest and learn from it!
🔁 Drop your analysis below – agree or see it differently?
👣 Follow @ChartNinjas88 for daily institutional-grade setups on Gold & more!
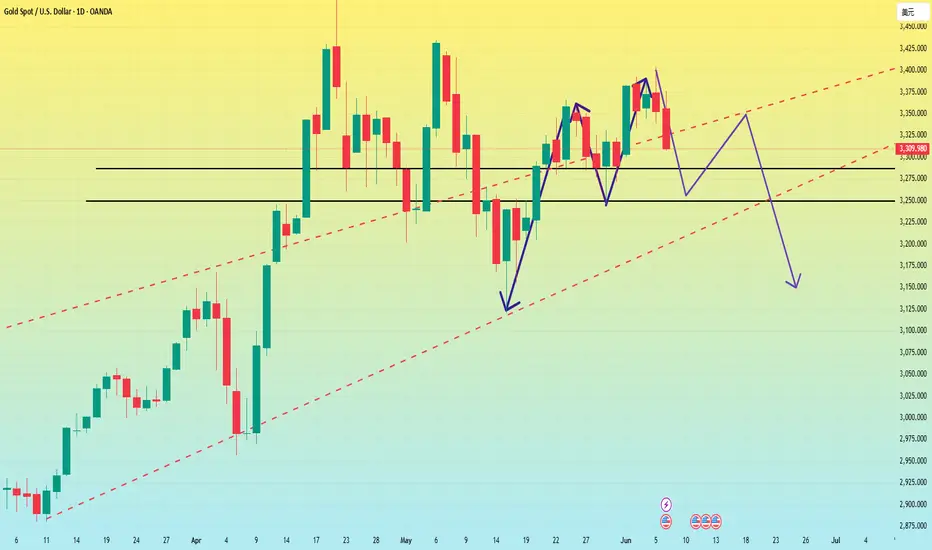
Gold plunges, what will be the trend next week?From the daily chart:
Since the last round of breaking the triangle convergence oscillation and breaking the trend line, gold has surged to 3400, but the upward momentum is insufficient and it has retreated. The low point of the retreat on Friday happened to be the support level of the previous triangle convergence trend line near 3300. If it falls below, the price will return to the triangle convergence oscillation range, and the gold price may fall further;
From the perspective of gold 1 hour, the MA5-day and 10-day moving averages have formed a dead cross downward, so gold still has downward momentum. After the gold 1-hour high box oscillation, gold finally broke through the box downward, indicating that the gold shorts are better, so the bottom of the gold box has now formed resistance, and the gold short-term resistance to gold has been formed near 3335. If gold is 3335 at the beginning of next week, then gold can continue to be short.
Next week's operation strategy is still around the 3285-3335 range.
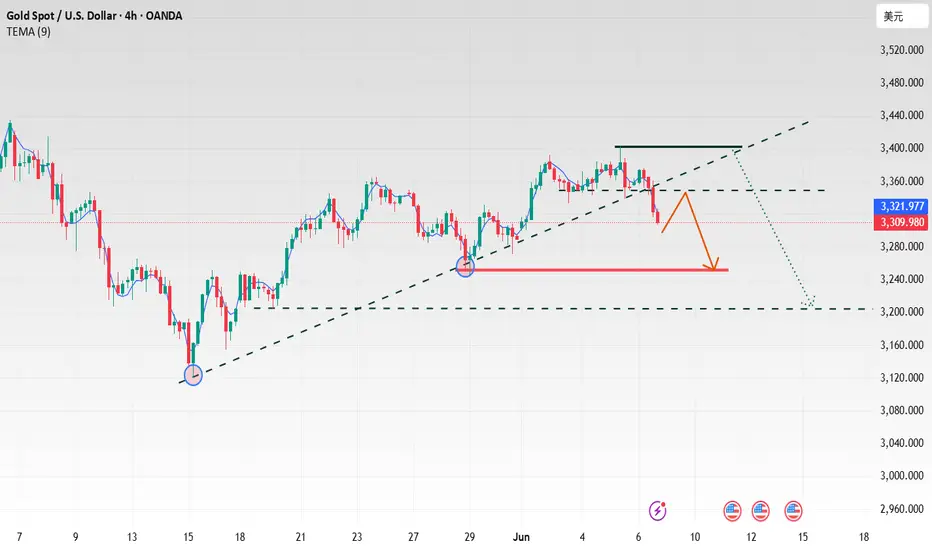
GOLD H4 Weekly Chart Update For 9-13 June 25Hello Trader,
As you can see that there are some crucial levels appear in the chart, right market sustain above 3300 Psychological Level if market break 3300 Psychological Level Successfully then it will might be testing 325+-60 zone
Above 3300 Psychological Level Market will move towards 3326 level or even 3345
Furthermore kindly check all mentioned zone in the chart carefully
Disclaimer: Forex is Risky
