Trade Breakdown: XAUUSD 15-Min | Liquidity Grab + Reversal PlayOANDA:XAUUSD
Psychological Setup
This trade is rooted in the psychology of smart money and retail behavior. After a sharp drop in price, most retail traders expect continuation (trend-following). However, institutions often manipulate liquidity zones — hunting for stop-losses before a true reversal. This trade capitalizes on that behavior.
🔍 Technical Explanation:
🔻 1. Market Structure:
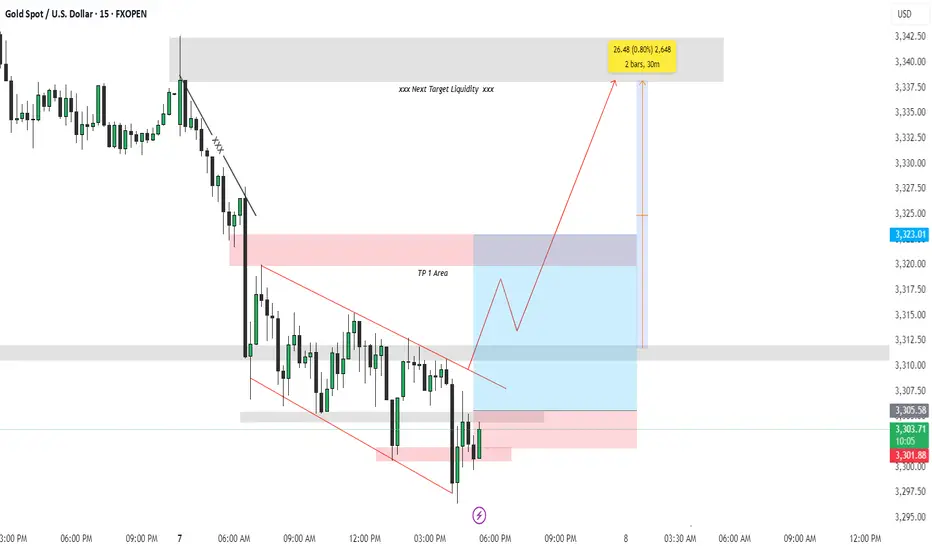
Price was previously in a downtrend, forming lower highs and lower lows.
A falling wedge pattern (red lines) formed after a strong bearish move, signaling potential bullish reversal.
Price broke the wedge to the upside — a classic reversal signal.
🔁 2. Liquidity Concept:
Below the wedge: The market grabbed liquidity by taking out stop losses of buyers who entered too early.
Above the wedge (TP Areas):
TP 1 Area (red box): This is the first logical resistance where previous supply sits — many sellers will enter here, providing buy-side liquidity.
Next Target Liquidity (grey box above): This is a major imbalance zone and likely where stop-losses of early short sellers are stacked.
Price is expected to grab liquidity from that area (marked by the red arrow).
✅ Entry & Trade Logic:
Entry Zone: After liquidity was swept at the bottom of the wedge, a bullish engulfing candle formed near demand — signaling institutional interest.
Risk-Reward Setup:
Targeting 0.80% move (approx. 26.48 points).
Trade is based on reversal from demand zone + wedge breakout + liquidity grab confirmation.
🎯 Target Projections:
TP1 Area: Conservative target, just above recent structure.
Final Target: High-probability liquidity zone where market is drawn to clean up resting orders (grey zone).
🧠 Why This Trade Matters (Trading Psychology Insight):
Most retail traders get trapped in emotional entries — entering shorts after a drop or longs too early in a wedge.
Smart money waits for liquidity sweeps before moving price in the desired direction.
This setup shows the importance of patience, structure, and understanding market psychology rather than reacting emotionally to price action.
📌 Key Takeaways:
📉 Trap: Falling wedge builds false bearish confidence.
🧠 Psychology: Stop hunts create fuel for reversal.
📈 Reaction: Smart money absorbs liquidity, moves price toward next inefficiency.
Hashtags:
#XAUUSD #SmartMoney #LiquidityHunt #TradingPsychology #GoldTrade #PriceAction #WedgeBreakout #FXOpen #TechnicalAnalysis #SupplyDemand
Goldpsychologicallevel
Gold at a Psychological Level Gold has now risen to 100 times its previously fixed price of $35 per ounce.
Is this a psychological milestone signaling a correction ahead, or is there still more upside potential?
Under the Gold Reserve Act of 1934, gold was officially priced at $35, a rate maintained until 1971, when President Nixon suspended the dollar’s convertibility into gold, effectively ending the gold standard. This historic move, known as the “Nixon Shock,” allowed gold to trade freely in the market. By December the same year, the market price had already climbed to around $43–44 per ounce.
So why has gold risen from $35 to $3,500?
Gold is widely recognized as a hedge against inflation—but in reality, it has proven to be more than that.
Let’s consider this:
If inflation had compounded at the target rate of 2% per year since 1971, gold should be priced at $102 today.
But at $3,500, the also implied that the compounded annual growth rate is around 8.9%.
So, what explains this outperformance?
One key driver is the expansion of the money supply, especially through debt, and more critically, debt financed by money printing.
Periods of high inflation are can be preceded by an unjustified increase in the money supply, not backed by corresponding income or production output.
In 2018, we saw the beginning of Trump’s Tariff 1.0. Since the anticipation of Trump’s Tariff 2.0, I’ve incorporated a framework I call the QTD Matrix—which stands for Quantitative Easing, Tariffs, and Debt—to track the trajectory of gold prices.
As long as we continue to see:
• Central banks deploying Quantitative Easing during crises,
• Ongoing or escalating Tariff wars, and
• Persistent growth in national Debt,
It is reasonable to expect gold to remain firm and potentially break into new highs.
Historical Observations:
• Let’s start with Gold vs QE. Each major wave of QE has triggered a significant rally in gold—from Japan’s QE in 2001, to US QE1, QE2, and QE3 following the 2008 crisis, and the massive Covid-era QE in 2020.
• Next Gold vs Tariffs. When Trump’s Tariff 1.0 was announced in August 2018, gold pivoted on that very day and began trending higher.
In October 2022, Biden’s export controls on advanced chips acted as a tariff-equivalent event, once again prompting gold to rise.
After Trump's re-election in November last year, markets began pricing in Tariff 2.0, and gold responded by trending upward once more.
• Finally Gold vs Debt. Gold has also moved in close tandem with the rising US debt over the years.
As of now, I believe that QE (Q), Tariffs (T), and Debt (D) will remain in play.
Hence, it's reasonable to expect:
• The cost of living to remain elevated,
• Inflationary pressures to persist, and
• Gold prices to continue their long-term uptrend.
That said, I’m also noticing technical and psychological resistance in the mid-term after it reached $3,500.
This is a quarterly chart, once I have identified its primary uptrend line, I would like to mirror it to its significant peak (going back way back the 1980s, a period of high inflation), which appears to intersect around the psychological level of $3,500.
With the trade war currently on pause, gold may temporarily take a breather. But as long as QTD remains intact, it may just be a matter of time before gold tests its recent resistance—and, if broken, continues its upward trajectory.
We should also ask:
Is there any possibility that the Q, T, or D could shift in the opposite direction?
If so, that could be a positive sign for equity markets.
Micro Gold Futures & Options
Ticker: MGC
Minimum fluctuation:
0.10 per troy ounce = $1.00
Disclaimer:
• What presented here is not a recommendation, please consult your licensed broker.
• Our mission is to create lateral thinking skills for every investor and trader, knowing when to take a calculated risk with market uncertainty and a bolder risk when opportunity arises.
CME Real-time Market Data help identify trading set-ups in real-time and express my market views. If you have futures in your trading portfolio, you can check out on CME Group data plans available that suit your trading needs tradingview.sweetlogin.com
Trading the Micro: www.cmegroup.com
www.cmegroup.com
