Gold Pulls Back to 3332 Before Mild Rebound📊 Market Overview:
This morning, gold dropped sharply to $3,332/oz, marking the lowest level in recent sessions, due to profit-taking after the early-week rally and a slight recovery in the USD.
However, dip-buying interest returned near key support, pushing the price back up to around $3,350/oz.
The market remains sensitive to Middle East geopolitical headlines and comments from Fed officials scheduled throughout the week.
📉 Technical Analysis:
• Resistance: $3,360 – $3,370
• Support: $3,332 – $3,340 (tested this morning)
• EMA 09: Price is currently below EMA09 ($3,355) → short-term trend remains slightly bearish
• Momentum / Volume / Candlesticks:
o H1 candle shows a bullish hammer formation at $3,332 → signal of potential short-term rebound.
o RSI recovered from oversold (<30) to ~42 → mildly positive signal.
o StochRSI indicates short-term buying pressure, but a break above $3,355 is needed to confirm a reversal.
📌 Outlook:
Gold may see a mild recovery toward the $3,360–3,370 area if buying interest holds near the $3,330 support. However, failure to break above $3,370 could lead to a pullback during the US session.
💡 Suggested Trading Plan:
🔻 SELL XAU/USD at: $3,365–3,370
🎯 TP: $3,345 (~20)
❌ SL: $3,375
🔺 BUY XAU/USD at: $3,332–3,340
🎯 TP: $3,355 (~20)
❌ SL: $3,325
Goldsell

Gold is under pressure and continues to focus on weekly support
The Israeli-Iranian conflict that broke out on June 13th lasted for 12 days before a ceasefire agreement was reached. Iran retaliated against the US military base but did not block energy transportation. Trump called its response weak, and market concerns cooled. Gold and oil prices gave up their gains. Spot gold closed at $3,368.98 per ounce, close to flat. U.S. crude oil fell 9% from a 5% increase. Trump announced on Tuesday that Israel and Iran had reached a ceasefire agreement. After mediation by Qatar, Iran agreed, and Israel also hoped to end the conflict within a few days.
Gold fell as the situation eased and the demand for safe-haven assets weakened. Oil prices fell more due to the lack of risk in the Strait of Hormuz, and U.S. stock index futures rose. Federal Reserve Vice Chairman Bowman unexpectedly said that interest rates may be cut in July. U.S. Treasury yields fell and the U.S. dollar index fell, but did not support gold prices. The U.S. economy is facing inflation and growth slowdown pressure. If the situation in the Middle East worsens, oil prices may soar, exacerbating the risk of stagflation. Short-term ceasefires and differences with the Federal Reserve suppress gold prices. Medium- and long-term geopolitical risks and expectations of interest rate cuts support gold. Investors can pay attention to relevant developments and diversify their allocations.
In terms of gold, the overall price of gold fell on Monday. The highest price rose to 3396.68 on the day, and the lowest price fell to 3346.92, closing at 3368.94. On Monday, gold jumped higher in the early trading, and then came under pressure again. It continued to rise after the European and US trading to test the opening high. The price fell very weakly overnight, and finally ended with a big negative. At present, gold is still in a volatile decline.
From a multi-cycle analysis, first observe the monthly rhythm. The price ran according to the rhythm in May as the author said, and finally in a cross state. For June, focus on the gains and losses of the highs and lows in May. The price will only be a real break if it really closes above this position. The long-term watershed is at 2780. From a weekly level, the gold price is supported by the 3280 regional support level. From a mid-term perspective, we are still in a mid-term bullish position, but we need to pay attention to the market's retracement to the weekly support. At the same time, the price will be further under pressure only if it breaks the weekly support. From the daily level, the price breaks the 3365 daily watershed. The overall follow-up still focuses on the pressure performance, and the focus below is on the retracement to the weekly support. At the same time, according to the four-hour level, we need to pay attention to the 3360 position temporarily. Since gold is currently in a volatile decline, it will continue to be short before breaking 3405. In the short term, we will first focus on the four-hour and daily resistance pressure, and focus on the 3320 and 3280 area support below.
Gold 3360 and 3365 range is under pressure, and the target is 3320-3280
Conflict breaks out, risk aversion rises, can 3400 be broken?Bowman's dovish comments in the afternoon eased the market, by which time risk aversion was deepening as sudden geopolitical conflicts continued to deepen. Will the USA make a corresponding response to this matter? This series of events has once again put gold into a complicated situation. Can gold hit the 3,400 mark today?
Free trading strategies are updated daily🌐. All trading strategies released since this month have been verified and can serve as a good reference📈.👇 I sincerely hope that these strategies can be helpful to you👇.
OANDA:XAUUSD FX:XAUUSD FOREXCOM:XAUUSD FXOPEN:XAUUSD TVC:GOLD
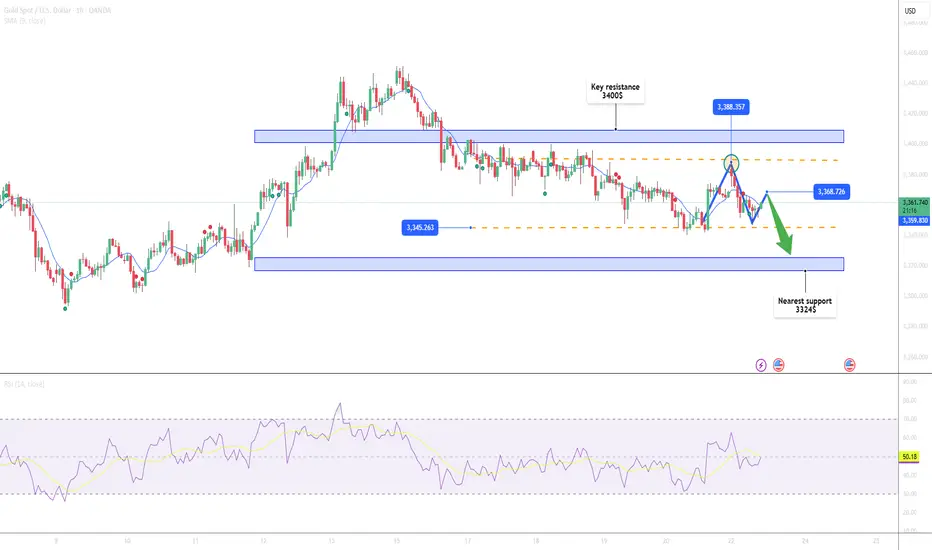
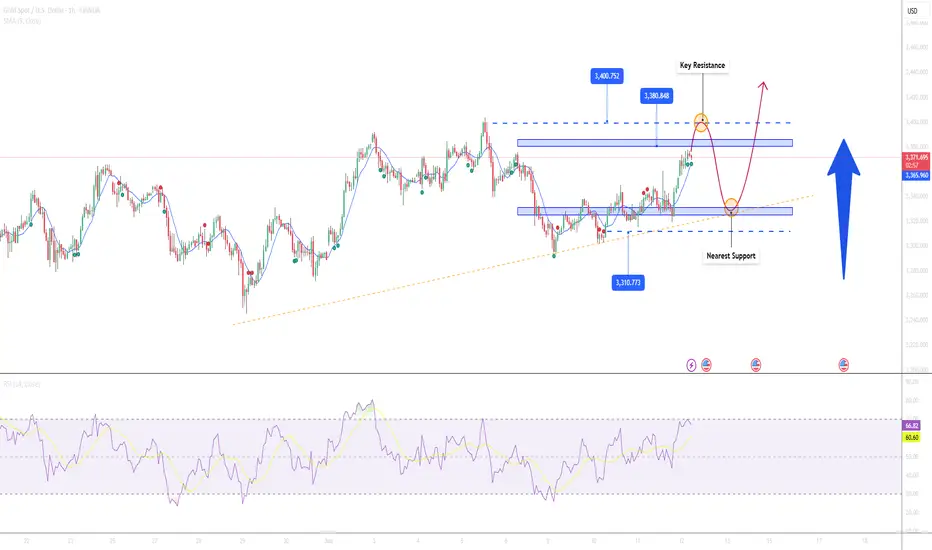
Gold Falling Toward 3345 Support📊 Market Overview
After failing to break the 3,389 resistance zone this morning, gold remains under pressure from profit-taking and a stronger USD. The price has dropped to around $3,360/oz, reflecting defensive sentiment amid ongoing geopolitical tensions in the Middle East.
📉 Technical Analysis
• Key Resistance: 3,389 – 3,400
• Nearest Support: 3,345 – 3,324
• EMA-09: Price is below the EMA-09 on the H1 chart → short-term bearish trend
• Candle Patterns / Volume / Momentum:
o M15 & H1 candles remain bearish
o RSI hovers around 45 → indicating continued correction
o No clear reversal signals yet
📌 Outlook
Gold may continue to decline slightly in the short term if the USD stays strong and no geopolitical surprises arise. However, the 3345 support zone could attract dip buyers.
________________________________________
💡 Suggested Trading Strategy
🔻 SELL XAU/USD at: 3,360 – 3,365
🎯 TP: 3,335 – 3,325
❌ SL: 3,372
🔺 BUY XAU/USD at: 3,320 – 3,324
🎯 TP: 3,340 – 3,344
❌ SL: 3,310
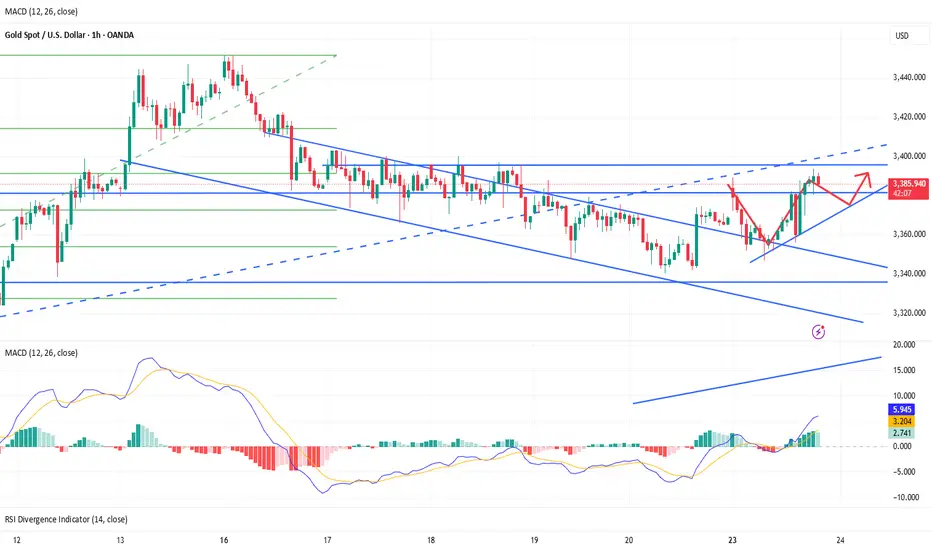
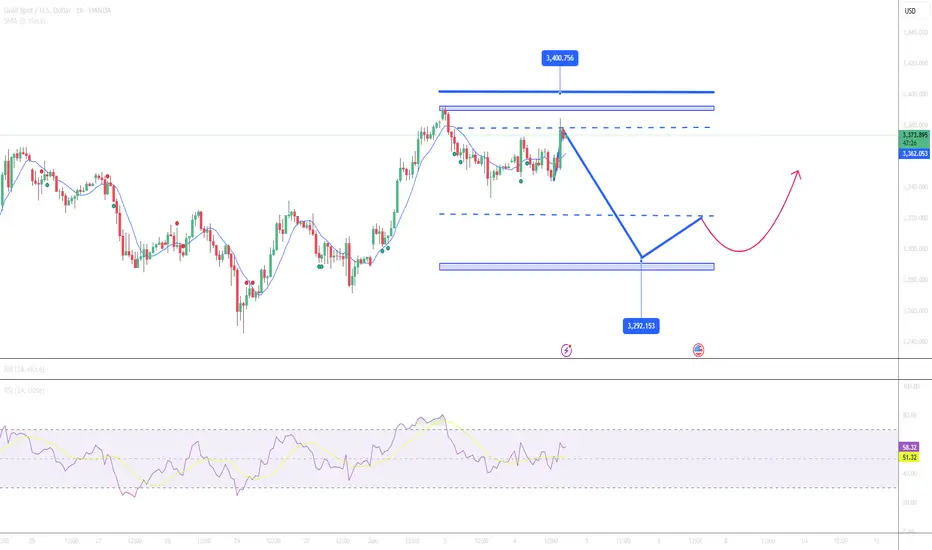
Gold Weekly Friday Trend Analysis and Trading RecommendationsOn Thursday, gold maintained a sideways trend, currently trading near $3,370. It hit a low of $3,347 and then rebounded immediately, while yesterday's Federal Reserve interest rate decision had little impact on market volatility. Since Monday, when bearish forces were stronger than bullish ones, the gold market has been seeing equalized bullish and bearish forces, consolidating as it waits for the next stimulus direction.
Once it stabilizes above $3,400 again, there is likely to be an inflection point, and it will gradually rise to test the upper track at $3,460–3,470. At the 4-hour level, it is currently under pressure at the middle track of $3,405, with support at $3,345.
Gold may break out of the current range on Friday. Intraday trading can focus on range operations between the support of $3,345 and the resistance of $3,400: when the gold price stabilizes above $3,360, you can lightly go long, with targets sequentially at $3,375 and $3,395; if it is resisted below $3,395, you can try to lightly go short.
XAUUSD
buy@3350-3360
tp:3380-3390-3400
Investment itself is not the source of risk; it is only when investment behavior escapes rational control that risks lie in wait. In the trading process, always bear in mind that restraining impulsiveness is the primary criterion for success. I share trading signals daily, and all signals have been accurate without error for a full month. Regardless of your past profits or losses, with my assistance, you have the hope to achieve a breakthrough in your investment.
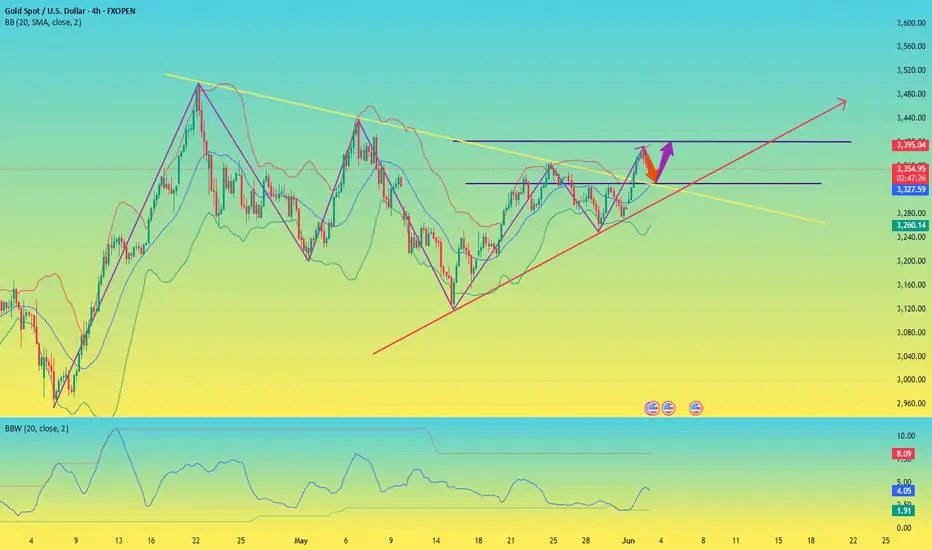
The bulls are not dead yet, it’s time to ambush at low levels!Gold only opened higher and rose on Monday this week, and then reached the highest level of 3452, and then started the road of shock and retracement this week. As of today, Friday, gold is still oscillating and adjusting in the lower range, but from the 4-hour market trend, the trend of gold is still dominated by bulls. In the short term, gold is oscillating and adjusting at a low level. Today, Friday, we will first focus on the support level of 3347-3353 below, which is also the starting point of the rebound yesterday. If this position is not broken today, Friday, we will mainly rebound and close.
From the 4-hour analysis, the support below focuses on 3347-3353, and the short-term resistance above focuses on the 3378-3385 level, with a focus on the 3408-3415 level. Continue to rely on this range to maintain the main tone of high-altitude low-multiple cycle participation unchanged, and the middle position is always more watchful and less active, cautiously chase orders, and patiently wait for key points to enter the market.
Gold operation strategy: Go long when gold falls back to 3347-3355, with a target of 3370-3380.
If you still lack direction in gold trading, you might as well try to follow my pace. The strategy is open and transparent, and the execution logic is clear and definite, which may bring new breakthroughs to your trading. The real value does not rely on verbal promises, but is verified by the market and time.
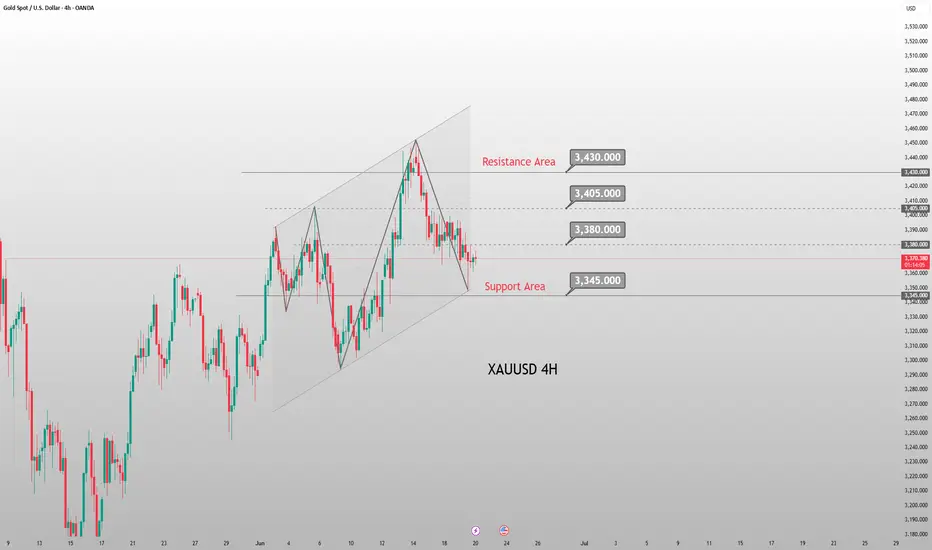
Accurate operation, both long and short gains!Gold has experienced a typical volatile market today, first rising to 3400 and then falling back to around 3380 as expected. The short order plan we arranged in advance was successfully closed, and we successfully took this wave of callback profits. What is more worth mentioning is that we also accurately entered the long order in the previous round of retracement and steadily harvested the rebound profits. The rhythm of long and short switching is smooth, the strategy is clear, and the execution is decisive - this is what trading should be like. The market is repetitive, and opportunities are always there. Whether you can put the profit steadily into your pocket depends not on how many times you are right, but on whether you can execute it at the key points.
At present, the trend of gold shows that although there is a rebound after each decline, the strength is generally weak and it has never been able to break through the 3405 suppression level. The overall situation is still in a range of fluctuations, and market sentiment is still waiting for further guidance from the Fed. Therefore, short-term operations are still based on key points, and the market rhythm is slow, requiring more patience. In the case of no break at present, continue today's thinking to operate, unless there are sharp fluctuations in the short term or sudden news or geopolitical situations, then make adjustments.
Gold operation suggestions: 1. Gold short orders: short near 3397-3405, target 3385-3375. 2. Gold long orders: long near 3375-3370, 3365-3360 can cover positions, target 3380-3390-3400.
If you still lack direction in gold trading, you might as well try to follow my pace. The strategy is open and transparent, and the execution logic is clear and definite, which may bring new breakthroughs to your trading. The real value does not rely on verbal promises, but is verified by the market and time.

Gold Extends Gains, Eyes 3400📊 Market Overview
• Following softer-than-expected US CPI data, gold surged strongly.
• This morning, gold touched a high of 3377 before pulling back slightly to around 3372.
• A weaker USD and growing expectations of Fed rate cuts remain key bullish drivers.
📉 Technical Analysis
• Key Resistance: $3,380 – $3,400
• Nearest Support: $3,325 – $3,310
• EMA09: Price remains above EMA09, signaling a short-term uptrend.
• Candlestick & Momentum: Gold has broken out of a consolidation zone with strong momentum, though short-term overbought signals are emerging.
📌 Outlook
Gold may enter a mild pullback within the 3370–3380 zone before finding fresh momentum from upcoming Fed signals or macro data. Caution is advised when trading near major resistance.
💡 Trading Strategy
🔻 SELL XAU/USD at: 3375–3377
🎯 TP: 3355
❌ SL: 3385
🔺 BUY XAU/USD at: 3325–3330
🎯 TP: 3350
❌ SL: 3315
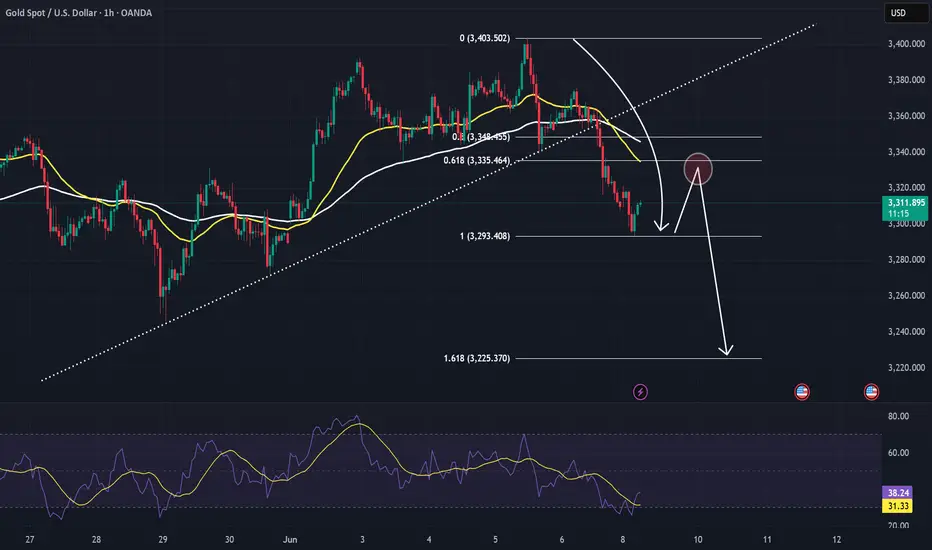
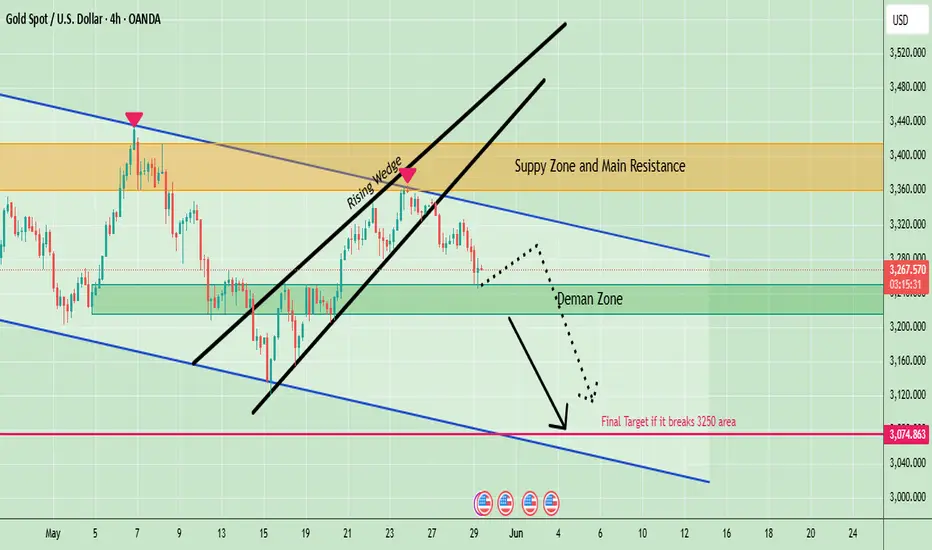
XAUUSD analysis - potential for pullback and continuationOANDA:XAUUSD is currently consolidating near $3,310 after a decisive breakdown below the ascending trendline, signaling a shift in the short-term structure from bullish to bearish. This breakdown was accompanied by strong bearish momentum, indicating that buyers have temporarily lost control of the market.
After the initial drop, the price is now attempting to retrace toward the 0.5–0.618 Fibonacci zone, with the 0.618 level located around $3,335. This zone also coincides with dynamic resistance from short-term moving averages (EMA cluster), making it an important confluence area. A rejection from this level would confirm a bearish retest, supporting the idea of a continuation toward the 1.618 Fibonacci extension near the $3,225 level.
However, if the price breaks and holds above $3,348, the bearish scenario will be invalidated, potentially signaling that buyers are regaining strength and may aim to reclaim higher resistance levels.
Traders are advised to wait for confirmation, such as a bearish engulfing candle, rejection wicks, or a surge in volume, before entering short positions. As always, this is a personal viewpoint, not financial advice. Trade with appropriate risk management.
Can Gold Reach $3400 This Week?📊 Market Overview:
On June 4, 2025, gold prices (XAU/USD) hovered around $3,370/oz after rebounding from the $3,333 level. However, selling pressure emerged as prices approached the strong resistance zone near $3,392–$3,400. Ongoing uncertainties regarding U.S.–China trade policies and expectations of a Federal Reserve rate cut continue to support safe-haven demand for gold.
📉 Technical Analysis:
• Key Resistance: $3,392 – $3,400
• Nearest Support: $3,333 – $3,320
• EMA 09: Price is currently above the 09 EMA, indicating a short-term uptrend.
• Candlestick Patterns / Volume / Momentum: The RSI on the H1 timeframe is at 59, suggesting bullish momentum remains but is approaching overbought territory.
📌 Outlook:
Gold may experience a short-term pullback if it fails to break above the $3,400 resistance level and profit-taking intensifies.
💡 Suggested Trading Strategy:
SELL XAU/USD at: $3,392 – $3,400
o 🎯 TP: $3,372
o ❌ SL: $3,410
BUY XAU/USD at: $3,320 – $3,333
o 🎯 TP: $3,352
o ❌ SL: $3,310
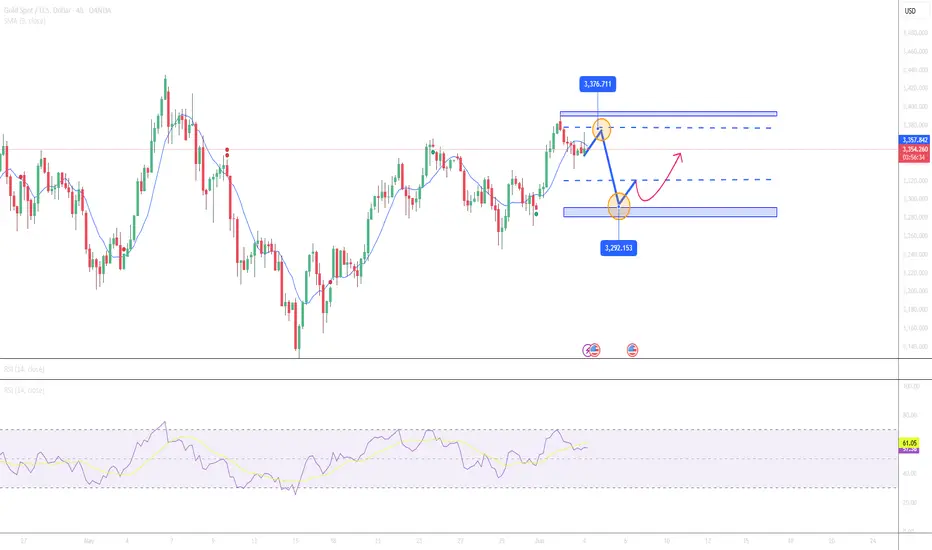
Gold liquidity run short setup In this video I map out the range using the fixed range tool and talk about the possibility of a liquidity run on the weekly high before dropping back inside the range .
Engineering liquidity at the range value area high and thus heightening the expectation for more upside continuation , take the liquidity at $3392 and pull back below the vah *Value area high and head down to fill the new week open gap and the new monthly pivots $3297 and the poc * point of control and remain rangebound.
We all know that nothing is set in stone and this is just an idea out of many but its something to consider .
Set alerts and wait for reaction and lower time frame for confirmation
Thanks for your support

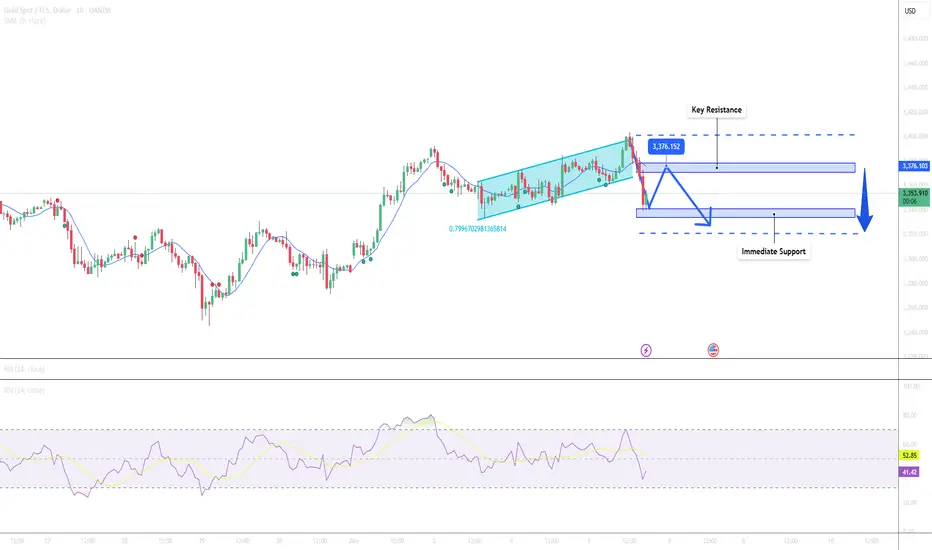
Gold May Undergo a Short-Term Downward Correction
📊 Market Overview
Gold prices are hovering around $3,348/oz, with the day's low near $3,340. Weak U.S. economic data, including a decline in the services PMI to 49.9 and low job growth, have reinforced expectations of a Federal Reserve rate cut. However, gold prices have yet to break through strong resistance levels due to profit-taking and cautious sentiment ahead of the upcoming Non-Farm Payrolls report.
📉 Technical Analysis
• Key Resistance: $3,370 – $3,375
• Immediate Support: $3,335 – $3,340
• EMA 09: Price is above the EMA 09 line, indicating a short-term uptrend.
• Candlestick Patterns / Volume / Momentum:
o MACD on H4 chart shows a golden cross, supporting the uptrend.
📌 Outlook
Gold may undergo a short-term correction if U.S. employment data exceeds expectations or if there are positive developments in international trade negotiations.
💡 Suggested Trading Strategy
SELL XAU/USD at: $3,370 – $3,375
o 🎯 TP: $3,350
o ❌ SL: $3,385
BUY XAU/USD at: $3,335 – $3,340
o 🎯 TP: $3,360
o ❌ SL: $3,325
Gold Holds Above Key Support – Eyes Still on 3400 (READ CAPTION)By examining the gold chart on the 4-hour timeframe, we can see that the price successfully hit the $3367 target exactly as expected, and then corrected back to $3346. Currently, gold is trading around $3358, and if it can hold above $3350, we can expect further upside. Based on the previous analysis, the next bullish targets remain at $3367, $3380, $3391, and $3400. (Maximum support is always appreciated, my friends!)
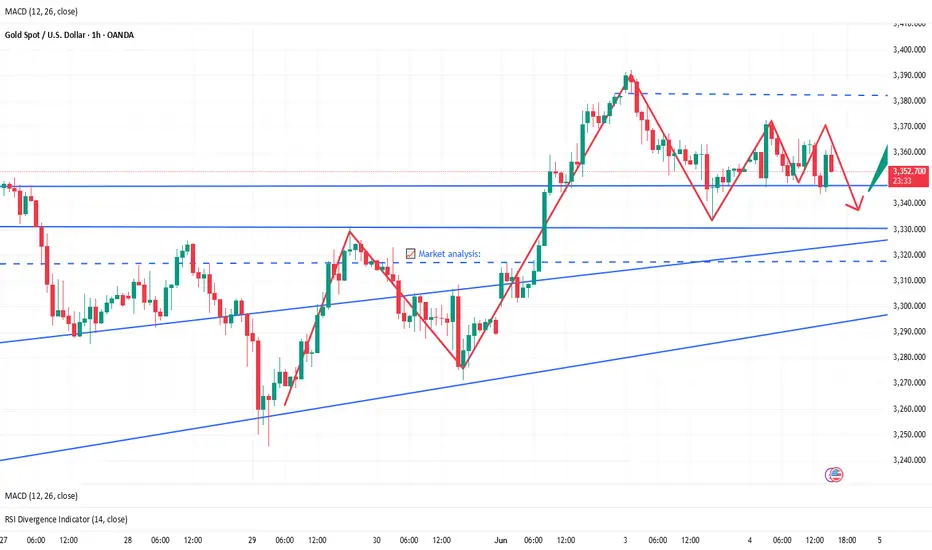
Market situation unclear? Check out this analysis📰 Impact of news:
1. ADP data is significantly positive
2. Trump: "Mr. Too Late" Fed Chairman Powell must cut interest rates now
📈 Market analysis:
The ADP data is significantly bullish, but we cannot rule out that this is an illusion created by the market, because although the daily line has formed a golden cross, it has not fully released the bullish momentum, and has not been able to exert force in the bullish upward trend. Therefore, I prefer to go long at a low position in the US market rather than chasing it immediately. At the same time, the upper 3365 may become a short-term strong pressure level. If the gold price encounters resistance here, the US market will usher in a retracement, and then it will be our time to go long.
🏅 Trading strategies:
SELL 3360-3365
TP 3340-3330
BUY 3330-3317
TP 3360-3370-3400
If you agree with this view, or have a better idea, please leave a message in the comment area. I look forward to hearing different voices.
TVC:GOLD FXOPEN:XAUUSD FOREXCOM:XAUUSD FX:XAUUSD OANDA:XAUUSD
Gold Technical Analysis - Bearish Reversal Confirmed?Gold (XAU/USD) is trading around $3,270 area, exhibiting a bearish trend influenced by technical breakdowns and macroeconomic factors. Gold is currently under pressure, with technical and fundamental factors aligning to suggest potential for further declines. Traders should monitor key support levels and upcoming economic data releases for signs of a reversal or continuation of the bearish trend.
📉 Technical Analysis
Gold has declined from recent highs near $3,370 , indicating a loss of bullish momentum.
The price has broken below the $3,280–$3,295 support zone, now acting as resistance, suggesting potential for further downside.
Key Support and Resistance Levels:
Resistance:
$3,280–$3,295: Immediate resistance zone.
$3,300–$3,310: Critical resistance area; a breakout above could indicate a bullish reversal.
Support:
$3,240–$3,245: Current support zone; a drop below may lead to further declines.
$3,200: Psychological support level; breaching this could accelerate bearish momentum.
🌐 Fundamental Factors
The U.S. dollar has strengthened due to the Federal Reserve's cautious stance on rate cuts, making gold less attractive as a non-yielding asset.
Economic Data:
Upcoming U.S. GDP and PCE data releases are anticipated to influence gold prices, with strong data potentially exerting further downward pressure.
Note
Please risk management in trading is a Key so use your money accordingly. If you like the idea then please like and boost. Thank you and Good Luck!
Gold Continues to Rise as USD Weakens📊 Market Overview:
Gold prices are rebounding slightly after a pullback from a four-week high. The weakening USD, driven by concerns over US-China trade tensions and upcoming employment data, has bolstered safe-haven demand for gold.
📉 Technical Analysis:
• Key Resistance: $3,365 – $3,377
• Nearest Support: $3,320 – $3,290
• EMA 09: Price is above the 09 EMA, indicating a short-term uptrend.
• RSI: The RSI on the H4 timeframe is at 64.06, suggesting bullish momentum with room before reaching overbought territory
📌 Outlook:
Gold may continue its short-term rise if the USD remains weak and US employment data falls short of expectations.
💡 Suggested Trading Strategy:
SELL XAU/USD at: $3,377
o 🎯 TP: $3,357
o ❌ SL: $3,387
BUY XAU/USD at: $3,290
o 🎯 TP: $3,310
o ❌ SL: $3,280
Hammer time on DailyThe question is the same "where the price is heading?" well... first of all you have to look in many dimentions and what i am exposing here is: what did it do the last 2 times price reached 380$ far away from 200 ema on daily chart is a corrective wave! as one of the most "must be aware" theory is... "too far - too fast, lead to correction"
I am a long term trader i mainly trade swings on the spots i think that will make a U-turn on large time frames with confirmations on lower time-frames and i stick/trade based on the main plan on the large timeframe and we do see in 1h-2h that it's on a sideway so these are 2 tipes of confirmations and now is up to you to find a 3rd confirmation... my idea is sell it - hold it! small lot + time is the formula of swings.

Gold is testing support
On the first trading day of June, gold and silver both rose sharply, especially silver, which rose by more than 5% in a single day and set a new high this year. Next, silver may be the main field.
In the short term, the market is affected by the ever-changing tariffs and tense geopolitical situation, which has led to the resurgence of risk aversion and pushed up the gold price.
As for silver, the long-suppressed emotions finally broke out. After the gold price rose continuously to a record high, only silver did not rise. I have repeatedly emphasized in the article that looking at the entire macroeconomic fundamentals, the factors supporting gold to rise first and silver to continue to rise are relatively clear.
The world's largest gold ETF has increased its holdings for two consecutive trading days, and silver has increased its holdings for six consecutive trading days. Such continuous increase in holdings is relatively rare, and it can also drive the positive sentiment of the market and increase buying power. Therefore, as far as silver is concerned, the rise is far from over.
Gold held its gains after yesterday's surge. The daily line recorded a real big positive, and the price remained above the moving average of each period. The upper Bollinger upper rail was suppressed. Fortunately, the short-term indicators continued to maintain an upward trend, which was in line with the K-line trend. The daily line tended to be bullish.
Due to yesterday's excessive increase and no data and events to support it today, the momentum for continued rise was insufficient, and the retracement was normal. However, the idea of falling back and then bullish remained unchanged.
So far, the gold price has fallen back to the low of 3350, which is regarded as an effective technical support. If this level is broken, the support below will be in the 3330-3325 area. During the stable period, it will wait for the further support area below the fall to intervene in the long bullish position. The pressure is at the first target of 3380 and the second target is at the 3400 mark.
Gold remains up at the beginning of this week
📌 Gold Consulting
Gold prices rose sharply on Monday, reaching their highest level in more than four weeks, affected by the escalation of geopolitical risks caused by the conflict between Russia and Ukraine. The re-escalation of trade tensions between China and the United States prompted investors to buy gold throughout the day. As of this writing, XAU/USD is trading at $3,377, up 2.70%.
Market sentiment turned sour on news that Ukraine launched an airstrike against Russia, destroying long-range bombers and other aircraft. Meanwhile, US President Trump doubled the tariffs on steel and aluminum imports to 50%, effective June 4, and his remarks against China led to a decline in US and global stock markets. CNBC
Reports said that Trump and Chinese President Xi Jinping may talk this week, but not on Monday.
📊Comment Analysis
Gold prices maintained their upward momentum at the beginning of this week, but tariff tensions and war with Russia remain unpredictable. Gold prices are supported and will return to the 3400 area.
💰Strategy Package
🔥Sell Gold Zone: 3409-3411 SL 3416
TP1: $3400
TP2: $3388
TP3: $3372
🔥Buy Gold Zone: $3313-$3315 SL $3308
TP1: $3327
TP2: $3340
TP3: $3355
⭐️ Note: Labaron hopes that traders can properly manage their funds
- Choose the number of lots that matches your funds
- Profit is 4-7% of the fund account
- Stop loss is 1-3% of the fund account

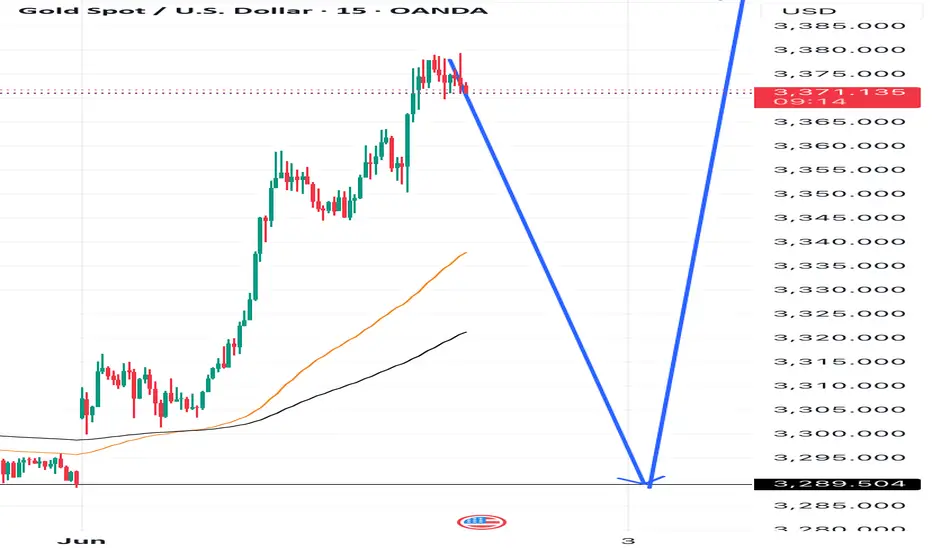
Gold Sell Gold rebounded on a $100 move from 3271 to $3379. I believe this resistance zone will honor the gap downward at $3289.42 and bounce to $3,700 before the EOY.
This is not financial advice.
Good luck
-R2C
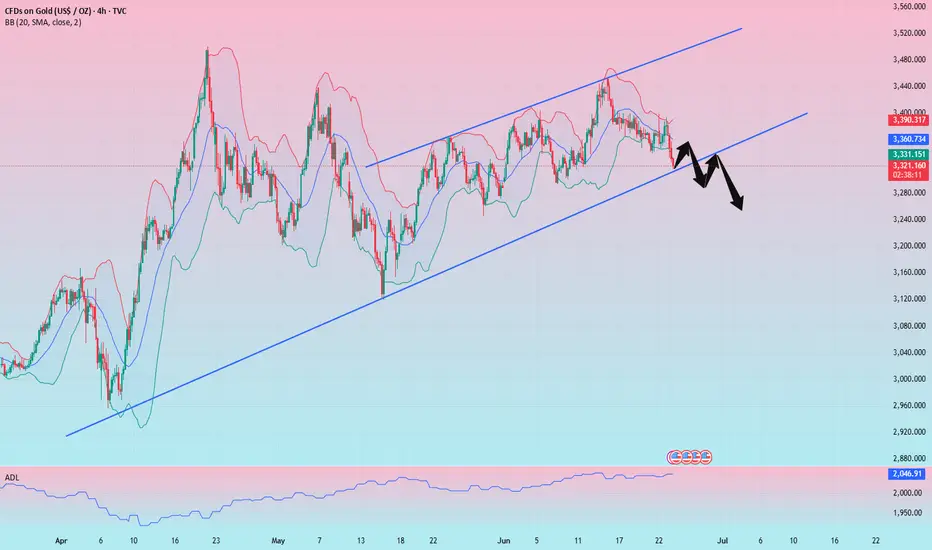
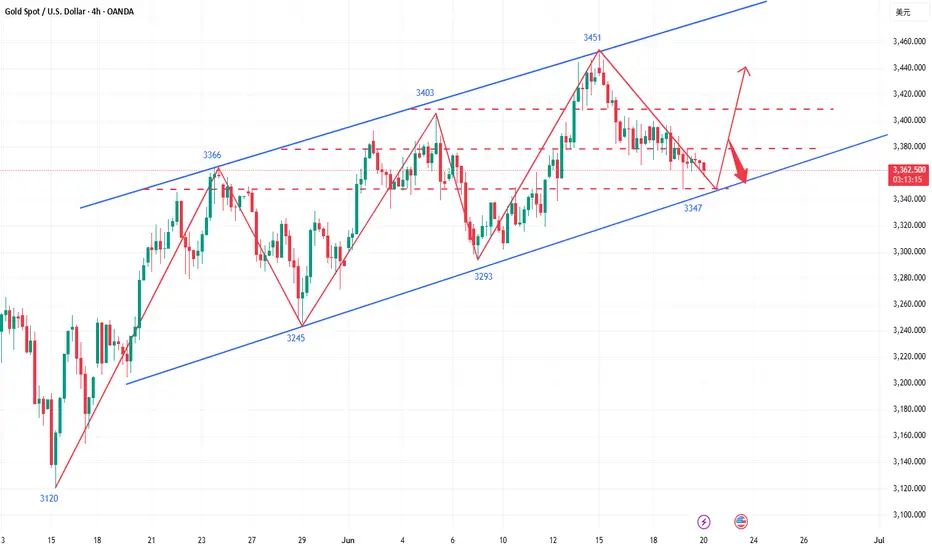
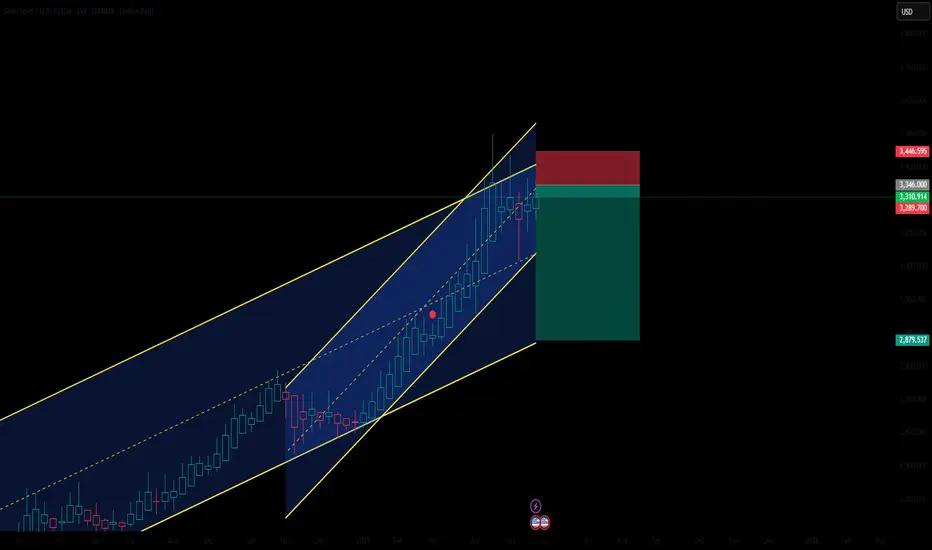
Gold Channel Rejection ZoneGold (XAUUSD) remains in a strong long-term uptrend, respecting a well-defined ascending channel on the weekly timeframe. Price is currently testing the upper boundary of this channel, suggesting potential exhaustion near the resistance zone.
A bearish rejection from this area could trigger a corrective move toward the lower boundary of the channel, aligning with a healthy pullback in an overall bullish structure. The chart also highlights a clear risk-to-reward setup, with a stop loss positioned above the recent highs and a target toward channel support.
As long as price remains below the channel top, downside pressure is likely in the incoming weeks. A confirmed breakout above the channel, however, would invalidate the bearish move and signal continuation of the bullish momentum.
Stop loss: 3443
Take profit: Around 2895 ( EMA 200 Daily )
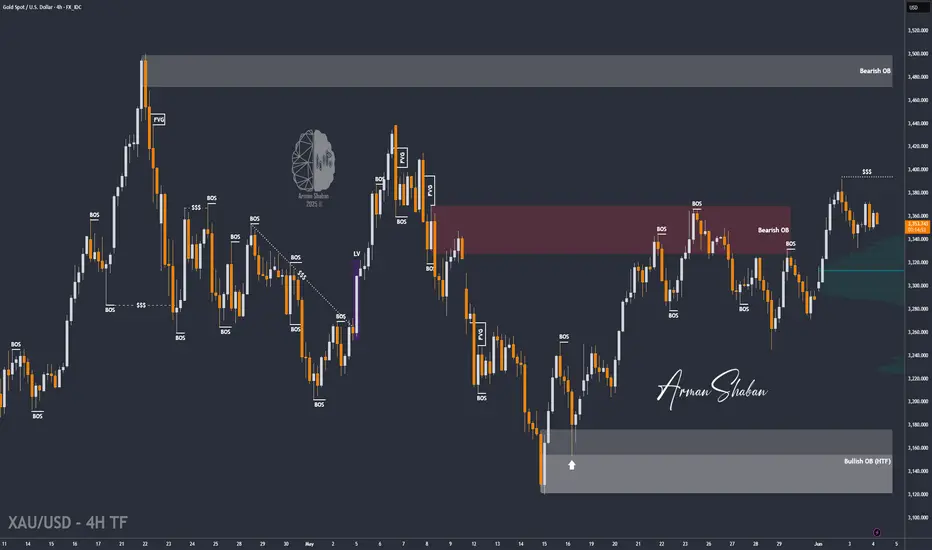
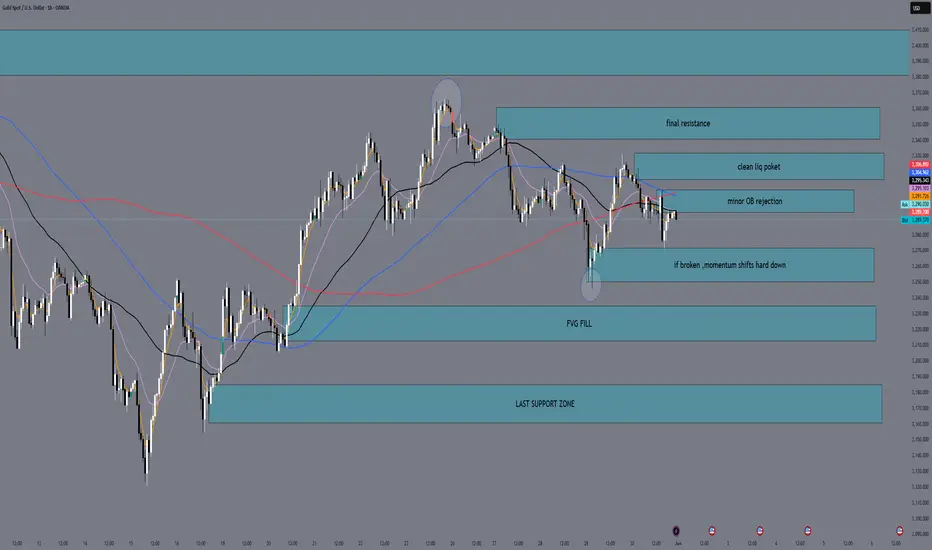
XAUUSD H1 Outlook – Monday, June 2, 2025“Equilibrium Loading — Breakout or Breakdown?”
👋 Welcome back traders — let’s decode the H1 battlefield together.
Gold is currently consolidating just under the 3290–3300 magnet, after a slow Friday close. The chart shows clear lower highs and rejection from premium, with multiple CHoCHs confirming bearish intent. However, price hasn’t fully broken below key H1 structure yet, holding just above equilibrium support.
We’re sitting in a coiled market — liquidity has built on both sides. Monday will likely give us the breakout.
🔹 Current Bias
🔻 Bearish bias while under 3308
📉 Structure shows CHoCH → BOS → LH, all under premium
🧭 Price is compressing between 3300 resistance and 3270 support
🔹 Refined Structural Zones (Realistic Width)
🔺 Key Resistance Zones (Upside)
Zone Price Range Context
🔺 Minor OB Rejection 3295 – 3308 Local OB + premium zone → first reaction area
🔺 Inducement Trap 3315 – 3335 Clean liquidity pocket → likely wick spike trap if retested
🔺 Extended Premium Zone 3340 – 3360 Final resistance from May → only valid if HH breaks
🔻 Key Support Zones (Downside)
Zone Price Range Context
🔹 Equilibrium Hold 3270 – 3250 Current floor. If broken, momentum shifts hard down
🔻 CHoCH + FVG Fill 3235 – 3212 BOS zone + inefficiency. Logical sell-side draw
🔵 Discount Demand Zone 3185 – 3160 Last HL + OB. Major reaction zone for swing reentry
🔹 EMA Flow (Momentum Outlook)
❗ Price is below all EMAs (5/21/50/100/200) = bearish stacked pressure
EMA100/200 are bending — momentum is confirming bearish tilt
Only a sharp move above 3308 will flip momentum short-term
🧠 Tactical Scenarios for Monday:
🔻 Sell Bias Active:
Rejection from 3295–3308 = possible LH → short down to 3250
Break of 3250 → continuation leg toward 3212 and 3185
🔁 Trap and Flip (Low Probability):
Price breaks above 3308 and holds → possible squeeze into 3335
Confirm with BOS + bullish PA on M15-H1
🔚 Summary:
Gold on H1 is coiled tightly inside mid-premium, and structure is now pointing slightly bearish. If we stay under 3308, the path of least resistance is down. If bulls trap sellers and break above, 3335 becomes the target.
Let price reveal its intent — you trade from clean structure, not from bias.
💬 Was this helpful?
📍 Follow GoldFxMinds for daily sniper-entry levels, bias shifts, and clean trade maps
👍 Like if you're waiting for confirmation before reacting
👇 Comment below: Will we flush into 3212 — or spike 3335 first?
See you in the charts.
— GoldFxMinds
Gold Declines as PCE Inflation Data Cools📊 Market Overview:
Gold is currently trading around $3,289/oz, down from the day's high of $3,322. This decline follows the U.S. PCE inflation data showing a 2.1% annual increase in April, below the forecast of 2.2% and March's 2.3%. Core PCE also rose 0.1% monthly and 2.5% annually, the lowest since early 2021.
📉 Technical Analysis:
• Key Resistance: $3,310 – $3,330
• Nearest Support: $3,270
• EMA: Price is currently below the 09 EMA, indicating a short-term downtrend.
• RSI Indicator: The RSI is declining, signaling increasing selling pressure.
• Candlestick Pattern: A bearish candlestick pattern has formed after failing to break above the $3,330 resistance zone.
📌 Outlook:
If gold fails to hold the $3,270 support level, it may continue to decline towards $3,250. However, maintaining above $3,270 could see a rebound towards the $3,300 – $3,310 range.
💡Suggested Trade Strategy:
SELL XAU/USD at: $3,310 – $3,315
🎯 TP: $3,290
❌ SL: $3,320
BUY XAU/USD at: $3,270
🎯 TP: $3,290
❌ SL: $3,260
