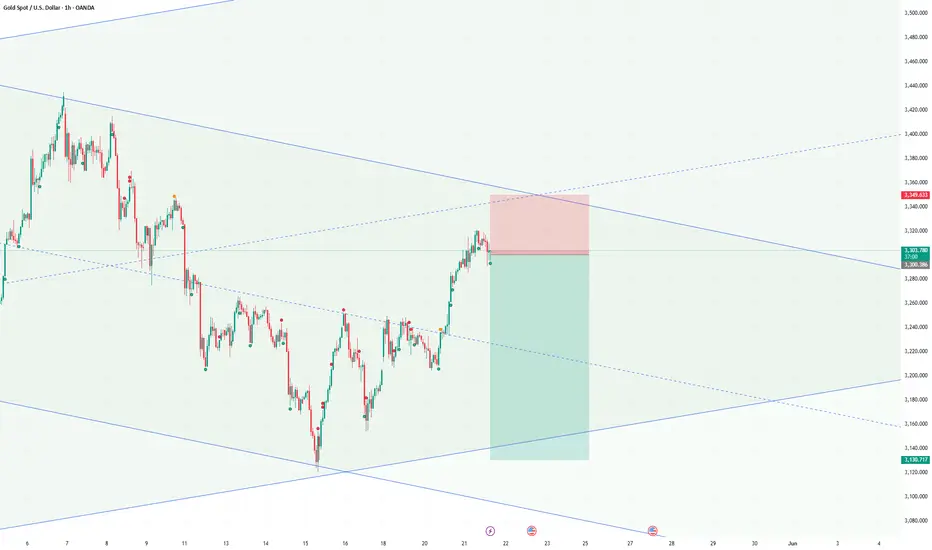
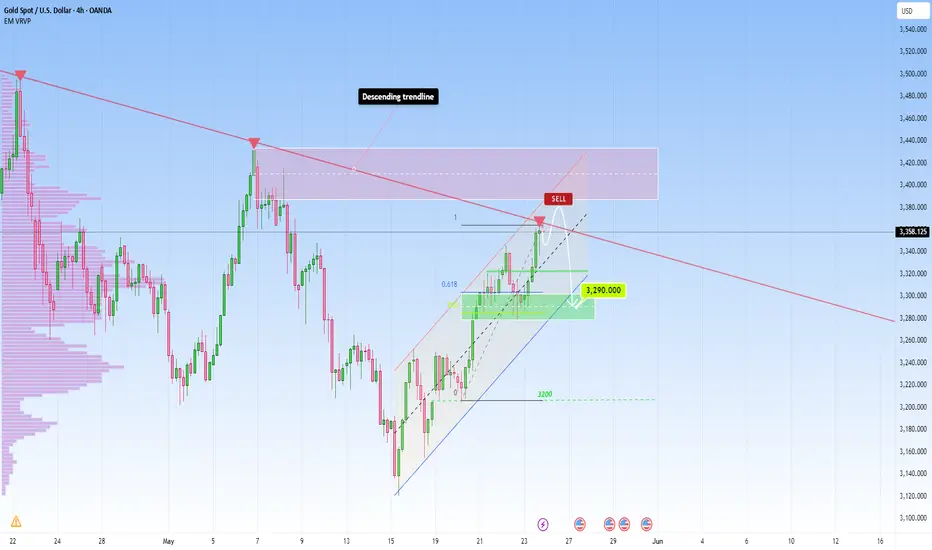
Sell On Gold I am seeing a sell opportunity On Gold as it broke the trend line and successfully retested it. the Next buying is @3270 because a 4hr unmitigated FVG is there.
Goldsell

3278-3320 key position is mainly high sell low buyAt present, gold rebounded after falling back to 3287, and fluctuated around 3300 in the short term. Pay attention to the support area of 3278-3283 below. If it does not break this area, you can still try to go long in the short term. After all, from a technical point of view, the decline during the day is a correction and adjustment to the previous rise.
From the 4-hour chart, the upper short-term focus is on the suppression of the 3316-3320 area, and the lower focus is on the support of 3278-3283. In terms of operation ideas, continue to maintain the interval strategy of "high-altitude and low-multiple", rely on key positions to sell high and buy low, and wait patiently for effective signals before entering the market. If the structure or rhythm of the market changes, the strategy will be adjusted in time and notified separately.
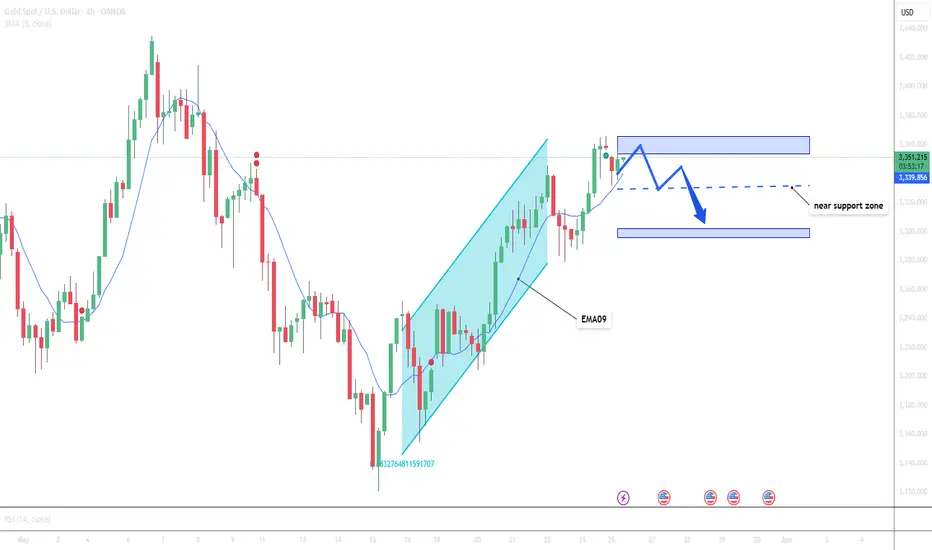
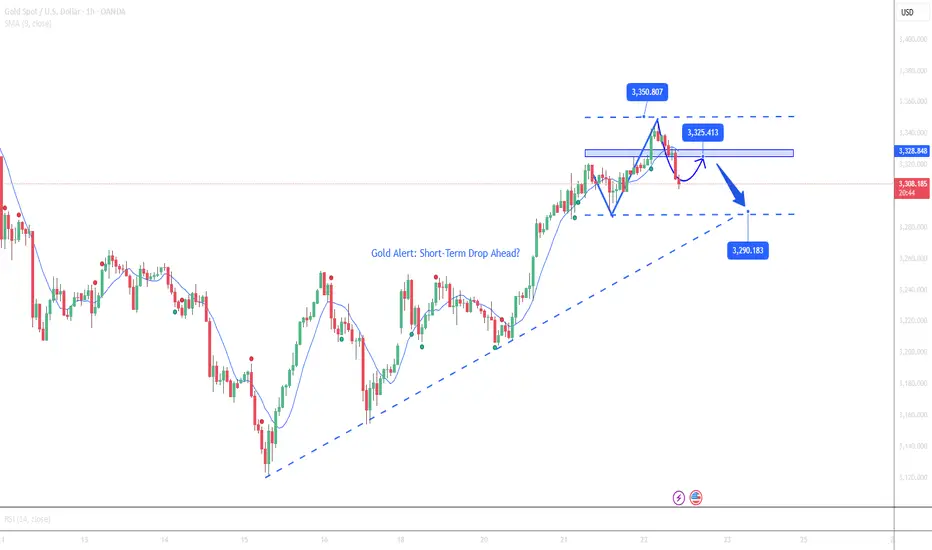
Gold May Undergo Short-Term Correction as USD Rebounds📊 Market Overview
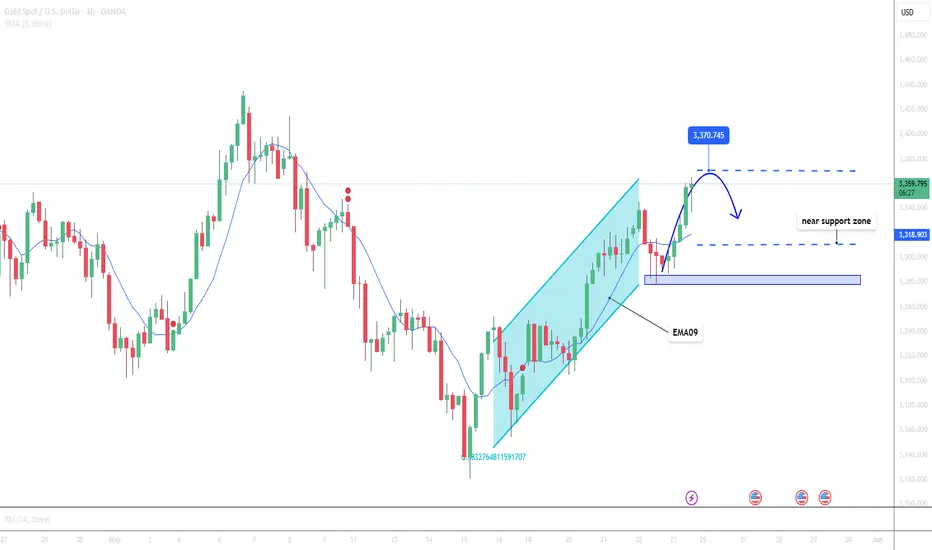
Gold (XAU/USD) is trading around $3,309/oz after retreating from the $3,350 region during the Asian session today. Selling pressure emerged as U.S. Treasury yields rose and the USD rebounded slightly, despite expectations of potential Fed rate cuts in the near future.
📉 Technical Analysis
• Key Resistance: $3,350
• Nearest Support: $3,290
• EMA 09: Current price is below the EMA 09, indicating a short-term bearish trend.
• The downtrend is confirmed by bearish candlestick patterns and increasing trading volume in recent sessions.
📌 Outlook
Gold may continue its short-term correction if the USD continues to rebound and U.S. Treasury yields remain elevated. However, long-term support factors such as concerns over U.S. national debt and expectations of Fed rate cuts persist.

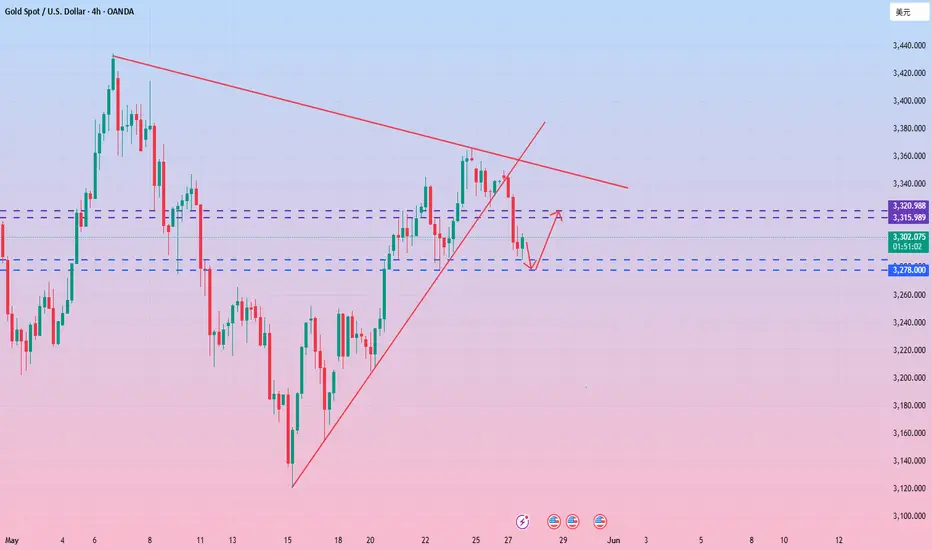
How will the short-term trend of gold develop?From a technical perspective, the overall volatility is limited. In the near future, the upper side is under pressure from the trend line, and the lower side is affected by the 4-hour middle track support. The overall trend is maintained in the range of 3365-3322. The current monthly line is approaching its closing, and the short-term market is temporarily in a high-level oscillation stage. In the 4-hour cycle, the price range is gradually narrowing, waiting for a directional breakthrough. The lower support focuses on the 3325-3320 middle track position and the previous top and bottom conversion support of the 3308 line; the upper pressure focuses on the 3352 and 3365 areas. After a slight high opening, it weakened. The overall idea is still to treat it as a wide range of fluctuations. It is recommended to be long and short in operation, and adjust the strategy after breaking through.
Operation suggestion: Go long near 3330-3323, and the target is 3340 and 3352;
If the pressure near 3352 is not broken, consider shorting, and the target is to fall back to the 3330 line.

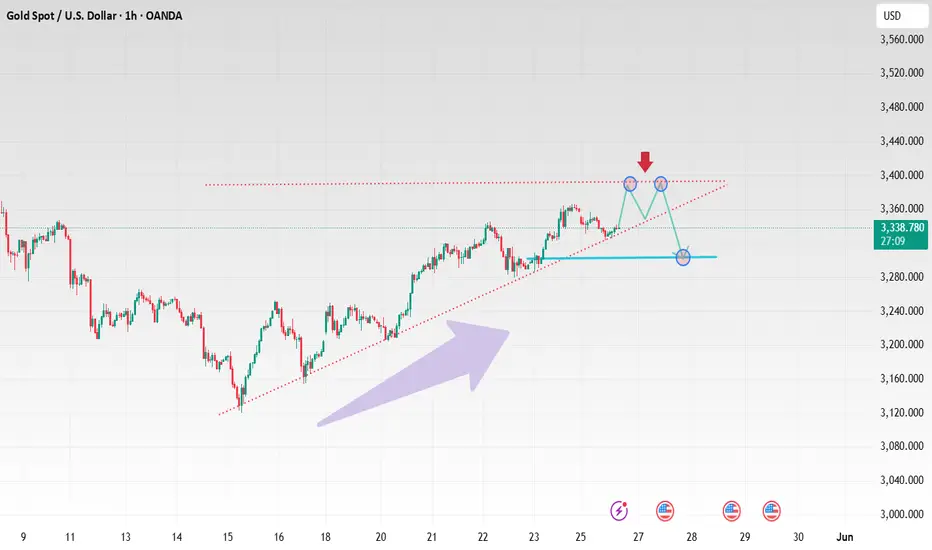
GOLD increased in the short term: Break down expectedThe Gold market has been very strong for some time, but I don’t think this will continue to be the case going forward. As we’ve seen, the price has rallied a bit on Friday with Trump’s EU tariff threats.
Market structure starts to hint exhaustion, as such overbought conditions often lead to generous pullbacks, supporting needed corrections.
That being said I do think that on Monday we might see a short term pullback.
We can see that gold is currently being rejected just above the higher zone of the 4h ascending channel. The zone aligns with a low-volume node as well. Therefore, at this zone around the 3,350, I wouldn't recommend to chase high. Before this zone is clearly broken considering long entries here would be buying blindly.
Right now I think you have to look at this as a market that may just simply be a buy on the dip and hold till we get to the $3,500 level again type of situation.
The other scenario is that the market will consolidate for a while.
If we were to break down below the $3,290 level, then $3,200 is next support.
In the long run though the bias remains bullish with potential to challenge the 3,435 and as well as 3,500 in the big picture.
But if you're watching for buys:
wait to see how price behaves on Monday
watch for sustained bullish structure before getting involved
don’t chase, wait for a clean break + candle confirmation pattern
For sells:
Watch for bearish rejection in the next couple of candles (4H or Daily)
Don’t enter unless it’s confirmed!
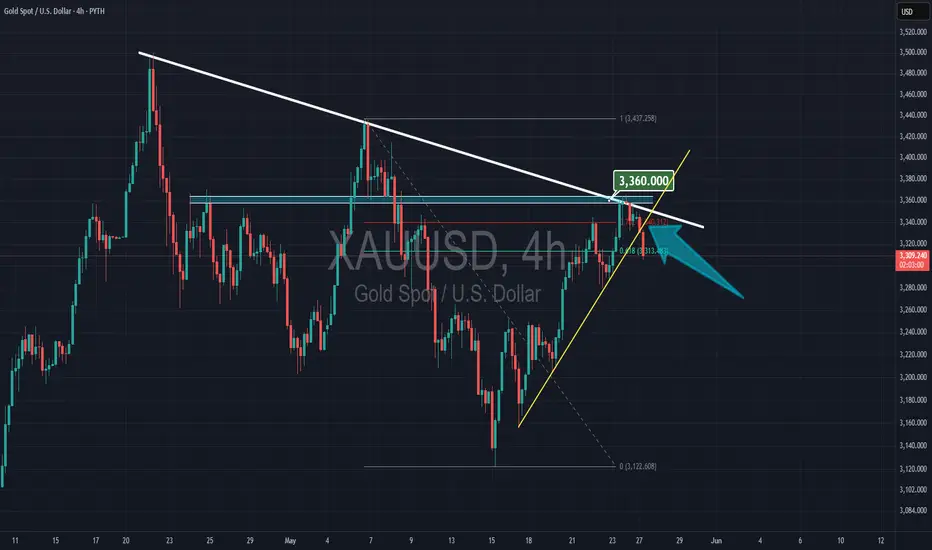
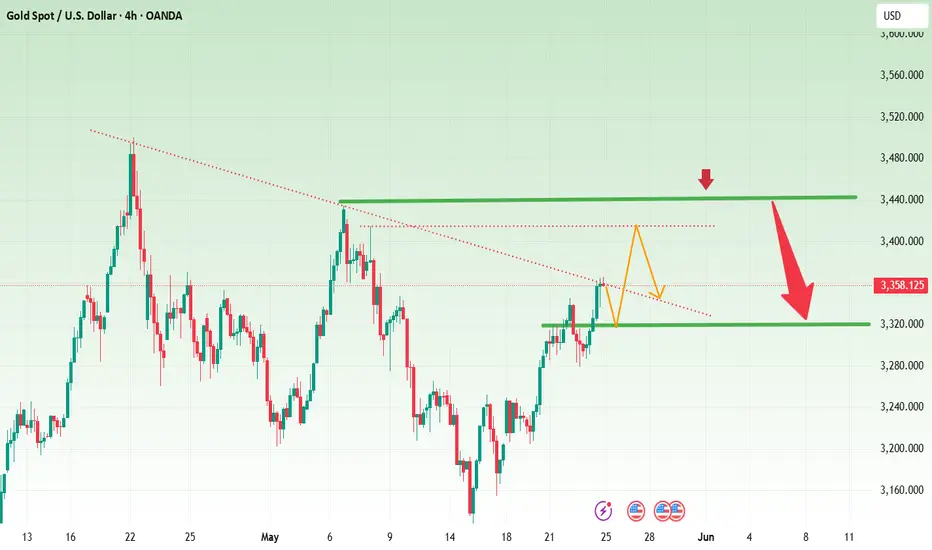
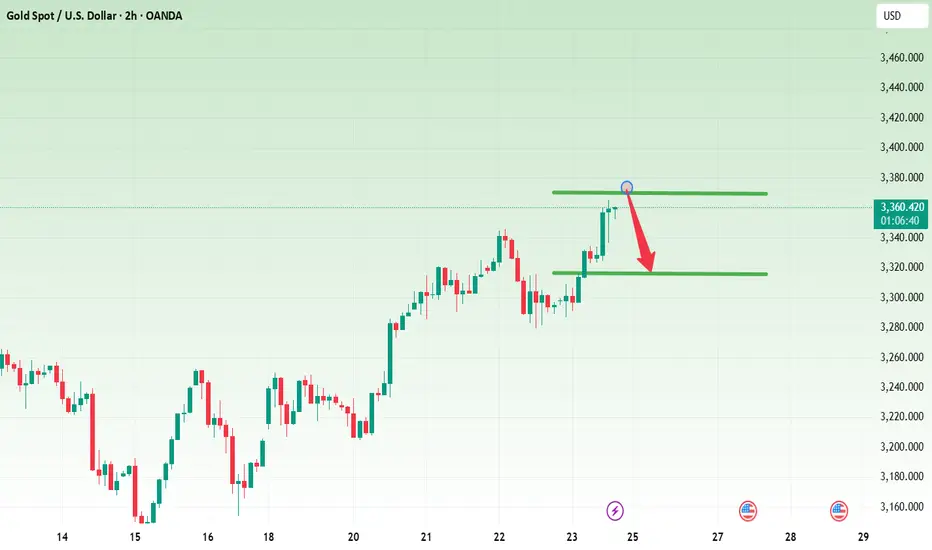
Gold rejection (27MAY2025)The yellow trendline on 4hour for Gold got broken, and now more downside movement is coming.
Gold fluctuates at high levels, long and short profit ideas
📌 Driving events
On Sunday, U.S. President Donald Trump announced that plans to impose 50% tariffs on the European Union would be postponed until July 9, easing concerns about an imminent escalation in trade hostilities. This development reduced immediate risk aversion in the market, putting pressure on gold prices.
Nevertheless, investors' attention now turns to the FOMC minutes released on Wednesday, which may further clarify the Fed's monetary policy outlook. At the same time, market participants will continue to pay attention to trade negotiations between the United States and Japan and other major economies. Any new tensions or setbacks in these negotiations could quickly restore demand for gold as a protective hedge.
📊Comment Analysis
Gold prices fell slightly after the official announcement of the tariff extension and continued to climb
💰Strategy Package
🔥Selling area: 3388-3390 SL 3395
TP1: $3376
TP2: $3363
TP3: $3350
🔥Buying area: $3301-$3299 SL $3294
TP1: $3312
TP2: $3325
TP3: $3338
⭐️ Note: Labaron hopes that traders can properly manage their funds
- Choose the number of lots that matches your funds
- Profit is 4-7% of the capital account
- Stop loss is 1-3% of the capital account
XAU/USD Approaching Key Support Zone Inside Descending ChannelGold (XAU/USD) is currently trading within a descending channel on the 15-minute timeframe. Price has recently touched the lower boundary of the channel and is hovering near a key horizontal support level around 3322–3325. A reaction from this area could lead to a potential bounce toward the upper channel resistance.
Price is forming lower highs and lower lows, respecting the descending trend lines.
Key support zone: 3322–3325
Resistance to watch: Around 3346
Trade idea shows a favorable risk-to-reward setup with clearly defined entry, stop, and target levels.
Monitoring for a potential breakout or rejection at current levels.

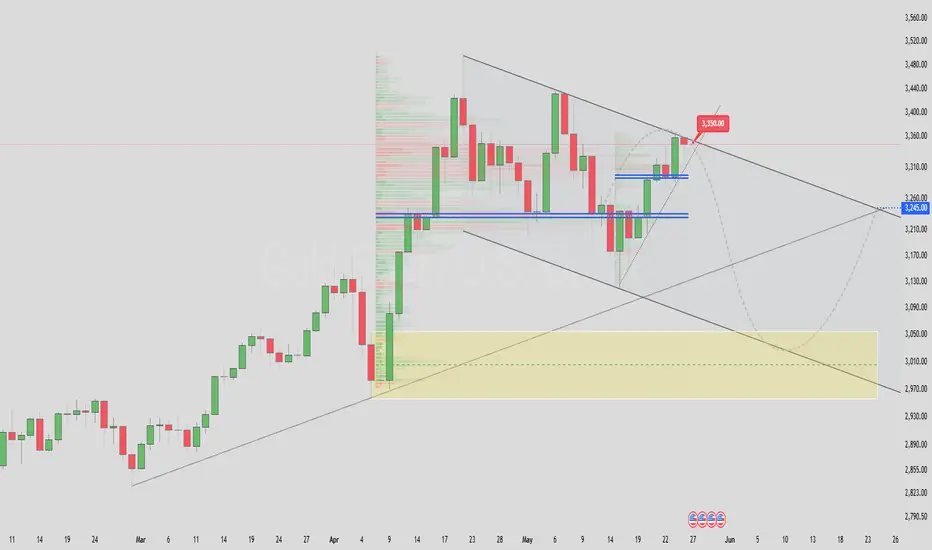
Gold Price Forecast: May - June 2025Gold is currently trading at $3,345.02. The recommendation is to sell now, targeting a bearish move down to $3,050. This outlook is supported by the formation of a rising wedge pattern in confluence with a 3rd retest on the daily chart, a technical setup that often signals a downward price movement. After reaching the target of $3,046, expect a retracement back to $3,242, where the price is likely to retest the long-term bullish trend.
Gold May Face Short-Term Correction Amid Strong Resistance📊 Market Overview:
Gold (XAU/USD) is trading around $3,335, retreating from a two-week high of $3,345.48. The US Dollar's weakness, driven by fiscal concerns and President Trump's extension of the EU tariff deadline to July 9, has supported gold prices. However, the easing of global trade tensions has limited the precious metal's upside .
📉 Technical Analysis:
• Key Resistance: $3,350, $3,364
• Nearest Support: $3,330, $3,300
• EMA 09: Price is trading near the EMA 09, indicating a neutral trend.
• RSI (14): 69.311 – approaching overbought territory, suggesting potential correction.
• MACD (12,26): 13.57 – bullish signal, but momentum is slowing.
• Williams %R: -17.476 – in overbought zone, indicating possible short-term pullback .
📌 Outlook:
Gold may experience a short-term correction if it fails to break above the strong resistance at $3,350. Sustained trading below this level could lead to selling pressure, especially as technical indicators point to overbought conditions.
💡 Suggested Trading Strategy:
• SELL XAU/USD at: $3,345 – $3,350
🎯 TP: $3,330
❌ SL: $3,355
• BUY XAU/USD at: $3,300 – $3,310
🎯 TP: $3,340
❌ SL: $3,290
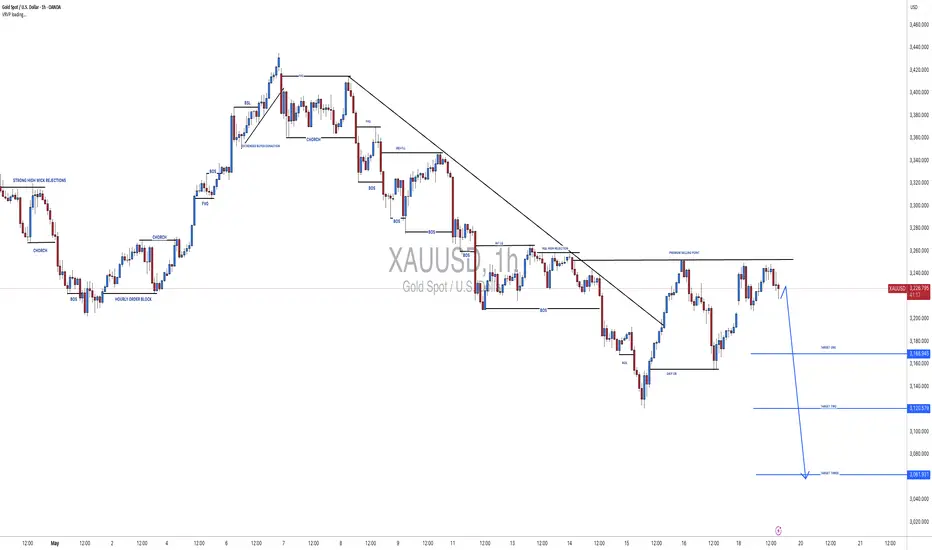
XAUUSD[GOLD]: 1 Hour View Show Extreme Seller Volume Gold in a shorter time frame shows extreme bearish volume kicking in the market, where bulls are failing to push prices higher. Additionally, if you’re someone who analyses patterns, a HEAD AND SHOULDERS pattern has also formed. There are three targets you can aim for.
We extend our best wishes and good luck in your trading endeavours. Your unwavering support is greatly appreciated.
If you’d like to contribute, here are a few ways you can assist us:
- Like our ideas
- Comment on our ideas
- Share our ideas
Team Setupsfx_🚀❤️
Gold prices remain strong as tariffs heat up again
Hey everyone, let's comment on the gold price next week from May 26, 2025 to May 30, 2025,
📌 Driving Events
Gold prices resumed their upward momentum on Friday, surging nearly 2% on the day and up more than 5% for the week as the dollar weakened amid renewed trade tensions. Gold prices rebounded from an intraday low of $3,287 to $3,359 as escalating rhetoric from Washington fueled investor demand for safe-haven assets.
U.S. President Donald Trump has intensified the trade standoff with the European Union, declaring that negotiations are "going nowhere" and threatening to impose a 50% tariff on EU imports from June 1. For months, Fed policymakers have made it clear that they want more clarity on the response from fiscal and trade policies and the economy before taking further action on interest rates. Over the past month, this cautious stance has prompted traders to withdraw their bets on a rate cut in the June meeting, and the market now expects the policy pause to continue until the July meeting. However, futures market positions show that the probability of a rate cut before the end of September is still slightly above 50%. This is essentially a bet that the situation will become clearer in the next four months: either slowing inflation paves the way for policy easing, or the economic deterioration forces the Fed to increase stimulus.
📊Comment Analysis
Tariff news has begun to heat up again, and the United States and the rest of the world have not yet reached a consensus on negotiations, and gold prices have benefited from this rise. The big time frame shows that the price is breaking out and continuing the upward trend
Technical:
Based on the resistance and support levels of gold on the 4-hour chart, Labaron has identified the following important key areas:
Resistance: $3412, $3436
Support: $3315, $3280, $3245
⭐️ Note: Labaron hopes that traders can properly manage their funds
- Choose a lot size that matches your funds
- Profit is 4-7% of the capital account
- Stop loss is 1-3% of the capital account
GOLD D1 chart update for the 26-30 May weekkindly read level carefully as market on it's way to ATH but keep in mind downside some major retracements are remains pending
Right all eyes on 3330 level if market successfully sustain below 3330 then it will definitely move towards 3300 or even 3280 and then 3250
Main levels for the week 3400 \ 3250 \ 3308

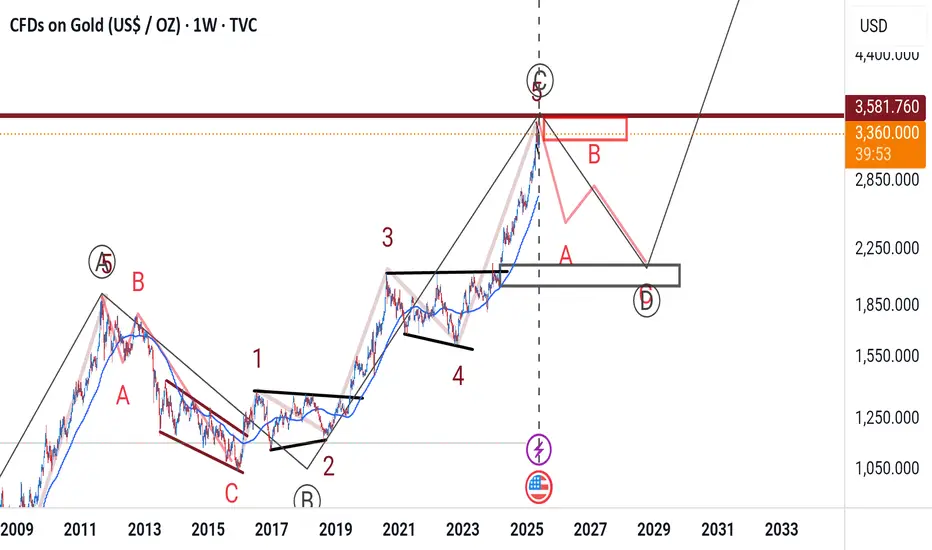
GoldGold analysis: I expect a decline from these prices, or we may rise slightly to $3,500, then we will start a medium-term corrective wave for the overall chart, i.e. approximately two years of correction, and after that comes a five impulse wave. TVC:GOLD
Gold Rises on Tariff News, But Caution NeededGold prices surged after the U.S. President announced a 50% tariff on EU imports, triggering safe-haven demand. However, analysts warn that this may be a short-term FOMO reaction rather than the start of a sustainable rally.
📰 Key Drivers:
- The tariff announcement spooked markets, boosting gold temporarily.
- The U.S. dollar dipped slightly, but bond yields remain high – a bearish sign for gold.
- No immediate EU retaliation weakens the long-term bullish case.
🔍 Technical Outlook:
- Resistance: $3350 – being tested but not yet clearly broken.
- Support: $3310 – may be revisited if upward momentum fades.
- EMA 09: Price remains above, but fading volume and long upper wick suggest weakening strength.
- Price Action: Sharp move looks emotion-driven; correction likely if no follow-up catalyst appears.
📉 Short-Term View:
Despite the surge, gold’s rise may be temporary. If no escalation occurs, a short-term pullback is likely as markets reassess the impact.
💡 Suggested Trade Setup (Short-Term Bearish):
SELL XAU/USD at 3345 – 3350
🎯 TP: 3330
❌ SL: 3355
BUY XAU/USD at 3310 – 3312
🎯 TP: 3325 – 3327
❌ SL: 3305
Gold can be shorted near 3365-3370 in the US market
📌 Driving Events
Gold prices fell about 0.48% on Thursday, retreating from a two-week high of $3,345 and falling below the key $3,300 level. Although U.S. Treasury yields retreated from intraday highs, the renewed strength of the U.S. dollar still pushed gold prices down. The pressure on gold intensified after the U.S. House of Representatives passed President Trump's budget proposal, which is now submitted to the Senate for final approval. At the time of writing, XAU/USD was trading at $3,289, down 0.83% on the day. Although the market sentiment has rebounded slightly, it remains fragile after Moody's recently downgraded the U.S. sovereign debt rating. The fiscal package approved by the House of Representatives is expected to increase the national debt ceiling by a staggering $4 trillion, which has exacerbated concerns about long-term fiscal sustainability.
📊Comment Analysis
Gold is now facing strong resistance and buying power is weakening.
💰Strategy Package
🔥Sell Gold Zone: 3365- 3370 SL 3375
TP1: $3350
TP2: $3335
TP3: $3320
⭐️ Note: Labaron hopes that traders can properly manage their funds
- Choose the number of lots that matches your funds
- Profit is 4-7% of the fund account
- Stop loss is 1-3% of the fund account
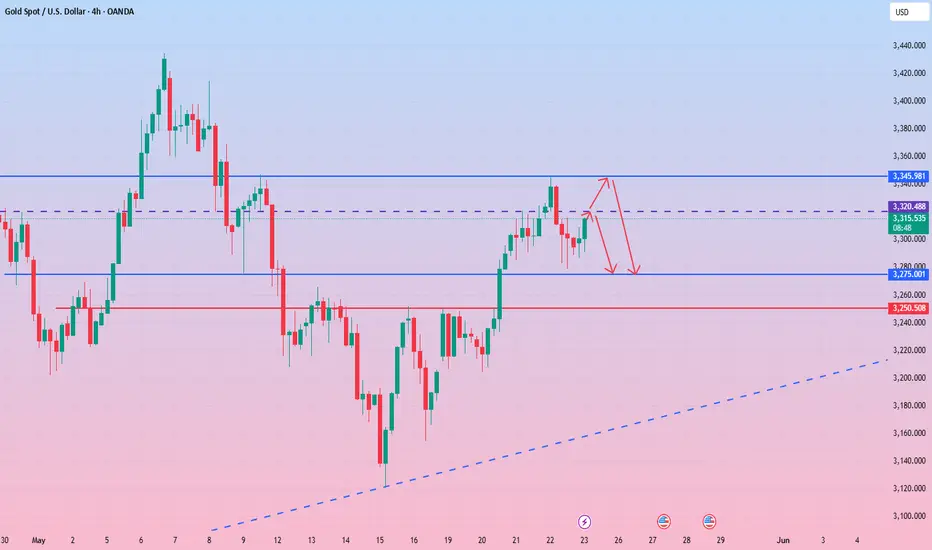
Plan ahead Sell high and buy low to take the lead.Yesterday, the technical side of gold rose first and then fell. We directly arranged 3327 long orders to take profit and exit at 3340. After further accelerating to break through the 3345 mark, it fell under pressure and fell rapidly. We also successfully shorted at 3341, and the target successfully reached 3330-20. The European session continued to fall and broke through the 3300 mark and continued to fall to around 3280 to stabilize and rebound. We went long at 3280, and the target was 3300-3306. The daily K-line closed at a high and fell back to oscillate in the middle. The overall gold price was suppressed and oscillated at the 3345 mark in the short term. Yesterday's three orders also reached the take-profit target as expected.
From the 4-hour market analysis, today's upper short-term resistance is around 3315-3320. If the upper pressure 3315-3320 is not broken, shorting can also be done. Focus on yesterday's high pressure of 3345. The support level below is still 3280-3275. If it breaks down, pay attention to 3255-3250. Continue to rely on this range to maintain the main tone of high-altitude low-multiple cycles during the day. Observe more and move less in the middle position, be cautious in chasing orders, and wait patiently for key points to enter the market.
Operation suggestions:
1. Go long when gold falls back to 3285-3275, and look up to 3300 and 3315.
2. Go short when gold rebounds to 3340-3345, and look down to 3325 and 3315.
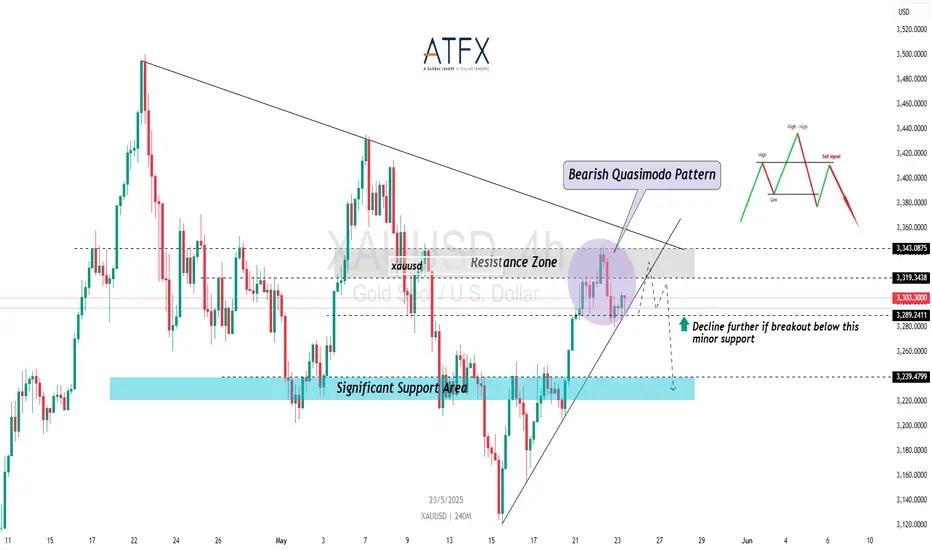
PMI Boosts USD but Caution Lingers Ahead of Fed DecisionOANDA:XAUUSD TVC:GOLD The recent release of stronger-than-expected S&P Global PMIs in the U.S. has offered short-term support to the dollar, pressuring gold from intraday highs. Manufacturing and services PMIs both improved to 52.3 in May, fueling speculation that the U.S. economy may still be resilient despite persistent concerns over Trump's proposed tax reforms and renewed tariffs.
Still, market sentiment remains cautious. While Wall Street recovered slightly, it continues to post weekly losses. Investors are balancing upbeat data with longer-term risks — including a potential economic slowdown triggered by aggressive fiscal tightening and global demand headwinds.
With the FOMC meeting approaching (June 17–18), gold traders are likely to remain reactive to macroeconomic signals. Any dovish shift or mention of a potential rate cut timeline could reignite demand for non-yielding assets like gold. Until then, price action around the $3,289 support and the Quasimodo pattern will be crucial for short-term direction.
Resistance : $3,319 , $3,343
Support : $3,289 , $3,239
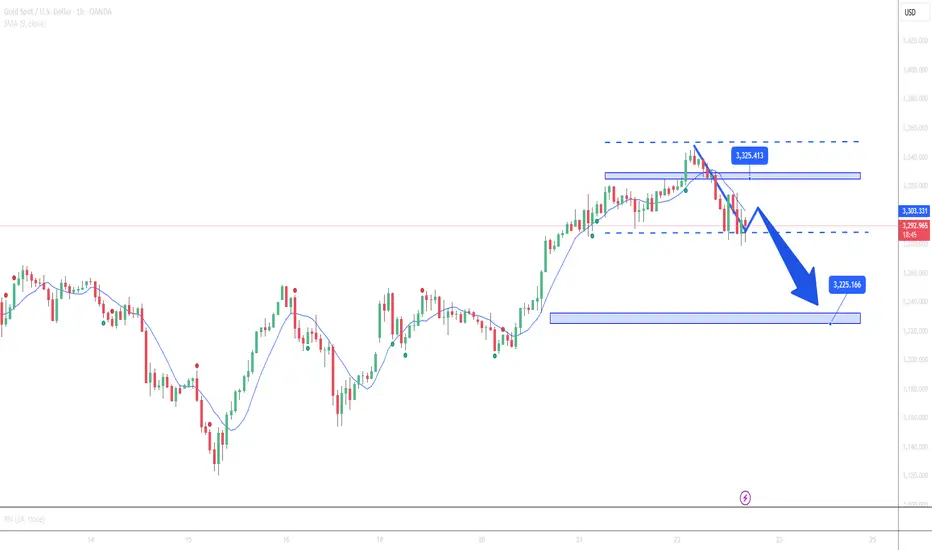
Gold Remains Under Pressure – Further Decline Likely Not OverGold has touched the key support level at $3290/oz as expected and is now hovering around $3295, indicating that the downward momentum remains intact. Recent U.S. economic data has been positive for the U.S. dollar, adding to short-term pressure on gold.
➡️ The strong data reinforces the Fed’s hawkish stance , increasing expectations that interest rates will remain elevated for longer. As a result, both the U.S. dollar and Treasury yields have risen, weighing heavily on gold prices.
🔍 Technical Analysis:
• Price is tracking below the EMA 09 , suggesting the downtrend is still in play.
• The $3290 support has been tested; a break below this level could open the door to the next target at $3225.
• A consistent bearish candlestick pattern shows no clear signs of reversal.
• Lack of strong buying interest at current levels suggests further downside is likely.
💡 Suggested Trade Strategy (Short-Term Bias: Bearish):
• SELL XAU/USD in the $3294 – $3297 zone
🎯 TP1: $3275
🎯 TP2: $3225
❌ SL: $3305
• BUY XAU/USD only if price pulls back to the $3225 zone with clear support signals
🎯 TP: $3260 – $3270
❌ SL: $3210
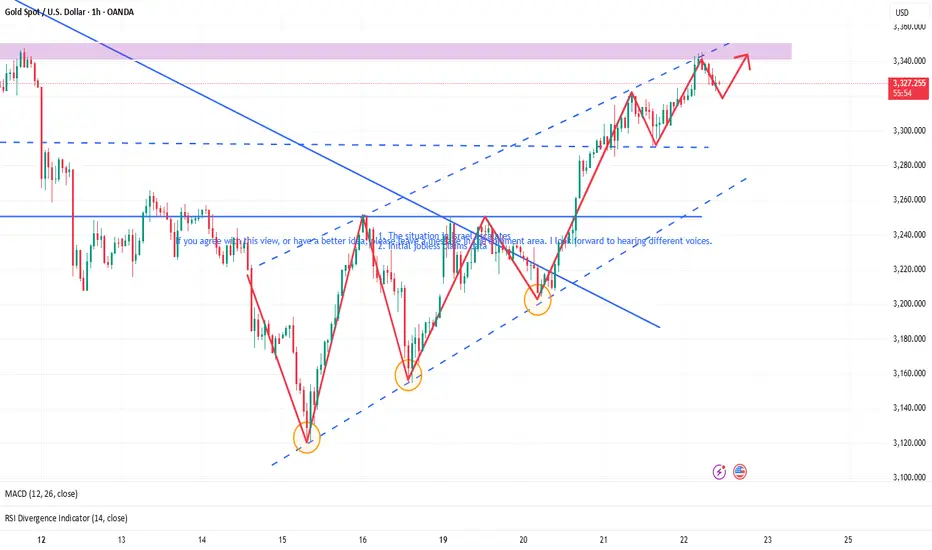
Intraday volatility,there is still chance to go long on pullback🗞News side:
1. The situation in Israel escalates
2. Initial jobless claims data
📈Technical aspects:
Influenced by recent news, gold showed a volatile rebound trend. Gold continued to rise in the early Asian session, r OANDA:XAUUSD eaching a high of around 3345. The 3290-3300 level below has absolute support in the short term. As long as it does not fall below 3290, you can go long at 3290-3300. In the 4H cycle, the Bollinger opening and the moving average diverge upwards. The upward momentum is sufficient, and it is not easy to guess the top. Pay attention to the 3310-3300 line of support below, and pay attention to the suppression of the 3340-3350 area above. If the gold price stabilizes at 3350, it is expected to further explore the resistance of 3360-3370. If the European session falls into volatility, maintain the range of high selling and low buying, and consider going long when it retreats to the support level of 3320-3310.
If you agree with this view, or have a better idea, please leave a message in the comment area. I look forward to hearing different voices.
FOREXCOM:XAUUSD FXOPEN:XAUUSD TVC:GOLD FX:XAUUSD
Gold Shows Clear Signs of Weakness – Short-Term Downtrend LikelyGold is showing clear signs of weakness after failing to break the strong resistance level at $3350/oz. Bullish momentum has faded as gold broke below the $3325 support and continued its decline, now trading around $3310. Current technical signals indicate that the downtrend remains dominant, and there is a high probability that gold will continue correcting toward the $3290 support level, possibly even testing the $3225 area if the bearish pressure persists.
📰 Key Economic Data Scheduled for Today (U.S.):
• Unemployment Claims
• Flash Manufacturing PMI
• Flash Services PMI
These reports could trigger strong short-term volatility, especially if the data is positive and strengthens expectations that the Fed will maintain a tight monetary policy. This scenario could put further downward pressure on gold, as the USD strengthens and Treasury yields rise.
⚠️ Recommendation: Investors are advised to avoid trading during news releases to minimize risk from high volatility.
🔍 Short-Term Technical Analysis:
• Key Resistance: $3350 – remains unbroken, confirming weakening buying power.
• Nearest Support: $3290 – crucial level to monitor if the downtrend continues.
• Deeper Support: $3225 – could be tested if no strong rebound occurs.
• Short-Term EMA: Price is currently below the EMA 09, signaling further downside momentum.
• Bearish Candlestick Pattern: Series of long red candles reinforce the ongoing bearish trend.
💡 Short-Term Trade Scenarios:
SELL XAU/USD Zone : 3325$ - 3328
💰 TP : 3310 - 3313
🚨 SL $3335
BUY XAU/USD Zone: 3288$ - 3290$
💰 TP : 3313 – 3315
🚨 SL $3283
Grasp the core strategy of trend tradingGold continues to be bullish and will go to the area near the gap of 3325. At that time, the short-term may be blocked and fall back. If it breaks, look at the area near 3340-3345. In the 4H cycle, relying on the moving average to support the rising stage, and the Bollinger is in an open state, there is still room to see above. The support for the fall back is to pay attention to the top and bottom of the small cycle of 3285, followed by the low point of 3274, but there will not be too much retracement in the strong position. In terms of operation, the main fall back is long, and gradually look at 3325 and 3345. Shorting can only be entered at key points, and fast in and out without fighting.
Operation suggestion: Go long on gold near 3285-74, look at 3315 and 3325! If it is extremely strong, go long on the support of 3298-3295!

Gold . Short gold now and thank me laterGold likely to retest the support before shooting up. Dont go for long yet. Follow me for more updates. I will try to be more active from now on.
Please strictly follow the SL and TP, thanks