GOLD REMAINS UNDER PRESSURE AFTER U.S. INFLATION DATA📊 Market Overview:
Gold is trading around $3294, down from $3311 earlier after U.S. Core PCE and Employment Cost Index came in as expected — reinforcing the Fed's hawkish stance. A stronger dollar and rising Treasury yields continue to weigh on gold.
📉 Technical Analysis:
• Key resistance: $3302 – $3305
• Nearest support: $3285 – $3275
• EMA09 (H1): Price is below the 9-period EMA → short-term trend remains bearish
• Candlestick / volume / momentum: After the sharp drop, price is consolidating between $3293–$3298 with low volume. Failure to break above $3302 may trigger further downside. RSI near 45 suggests room for more selling.
📌 Outlook:
Gold may continue to decline in the short term if it fails to reclaim $3302 and the dollar remains strong through the Asian and European sessions.
💡 Suggested Trade Setup:
🔻 SELL XAU/USD: $3296 – $3298
🎯 TP: $3280 / $3275
❌ SL: $3305
🔺 BUY XAU/USD: $3275 – $3278 (if reversal candle appears)
🎯 TP: $3295
❌ SL: $3270
Goldsetup
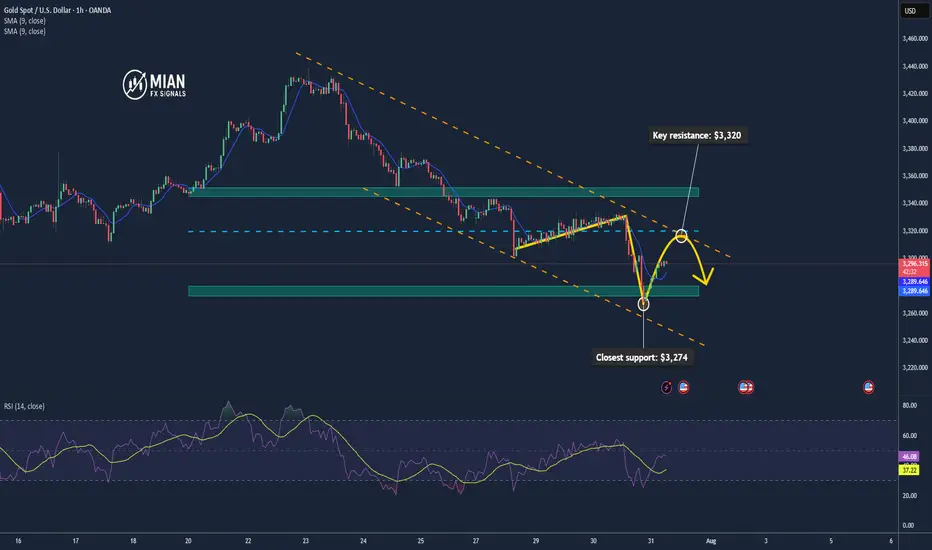
Gold May Rise Technically after Testing the $3,300 Zone📊 Market Overview:
Spot gold is trading around $3,295–$3,301/oz, influenced by slightly lower U.S. Treasury yields and a softer dollar tone. Analyst consensus from Reuters projects gold likely to stay above $3,220/oz through 2025 and possibly hit $3,400 in 2026 amid continued safe-haven demand
📉 Technical Analysis:
• Key resistance: $3,320 / $3,345
• Closest support: $3,274 – $3,280
• EMA09: Price is currently below the 9 period EMA on H1, indicating a short-term bearish bias.
• Candlestick / volume / momentum: There was a minor bounce from the support zone around $3,274, but volume remains low. RSI isn't oversold, suggesting room for technical pullback.
📌 Outlook:
Gold may experience a technical rebound if it holds above $3,280. A breakout above $3,320 would likely require clear catalyst—such as weak U.S. data or a dovish Fed tone.
💡 Suggested Trading Strategy:
SELL XAU/USD: $3,320 – $3,323
🎯 TP: 40/80/200 pips
❌ SL: $3,326
BUY XAU/USD: $3,279 – $3,282
🎯 TP: 40/80/200 pips
❌ SL: $3376
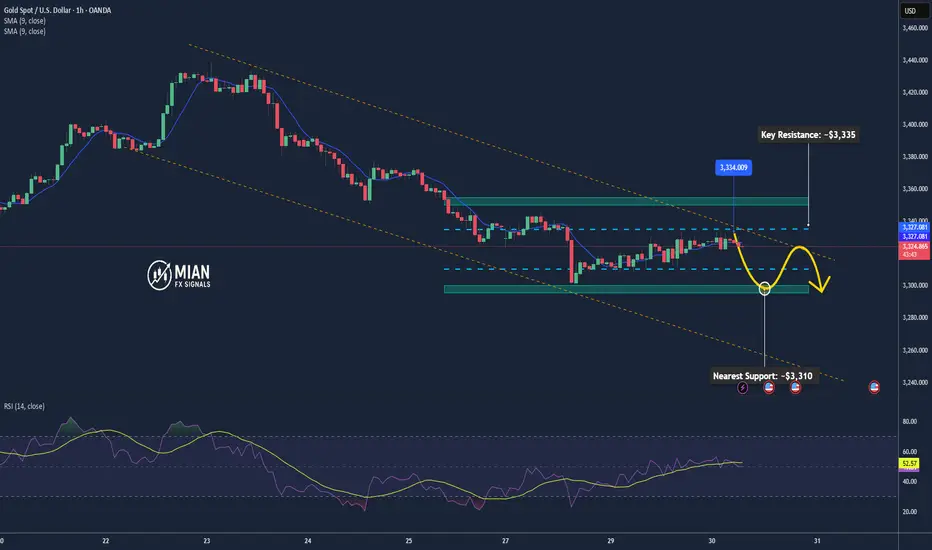
Gold May Dip Mildly Before US Data📊 Market Overview:
Spot gold is trading around $3,329/oz, up ~0.1%, supported by falling U.S. Treasury yields and a slightly weaker dollar, while investors await potential Fed dovish signals or rate cut in September . Meanwhile, easing U.S.–EU trade tensions weighed on safe-haven demand for gold.
📉 Technical Analysis:
• Key Resistance: ~$3,335–3,350 (recent highs and potential test zone)
• Nearest Support: ~$3,310 (previous stable support)
• EMA09 position: Price is above EMA9, indicating a mild bullish bias in the short term
• Momentum/Volume: RSI ~53 (neutral), MACD & StochRSI showing small buy signals. However, bullish momentum is fading, suggesting a possible mild pullback
📌 Conclusion:
Gold may dip modestly toward $3,310 if the dollar strengthens or if Fed rate-cut expectations recede. A break above $3,335–3,350 could pave the way for further gains, though current momentum remains insufficient to confirm a breakout.
💡 Suggested Trade Strategy:
SELL XAU/USD: $3,333–3,336
🎯 Take Profit: 40/80/200 pips
❌ Stop Loss: $3339
BUY XAU/USD: $3,310–3,308
🎯 Take Profit: 40/80/200 pips
❌ Stop Loss: $3305
Gold Buy SetupHi everyone
Hope you all had a good trading week so far, this is our buy setup we looking to see for Wednesday
Let us know in the comments what you think.
Gold Recovers After Sharp Drop – Trend Not Yet Reversed📊 Market Overview:
Gold rebounded from a sharp fall earlier in the session, rising from $3301 to around $3315 as the U.S. dollar weakened slightly and sellers took partial profit. However, no strong fundamental catalyst confirms a trend reversal yet.
________________________________________
📉 Technical Analysis:
• Key Resistance: $3315 – $3322
• Nearest Support: $3300 – $3295
• EMA 09 (H1): Price is currently just below EMA09, indicating a slight bearish bias
• Candlestick / Volume / Momentum:
• H1 candle shows a long lower wick at $3301 → some buying interest
• No H1 candle has closed above $3315 yet → no confirmed reversal
• Volume remains weak, RSI still under 50 → limited bullish momentum
________________________________________
📌 Outlook:
Gold may continue to consolidate between $3300 and $3315 in the short term. If it fails to close above $3315, bearish pressure could return toward $3295–$3288.
________________________________________
💡 Suggested Trade Setups:
🔻 SELL XAU/USD: $3315 – $3318
🎯 TP: 40/80/200 pips
❌ SL: $3323
🔺 BUY XAU/USD: $3295 – $3300
🎯 TP: 40/80/200 pips
❌ SL: $3285
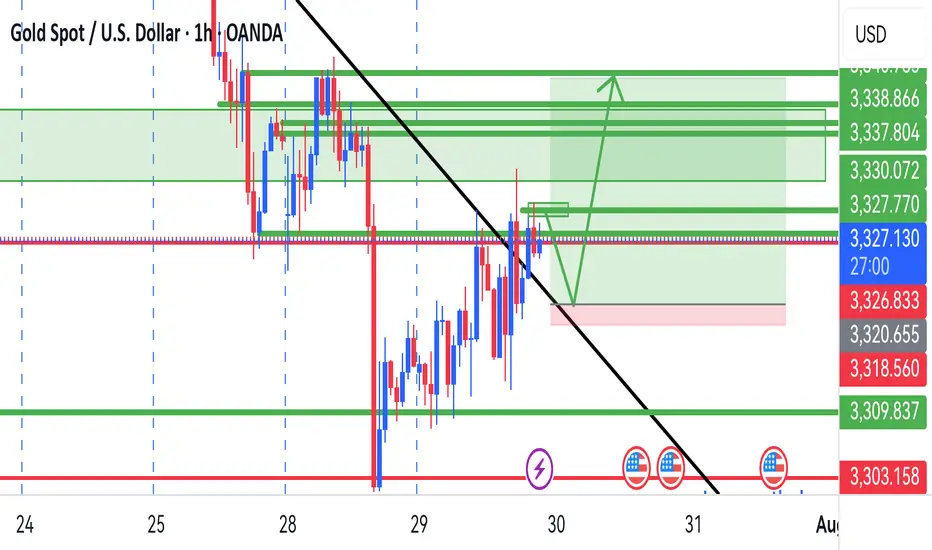
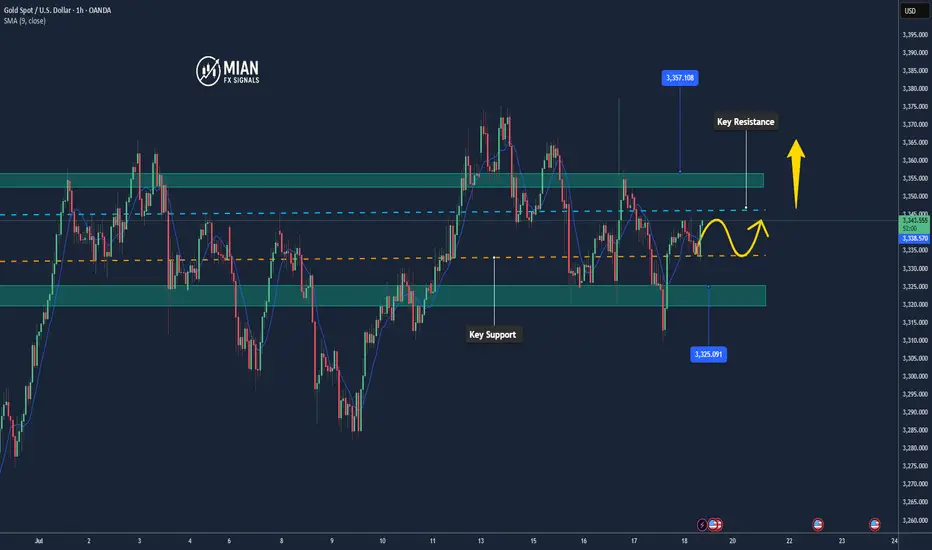
Gold Continues Mild Uptrend – Watching for Reaction at $3351📊 Market Overview:
Gold maintained its bullish momentum during the Asian–European session, rising from $3330 to $3344. A slightly weaker USD and safe-haven demand supported prices. However, price is now approaching a key resistance zone, where technical rejection may occur in the U.S. session.
________________________________________
📉 Technical Analysis:
• Key near-term resistance: $3345 – $3351
• Stronger resistance (higher zone): $3360 – $3366 and $3374
• Nearest support: $3335 – $3332
• Stronger support (lower zone): $3322 – $3315
• EMA 09 (H1): Price is above EMA09 → confirms short-term uptrend
• Candlestick / Volume / Momentum:
• Price is consolidating in an ascending triangle
• A breakout above $3345 may target $3360+
• RSI remains below overbought; volume is stable → room for continuation
________________________________________
📌 Outlook:
If gold holds above $3335 and breaks above $3351, the uptrend could extend toward the $3366–$3374 zone. However, failure to break $3351 followed by a drop below $3332 could lead to a deeper pullback toward $3315.
💡 Recommended Trading Strategies:
BUY XAU/USD: $3318 – $3315
🎯 TP: 40/80/200 PIPS
❌ SL: $3321
SELL XAU/USD: $3360 – $3363
🎯 TP: 40/80/200 PIPS
❌ SL: $3357
Gold Bounces Back After Testing Key Support📊 Market Drivers
• Gold dropped to around $3,352, touching a key support zone, then quickly rebounded to $3,373, gaining over +20 points.
• The rebound is supported by continued weakness in the US Dollar and slight easing in Treasury yields, keeping gold attractive as a safe haven.
• Although some optimism around US-Japan trade negotiations slightly reduced risk aversion, it wasn’t enough to push gold below support.
📉 Technical Analysis
• Key Resistance:
o $3,397 – $3,400: psychological resistance and near the next bullish breakout zone.
o If breached, next target lies around $3,420–3,445.
• Nearest Support:
o $3,356 – $3,364: recently confirmed support zone that triggered the current rebound.
o Deeper support at $3,326 – $3,320 if the rebound fails.
• EMA (EMA50):
o Price remains above the 50-period EMA, indicating bullish momentum in the short term.
• Patterns & Momentum:
o Market structure shows a "rising low" pattern — a bullish signal that buyers are stepping in at higher levels.
o RSI was briefly in oversold territory and now supports a recovery bounce.
o If $3,356 holds, the upside targets remain valid toward $3,397 → $3,439.
📌 Assessment
• Gold has confirmed strong support at $3,356–3,364, with the rebound from $3,352 as proof.
• Short-term uptrend remains intact, unless the USD strengthens sharply or unexpected macro news hits.
• If gold breaks below $3,356, it may retrace toward $3,326–3,320, but the upside potential is currently favored.
💡 Suggested Trade Setups
BUY XAU/USD: $3,356–3,364
🎯 Take Profit: 40/80/200 pips
❌ Stop Loss: $3,346
SELL XAU/USD: $3,397–3,400
🎯 Take Profit: 40/80/200 pips
❌ Stop Loss: $3,407
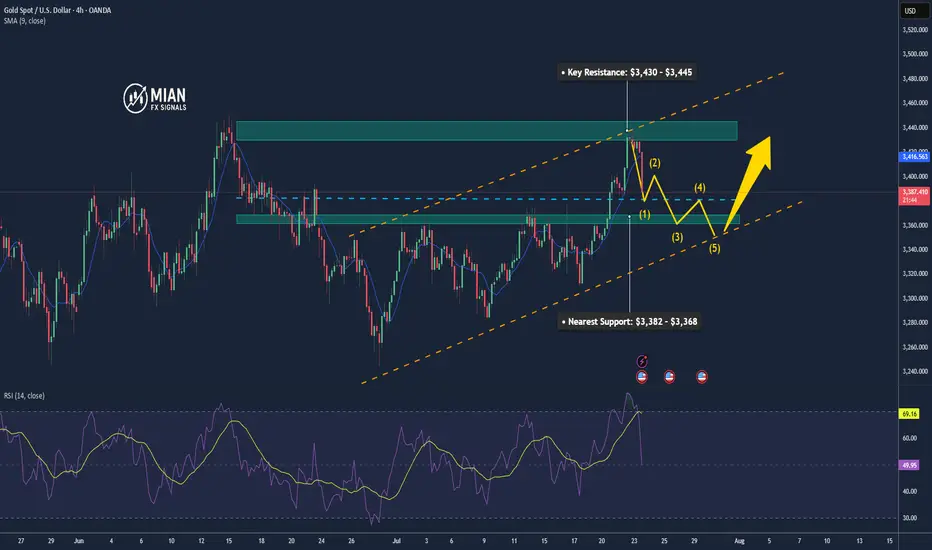
Gold Pulls Back to Support Zone📊 Market Overview:
• Gold price fell sharply to $3,385/oz, after previously testing the $3,430 zone.
• Short-term profit-taking and anticipation of upcoming U.S. economic data (PMI, durable goods orders) caused a mild USD rebound, pressuring gold lower.
• Overall sentiment remains cautious as the Fed has yet to clearly signal a rate cut path.
📉 Technical Analysis:
• Key Resistance: $3,430 – $3,445
• Nearest Support: $3,382 – $3,368
• EMA 09: Price just broke below the 9 EMA, suggesting a potential deeper correction unless it rebounds quickly.
• Candlestick/Volume/Momentum: Bearish engulfing candle with rising volume – indicates strong selling pressure and momentum currently favoring the bears.
📌 Outlook:
Gold is undergoing a short-term correction, currently testing the strong technical support zone at $3,382 – $3,385. If this zone holds, we may see a rebound toward $3,410 – $3,420. If it fails, gold could slide further toward $3,368 – $3,350.
💡 Suggested Trade Strategies:
🔻 SELL XAU/USD at: 3,395 – 3,400
🎯 TP: 3,375
❌ SL: 3,405
Gold Likely to Rise as USD Weakens📊 Market Overview
Spot gold (XAU/USD) is trading around $3,423–$3,427/oz, down ~0.2% after news of a US–Japan trade deal boosted risk sentiment. However, a weaker USD and lower US bond yields continue to support safe-haven demand.
📉 Technical Analysis
• Resistance: $3,447 – $3,464 – $3,496
• Support: $3,399 – $3,367
• EMA9: Price is below EMA9 → short-term bearish; medium-term outlook remains bullish if price reclaims EMA20.
• Momentum indicators: RSI ~69; MACD & ADX favor buyers.
📌 Outlook
Gold may move sideways or edge higher if USD weakness persists. A rise in risk appetite (e.g. from trade deals) could pressure prices short term.
💡 Suggested Trading Strategy
🔻 SELL XAU/USD: $3,442–$3,445
🎯 TP: 40/80/200 pips | ❌ SL: $3,449
🔺 BUY XAU/USD: $3,402–$3,405
🎯 TP: 40/80/200 pips | ❌ SL: $3,399

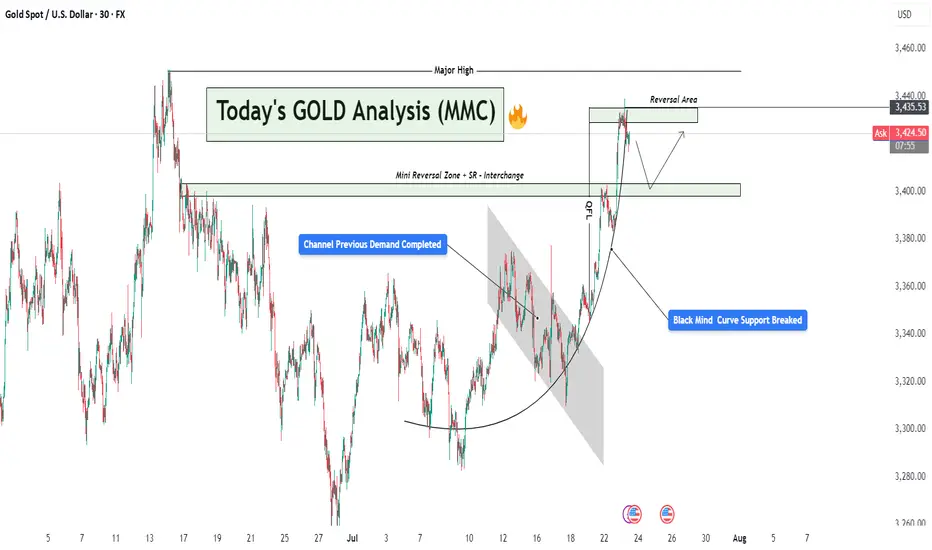
GOLD Rejected from Reversal Zone – Retest + Bounced & Major High📌 1. Major High & Liquidity Grab
The chart starts by showing a strong impulsive move toward the upside that taps into a Major High zone (highlighted at the top). This is a classic MMC "liquidity grab" where price sweeps the previous high to trigger stop losses and collect orders before reversing. This is a common trap zone where retail traders get caught in FOMO buys.
📌 2. Reversal Area Identified
The price entered a clearly marked Reversal Area between $3,430 – $3,445. This zone acted as:
Historical supply area
Psychological resistance
Liquidity hunt zone
Upon entry, strong rejection candles formed, signaling institutional sell pressure. This reaction aligns with MMC principles where reversal is expected post-liquidity collection from major highs.
📌 3. Parabolic Curve Formation – Bullish Impulse
A beautifully formed parabolic curve (Black Mind Curve) supported the bullish rally from around $3,310 up toward the high. This shows accumulation → breakout → expansion. However, the curve has now been broken, suggesting that bullish momentum is weakening.
⚠️ This break of curve support is critical — it often leads to a corrective phase or a deeper retracement.
📌 4. Mini Reversal Zone + SR Interchange Zone
Price has now pulled back to a very important area: the Mini Reversal Zone + SR Flip Zone around $3,400. This zone previously acted as resistance and now has the potential to act as support (classic SR interchange).
According to MMC concepts:
If this zone holds → we may see a bullish bounce and potential re-test of the upper reversal area.
If this zone breaks → bears will likely push price toward the next demand level around $3,350 – $3,340.
This is the decision point — a “battlefield” zone where market direction can be decided.
📌 5. Potential Scenarios Ahead:
✅ Bullish Scenario:
Price respects the SR zone ($3,400)
Forms bullish engulfing / continuation pattern
Likely target: re-test of reversal zone ($3,430–$3,445)
Beyond that: breakout possible if volume supports it
❌ Bearish Scenario:
Price breaks below $3,395 with strong bearish candles
Could confirm the rejection from the major high and trigger a full retracement
Downside targets: $3,360 → $3,340 range
🔑 Final Thoughts:
This GOLD setup is a perfect case of MMC theory in action — liquidity grab at the top, rejection at reversal zone, curve break, and now testing critical SR flip area.
Keep an eye on:
Candlestick behavior at the SR zone
Volume confirmation
Momentum indicators (if using)
Wait for confirmation before jumping in — let the market reveal its hand at the decision zone.
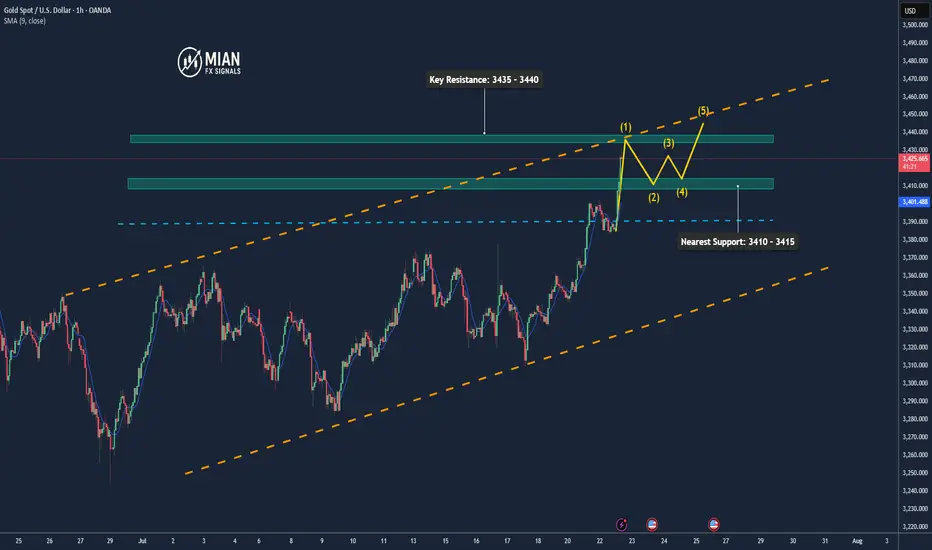
Gold Maintains Strong Momentum, Eyes 3435+📊 Market Drivers:
• Gold prices surged as the USD weakened further and U.S. bond yields dropped.
• Investors are increasingly betting that the Fed may cut interest rates in 2025, boosting demand for gold.
• Ongoing trade tensions and expectations of comments from Fed officials are adding to bullish momentum.
📉 Technical Analysis:
• Key Resistance: 3435 – 3440
• Nearest Support: 3410 – 3415
• EMA09: Price is above the EMA09 → confirms short-term uptrend
• Pattern & Momentum: Clean breakout from the 3383–3390 range with strong volume, bullish momentum continues
📌 Outlook:
Gold may continue rising in the short term if it holds above 3415. A pullback could offer a chance to re-enter long positions near new support levels.
________________________________________
💡 Suggested Trade Setup:
🔺 BUY XAU/USD: 3415 – 3418 (on pullback)
🎯 TP: 40/80/200 pips
❌ SL: 3412
🔻 SELL XAU/USD: 3435 – 3438 (key resistance)
🎯 TP: 40/80/200 pips
❌ SL: 3442
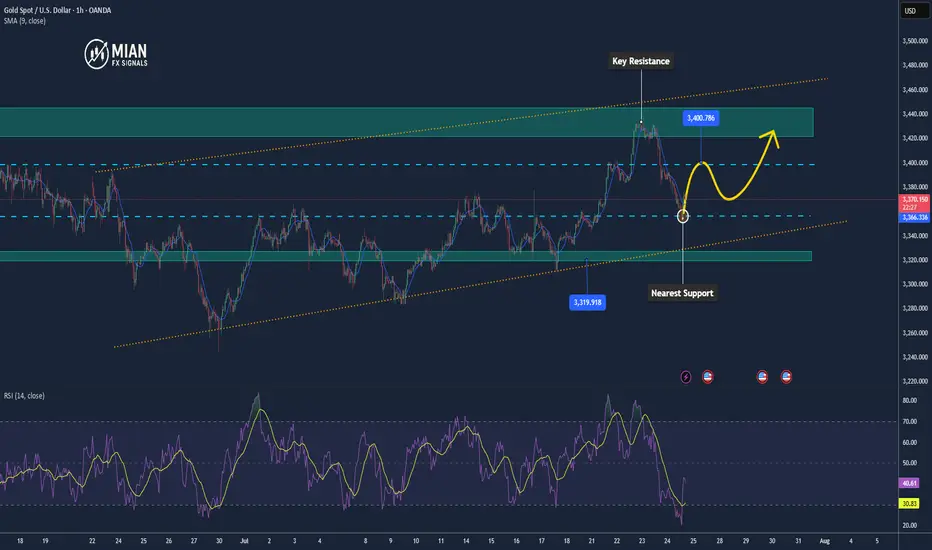
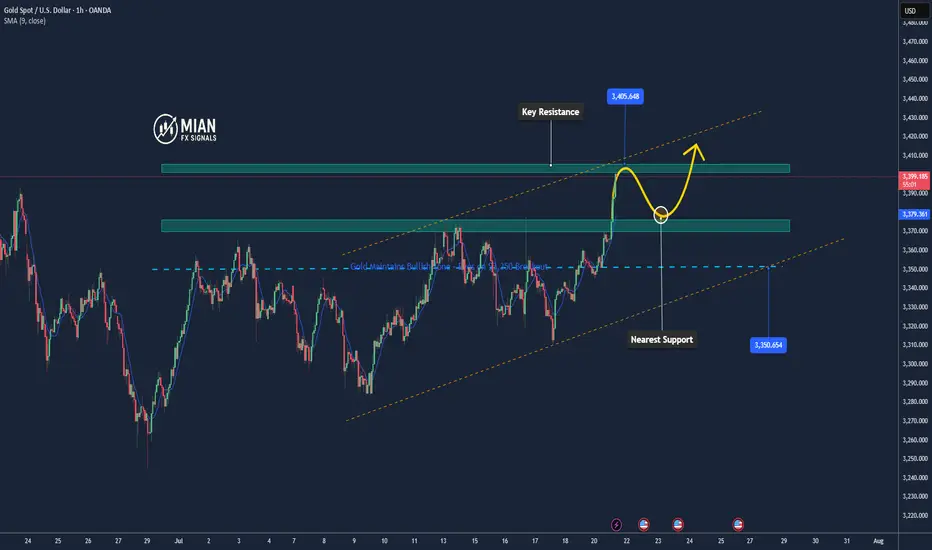
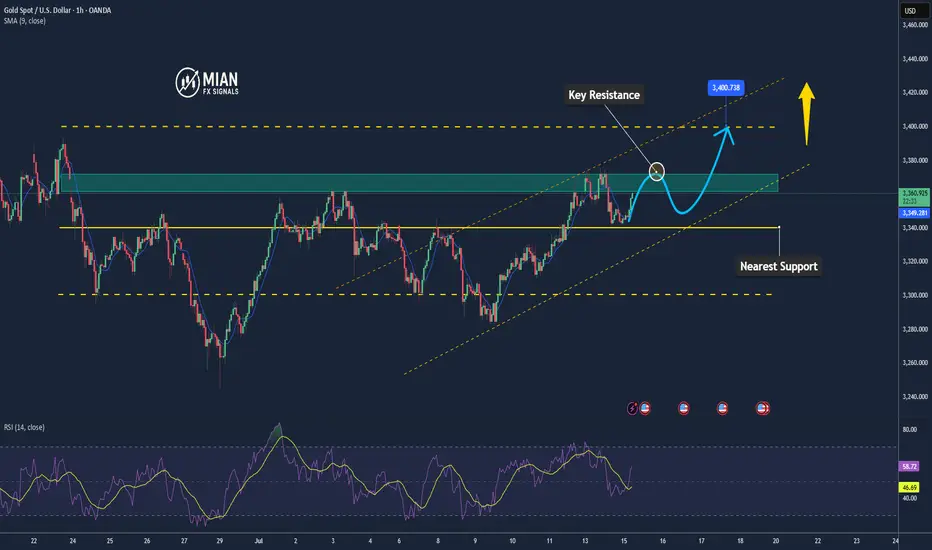
Gold Could Extend Rally if Breaks 3,400📊 Market Overview
Gold is currently trading around 3,400 USD/oz, up approximately +1.41% over the past 24 hours.
The upward momentum is supported by a weakening US Dollar following dovish-leaning remarks from the Fed, along with growing demand for safe-haven assets amid trade uncertainties.
📉 Technical Analysis
• Key Resistance: ~3,400–3,405 USD (psychological zone; a break above could open the path for further gains).
• Nearest Support: ~3,370–3,375 USD, followed by 3,345–3,350 USD, which marks today’s low.
• EMA 09/20: Price is currently trading above both EMA 9 and EMA 20, confirming a short-term uptrend.
• Momentum / Oscillators: RSI is in the overbought zone; MACD and ADX still show a “buy” signal → bullish trend continues, but watch for possible technical pullbacks.
📌 Opinion
The price may continue to rise if it breaks above the 3,400 USD/oz level, especially if the USD remains weak and safe-haven flows continue to support gold. However, if there’s short-term selling pressure or a USD rebound, gold may pull back toward the 3,370–3,375 USD support zone.
💡 Trade Setup
SELL XAU/USD at: 3,400–3,405 USD
🎯 TP: 3,380 USD
❌ SL: 3,410 USD
BUY XAU/USD at: 3,370–3,375 USD
🎯 TP: 3,390–3,395 USD
❌ SL: 3,360 USD
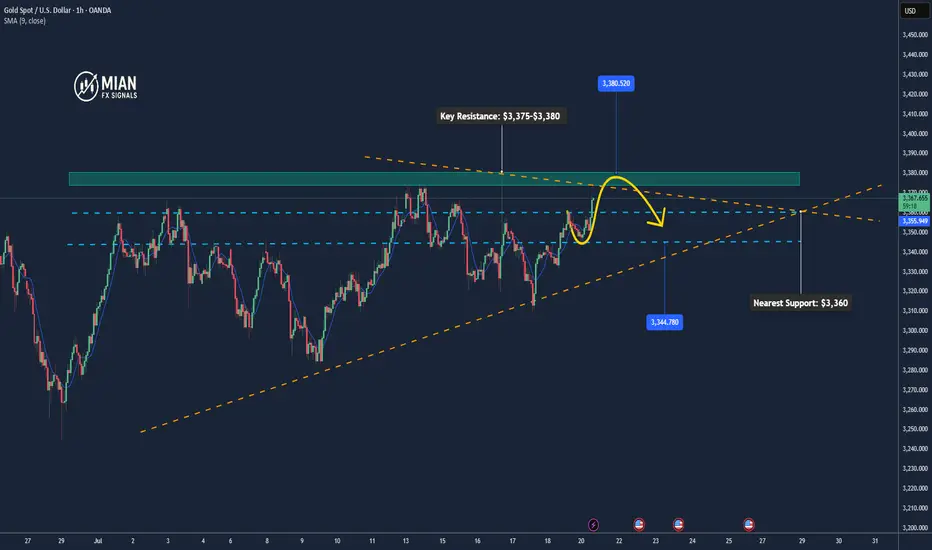
Gold Approaches New Resistance – Potential Short-Term Pullback📊 Market Update
Gold is currently trading around $3,368–$3,370/oz, up approximately 0.5% today, supported by a weaker USD and slightly declining US Treasury yields. This comes amid global trade concerns and expectations that the Fed may adjust policy in upcoming meetings.
📉 Technical Analysis
•Key Resistance: $3,375–$3,380 (pivot R2: $3,374.9, R3: $3,389.6)
•Nearest Support: $3,360 (S1: $3,335.8)
•EMA: Price is trading above the EMA9 / EMA20 / EMA50 / EMA200, confirming a strong uptrend
•Candlestick / Volume / Momentum:
o MACD & ADX still confirm strong bullish momentum
o Price consolidating in a rectangle range of $3,352–$3,366 → watch for breakout or rejection at resistance
📌 Outlook
Gold may pull back slightly if it fails to break through the $3,375–$3,380 resistance area and RSI continues hovering near overbought levels.
💡 Suggested Trade Strategy
🔻 SELL XAU/USD at: $3,375–$3,380
🎯 TP: 40/80/200 pips
❌ SL: $3,385
🔺 BUY XAU/USD at: $3,345–$3,348
🎯 TP: 40/80/200 pips
❌ SL: $3,339
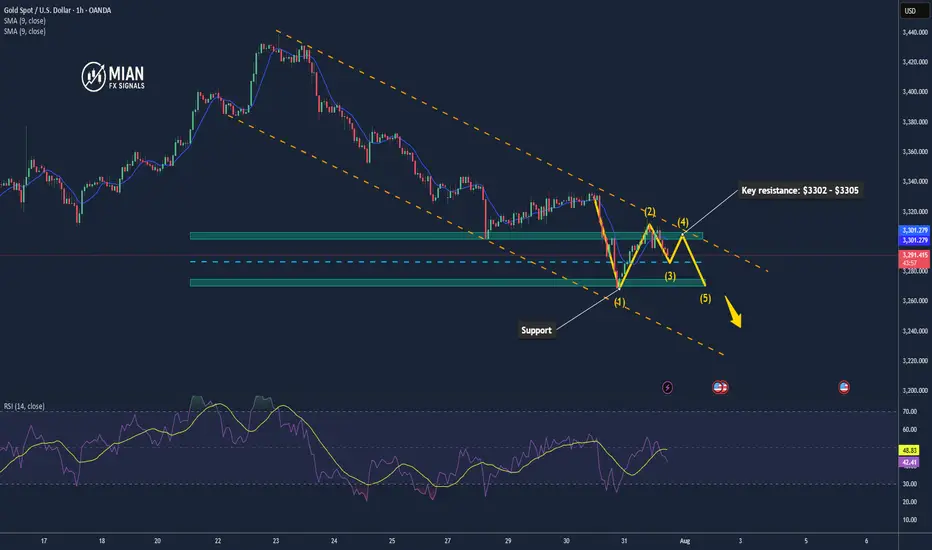
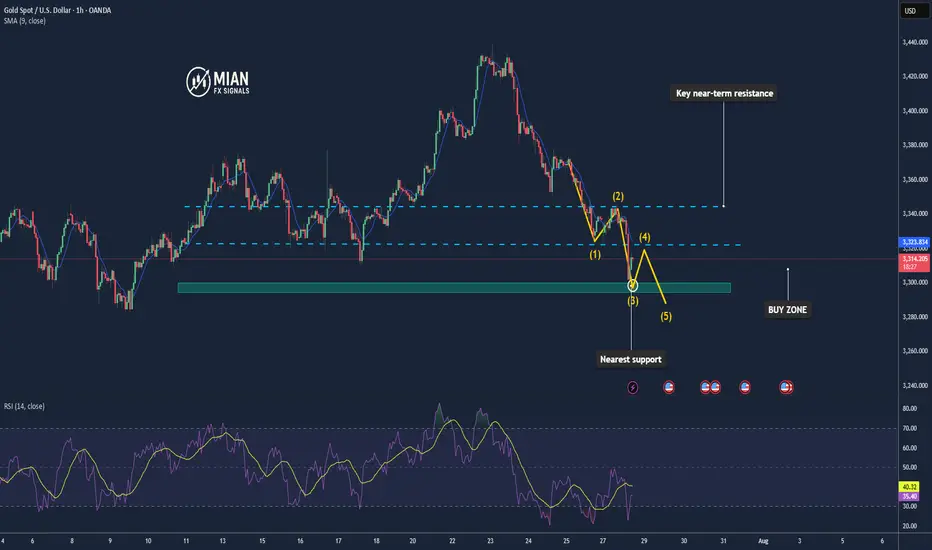
Gold SELL SetupHi everyone
This is our out look for Monday trading day. We have completed a second wave retracement & can sell off from 3354 to 3328 possible.
Always remember to apply proper risk management.
Let us know in the comments what you think of the setup & where you see gold go.

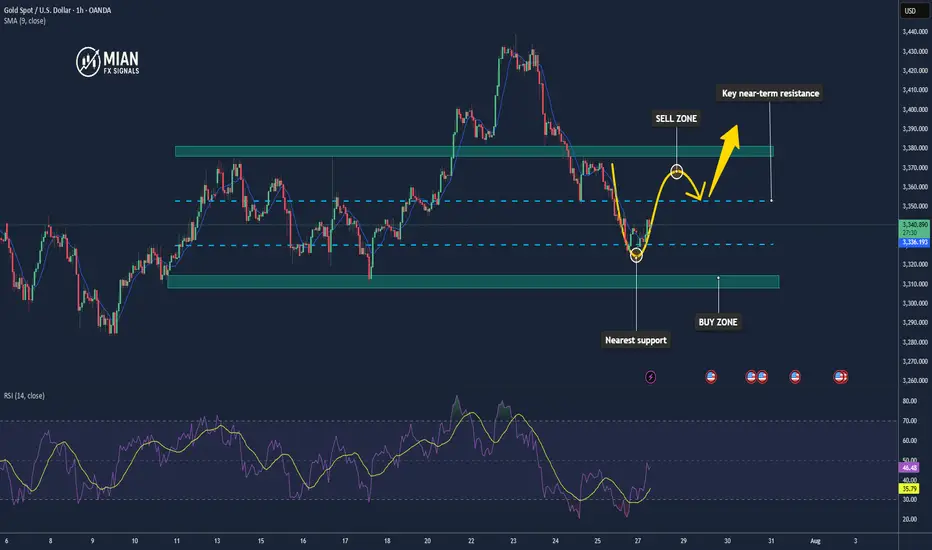
Gold Maintains Bullish Tone – Eyes on $3,350 Breakout📊 Market Overview
• Gold is trading around $3,339 – $3,340, after rebounding from the session low at $3,332.
• The USD is temporarily weakening, and safe-haven flows remain steady — key factors supporting gold.
• Markets are awaiting fresh U.S. economic data for clearer directional cues.
📉 Technical Analysis
• Key Resistance Levels:
– Near-term: $3,344 – $3,345
– Extended: $3,352 – $3,356 (weekly highs)
• Key Support Levels:
– Near-term: $3,332 – $3,335
– Extended: $3,320 – $3,325 (MA confluence + technical base)
• EMA: Price remains above EMA 09, confirming a short-term uptrend.
• Candle Pattern / Volume / Momentum: RSI is around 54–56; momentum remains positive but has cooled — suggesting potential consolidation.
📌 Outlook
Gold is maintaining a bullish technical structure — if it breaks above $3,345, a move toward $3,352 – $3,356 is likely. On the downside, a drop below $3,332 could trigger a retest of $3,325 – $3,320.
💡 Suggested Trading Strategy
🔺 BUY XAU/USD: $3,324 – $3,327
• 🎯 TP: 40/80/100 pips
• ❌ SL: $3,320
🔻 SELL XAU/USD :$3,352 – $3,355
• 🎯 TP: 40/80/100 pips
• ❌ SL: $3,359
Gold Continues Short Term Uptrend📊 Market Overview:
💬Gold is currently trading around $3,340 – $3,352/oz, down slightly (~0.25%) on the day but still consolidating near recent highs around $3,500.
🌍 Geopolitical tensions (trade wars, Middle East conflicts) and strong central bank gold purchases continue to support long-term demand.
📅Markets are awaiting key U.S. inflation data and Fed signals, which may trigger volatility in the short term.
📉 Technical Analysis:
🔺Key resistance: $3,360 – $3,380, with the psychological zone at $3,400–$3,420.
🔻Nearest support: $3,330 – $3,332, followed by a firmer zone at $3,300–$3,326 (based on Fibonacci and moving averages).
• EMA/MA:
✅ Price is trading above the 50-day MA ($2,862), confirming a medium-term uptrend.
⚠️ While no specific EMA 09 data is noted, current price action suggests bullish momentum.
• Momentum / Candlestick / Volume:
📏RSI (14) is near 50–55, signaling positive momentum without being overbought.
🔄MACD is slightly negative but the overall structure remains bullish.
📌 Outlook:
Gold may continue to rise in the short term if it holds above the $3,330–$3,332 support zone, with potential to test resistance at $3,360–$3,380 and possibly revisit the $3,400 level.
A break below $3,330 could open the path toward deeper support around $3,300.
💡 Suggested Trading Strategy:
SELL XAU/USD: 3,367–3,370
🎯 TP: 40/80/200 pips
❌ SL: 3,374
BUY XAU/USD: 3,330–3,333
🎯 TP: 40/80/200 pips
❌ SL: 3,326

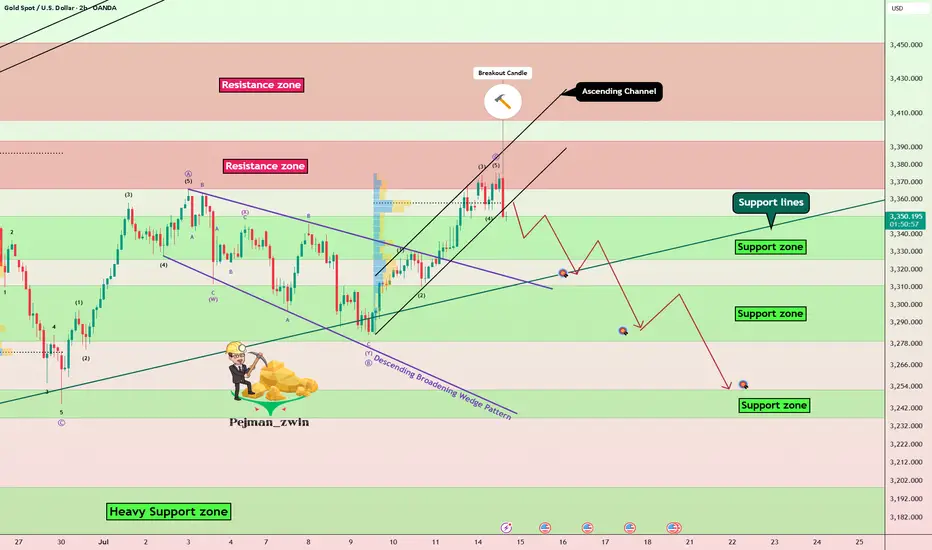
Gold Roadmap: Next Stop $3,325 After Ascending Channel Break?Gold ( OANDA:XAUUSD ) failed to touch the Potential Reversal Zone(PRZ) in the previous idea , and I took the position at $3,351 = Risk-free.
Gold is moving in the Resistance zone($3,366-$3,394) and has managed to break the lower line of the ascending channel .
In terms of Elliott Wave theory , with the break of the lower line of the ascending channel, it seems that gold has completed the Zigzag correction(ABC/5-3-5) .
I expect Gold to trend downward in the coming hours and succeed in breaking the Support zone($3,350-$3,325) and attacking the Support line again , and probably succeeding in breaking this line this time.
Note: Stop Loss (SL) = $3,396
Gold Analyze (XAUUSD), 1-hour time frame.
Be sure to follow the updated ideas.
Do not forget to put a Stop loss for your positions (For every position you want to open).
Please follow your strategy; this is just my idea, and I will gladly see your ideas in this post.
Please do not forget the ✅ ' like ' ✅ button 🙏😊 & Share it with your friends; thanks, and Trade safe.
Gold Short Term OutlookGold has pulled back sharply from the 3,354 resistance but found support inside the Pullback Zone (3,335–3,3305 where buyers have stepped back in. Price is now attempting to reclaim ground, trading around 3,341, with the 50MA acting as dynamic resistance overhead and the 200MA as dynamic support.
For the bullish move to continue, we need to see a clean break and hold above 3,354. That would reopen the path toward 3,383 and 3,400, with 3,416 as the higher-timeframe target.
If price fails to clear 3,354 and rolls over again, watch the Pullback Zone (3,335–3,305) for signs of exhaustion. A break below 3,305 would shift focus to the deeper Support Zone (3,289 - 3,267) and potentially toward 3,241 - 3,208 if bearish pressure accelerates.
📌 Key Levels to Watch
Resistance:
‣ 3,354
‣ 3,383
‣ 3,400
‣ 3,416
Support:
‣ 3,335
‣ 3,305
‣ 3,289
‣ 3,267
‣ 3,241
🔎 Fundamental Focus – PPI Release Today
Today’s U.S. Producer Price Index (PPI) will be closely watched as a follow‑up to yesterday’s CPI data.

Gold Likely to Extend Gains as USD Weakens, but Faces Resistance📊 Market Move:
Gold surged to a three-week high near $3,370/oz, driven by safe-haven demand amid renewed trade tensions between the U.S. and EU/Mexico and threats of a 100% tariff on Russian imports.
Investors are now focused on upcoming U.S. CPI data, which could trigger sharp moves if inflation comes in below expectations.
📉 Technical Analysis:
• Key Resistance: ~$3,365–$3,372; a breakout could open the way to $3,400–$3,440
• Nearest Support: ~$3,340 (S1), then ~$3,326 (SMA50), and deeper at $3,300–$3,320 (Fibonacci zone)
• EMA: Price remains above short-term EMAs (20/50/100), suggesting a continuing bullish bias
• Candlesticks / Volume / Momentum:
• RSI is neutral-to-bullish around 54; MACD shows strengthening bullish momentum
• Bollinger Bands are narrowing, signaling potential for a breakout
📌 Outlook:
Gold may continue edging higher or consolidate around the $3,365–$3,372 resistance zone if no new geopolitical shocks occur. However, if U.S. CPI comes in below expectations or if USD/Yields weaken, gold could rally further toward $3,400–$3,440.
________________________________________
💡 Suggested Trading Strategy
🔻 SELL XAU/USD at: $3,370–3,373
🎯 TP: 40/80/200 pips
❌ SL: $3,376
🔺 BUY XAU/USD at: $3,340–3,337
🎯 TP: 40/80/200 pips
❌ SL: $3,334
Gold May Temporarily Correct Under Resistance Pressure📊 Market Overview:
• Gold reached resistance around $3,365–$3,370/oz before showing signs of cooling due to mild profit-taking.
• Ongoing trade tensions and geopolitical risks — such as President Trump’s tariff plan — continue to support safe-haven demand, driving gold close to a three-week high.
• Strong central bank purchases reinforce the long-term bullish outlook.
📉 Technical Analysis:
• Key Resistance: $3,365–$3,370
• Nearest Support: $3,300–$3,320
• EMA 09: Price is currently below the EMA 09, suggesting a potential short-term pullback. (Price is still above the EMA50, supporting the recent uptrend.)
• Candlestick patterns / Volume / Momentum:
o RSI near 57 – neutral but slightly declining.
o MACD and ADX remain bullish, indicating underlying strength but with possible short-term consolidation ahead.
📌 Outlook:
Gold may experience a short-term pullback if it fails to break through the $3,365–$3,370 zone and geopolitical tensions ease.
However, the medium-to-long-term trend remains bullish, especially as central banks continue to accumulate gold and global risks persist.
💡 Suggested Trading Strategy:
SELL XAU/USD: $3,363–$3,366
🎯 Take Profit: 40/80/200 pips
❌ Stop Loss: $3,369
BUY XAU/USD : $3,317–$3,320
🎯 Take Profit: 40/80/200 pips
❌ Stop Loss: $3,214

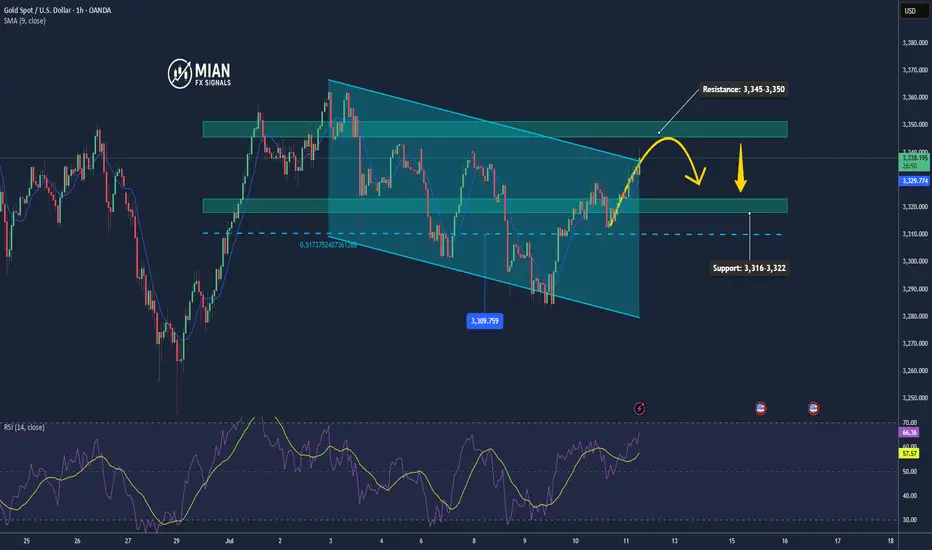
Gold in Equilibrium, Possible Minor Pullback📊 Market Overview:
• Spot gold currently trades around 3,332–3,333 USD/oz
• A slightly weaker US dollar and declining Treasury yields are supporting gold
• Yet strong US jobs data and delayed Fed rate cuts are limiting gold’s upside
• Escalating trade tensions and new tariffs keep safe-haven demand intact
📉 Technical Analysis:
• Resistance: 3,345–3,350 USD, repeatedly tested zone
• Support: 3,316–3,322 USD, strong bottom near 3,310 USD
• EMA 9: Price hovering around it—no clear trend direction
• Momentum/RSI: RSI fading from overbought, momentum weakening
• Candle Patterns/Volume: Narrow consolidation, forming pennant structure
📌 Outlook:
Gold is likely to remain range-bound or dip slightly if USD strengthens. Conversely, renewed economic headwinds or Fed dovishness could push gold higher, especially on a break above 3,345 USD.
💡 Suggested Trade Strategy:
SELL XAU/USD : 3.347–3.350
🎯 TP: 40/80/200 pips
❌ SL: 3.355
BUY XAU/USD : 3.316–3.319
🎯 TP: 40/80/200 pips
❌ SL: 3.310
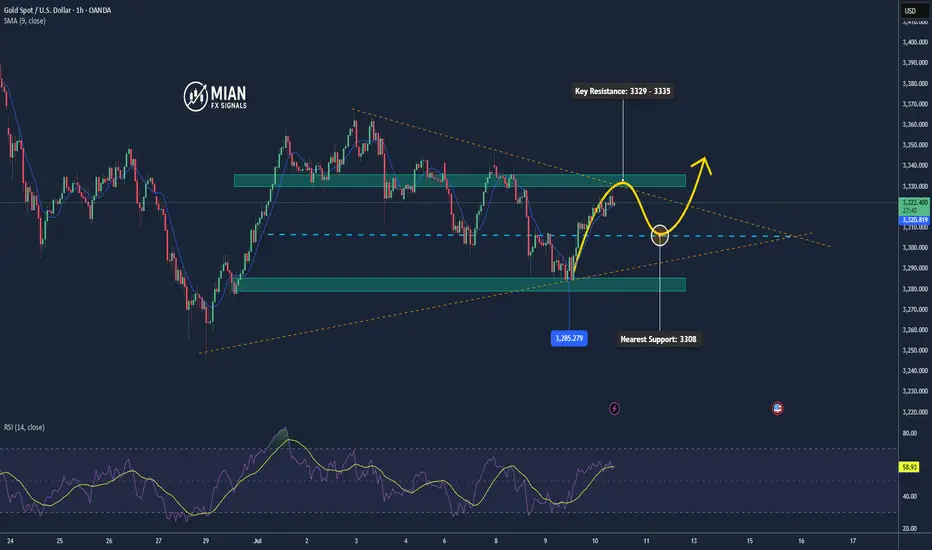
Gold Rejected at 3329.5, Profit-Taking Pressure Rises📊 Market Overview:
Gold surged to 3329.5, approaching key resistance, but quickly dropped to 3319.8 due to strong selling pressure, signaling short-term profit-taking. It’s now slightly recovering and trading around 3321.
📉 Technical Analysis:
• Key Resistance: 3329 – 3335
• Nearest Support: 3308 – 3285
• EMA 09: Price remains above EMA 09 → uptrend still intact.
• Candlestick / Volume / Momentum: H1 candle shows long upper wick at resistance. High volume at the top suggests profit-taking activity.
📌 Outlook:
Gold may continue a short-term correction if it fails to break above 3330 decisively. Bulls need to hold 3308 to maintain the upward structure.
💡 Suggested Trading Strategy:
🔻 SELL XAU/USD : 3330 – 3333
🎯 TP: 40/80/200 pips
❌ SL: 3336
🔺 BUY XAU/USD at: 3302 – 3305
🎯 TP: 40/80/200 pips
❌ SL: 3399
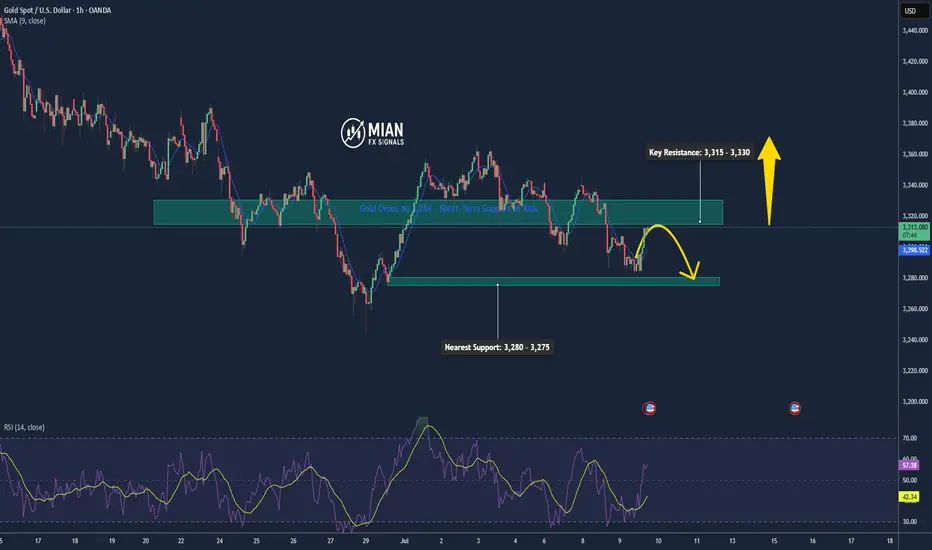
Gold Rebounds from 3283, Eyes 3315 Resistance📊 Market Overview:
• Gold dropped sharply to a low of $3283 earlier today before rebounding strongly back to around $3312, supported by renewed buying interest.
• The recovery is fueled by risk-off sentiment amid ongoing trade negotiation uncertainty and a mild pullback in the U.S. Dollar Index.
• Central bank buying continues to underpin gold’s base, despite mild pressure from rising U.S. bond yields.
________________________________________
📉 Technical Analysis:
• Key Resistance: $3315 – $3335
• Nearest Support: $3280
• EMA 09: Price is trading above the 9-period EMA, signaling a short-term bullish trend.
• Candle pattern / Momentum: A strong bullish engulfing candle formed after bouncing from $3283 on the H1 chart. MACD is crossing upward, and RSI is approaching the 60 level, suggesting bullish momentum.
________________________________________
📌 Outlook:
Gold may continue to recover in the short term if it holds above the $3300 level and successfully breaks through $3315 resistance. However, failure to break above this resistance could lead to a short-term pullback toward $3290–$3280.
________________________________________
💡 Suggested Trading Strategy:
🔻 SELL XAU/USD at: $3315–3325
🎯 TP: $3295
❌ SL: $3330
🔺 BUY XAU/USD at: $3285–3295
🎯 TP: $3315
❌ SL: $3280