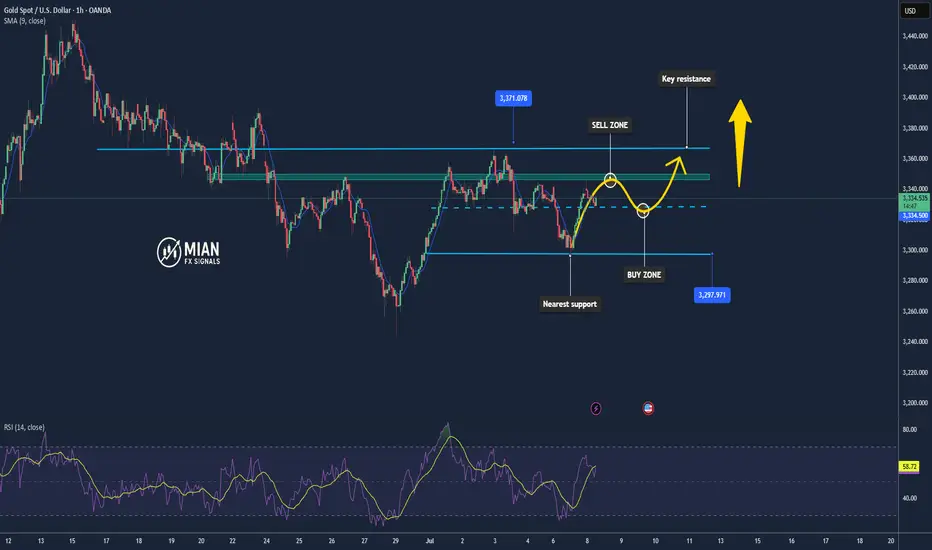
Gold Ranges at $3,330–$3,335 – Ready for the Next Move📊 Market Overview:
Gold is currently trading around $3,330–$3,335/oz, supported by a softer US Dollar and cautious sentiment ahead of key US labor data. According to TradingView, gold is consolidating in a tight range, reflecting market indecision while awaiting a clear breakout signal.
📉 Technical Analysis:
• Key resistance: $3,345–3,350 – a strong supply zone that recently rejected price.
• Nearest support: $3,320–3,330 – multiple bounce points observed here.
• EMA09: Price is hovering around the 09 EMA on both 1h–4h timeframes → neutral/slightly ranging.
• Candlestick / Volume / Momentum:
o A “bearish flag” pattern appears to be forming, suggesting potential for a downside breakout.
o Weak buying volume during upward moves signals limited bullish strength.
📌 Outlook:
• Gold may continue to consolidate between $3,330–$3,345.
• A break above $3,345 with strong volume could open the path to $3,360–$3,380.
• A break below $3,330 could lead to further correction toward $3,300–$3,320.
💡 Suggested Trading Strategy:
SELL XAU/USD at: 3,343 – 3,345
🎯 TP: 40/80/200 pips
❌ SL: 3,355
BUY XAU/USD at: 3,330 – 3,327
🎯 TP: 40/80/200 pips
❌ SL: 3,320
Goldsetup
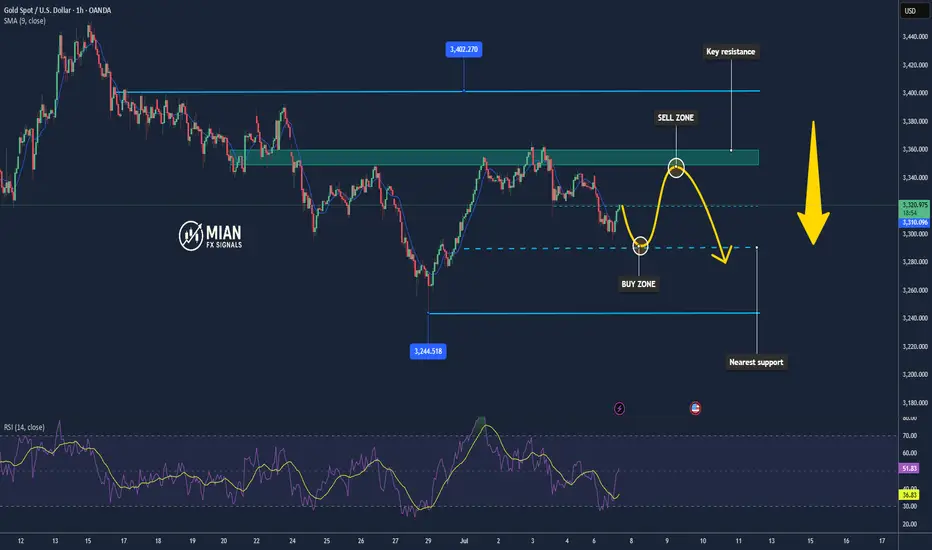
Gold Continues Slight Pullback📊 Market Overview:
• Gold prices dropped ~0.7% to around $3,319/oz as optimism over the US trade negotiations and a tariff delay (from July 9 to August 1) reduced safe-haven demand.
• The US dollar strengthened slightly on upbeat economic data and expectations that the Fed will not cut interest rates in July, adding pressure on gold prices.
📉 Technical Analysis:
• Key resistance: $3,348 – $3,360 – $3,400
• Nearest support: $3,318 – $3,290
• EMA09: Gold is trading below the EMA50, indicating a short- to mid-term bearish bias.
• Candle/volume/momentum: On the 1H and 15-min charts, the price structure shows a clear bearish expansion – trading below pivot levels with a "bearish opening" setup, suggesting strong selling momentum.
📌 Outlook:
Gold may continue to move slightly lower in the short term if positive trade headlines and USD strength persist. However, if there’s unexpected negative news—like geopolitical tensions or a Fed policy pivot—gold could quickly rebound.
💡 Suggested Trading Strategy:
SELL XAU/USD at: 3,348 – 3,350
🎯 TP: ~40/80/200 pips
❌ SL: ~3,355
BUY XAU/USD at: 3,290 – 3,295
🎯 TP: ~40/80/200 pips
❌ SL: ~3,285
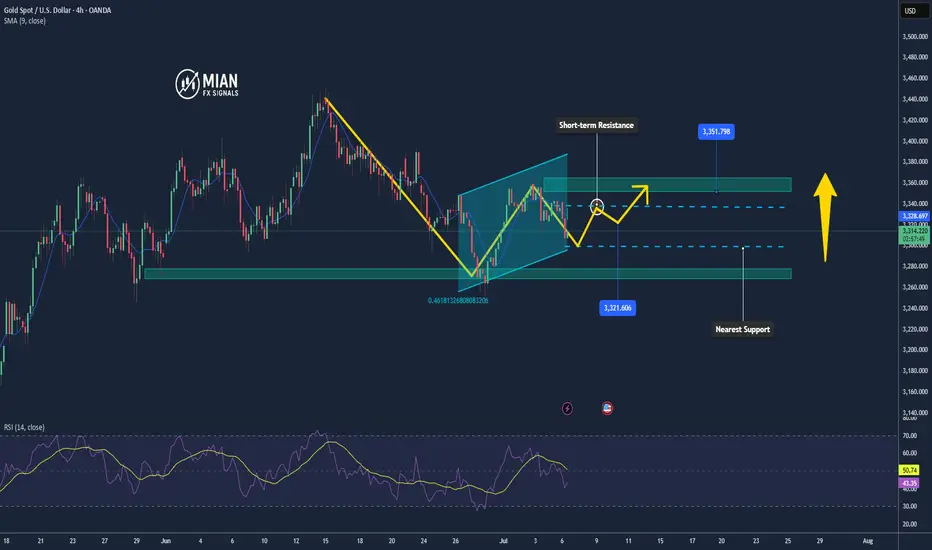
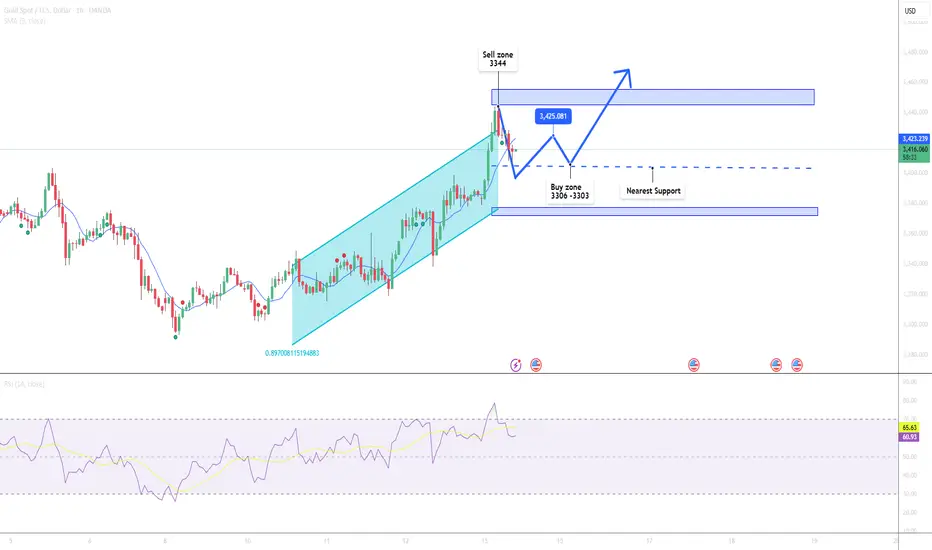
Gold Consolidates Around 3,310 – Waiting for a Breakout📊 Market Developments:
• Gold is currently holding near $3,310, which aligns with the weekly pivot level on TradingView.
• With the upcoming FOMC minutes and key data (CPI, NFP) approaching, the market remains cautious. The USD is stable, keeping gold in a tight range.
📉 Technical Analysis:
• Short-term Resistance: $3,325–3,335 (H4 supply zone)
• Nearest Support: $3,300–3,305 (weekly pivot + H1/H4 lows)
• EMA 09 on H4: Price is trading below EMA09 → short-term bearish bias.
• Candlestick/Volume/Momentum: Lower highs on H4 candles with declining volume indicate weak buying momentum and a possible continuation of consolidation or mild pullback.
📌 Outlook:
• As long as gold stays below $3,305 and the USD remains firm, a pullback toward $3,300–3,295 is likely.
• A break above the $3,325–3,335 resistance zone could trigger a rally toward $3,350 or higher.
💡 Suggested Trade Setup:
🔻 SELL XAU/USD at: $3,322–3,325
🎯 TP: $3,300
❌ SL: $3,332
🔺 BUY XAU/USD at: $3,300–3,303
🎯 TP: $3,325–3,335
❌ SL: $3,295
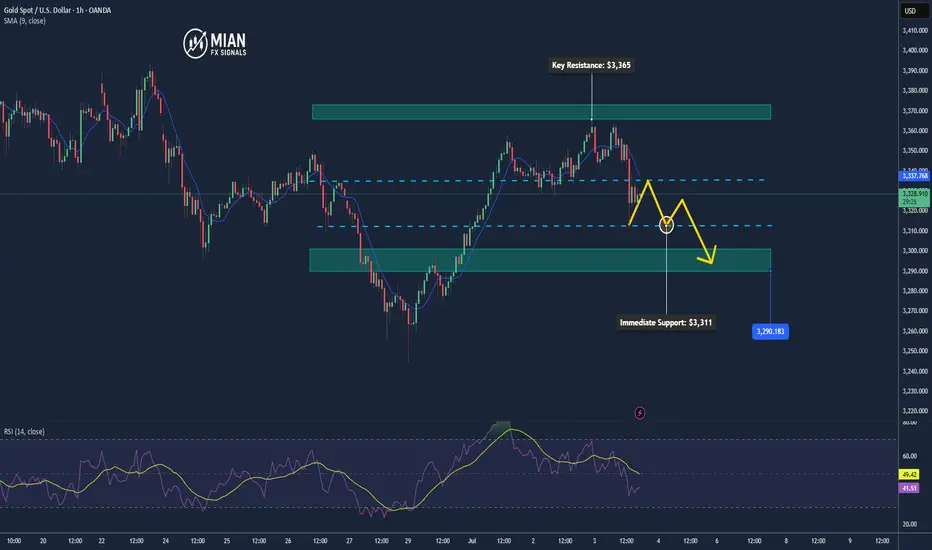
Gold Drops as NFP Beats, USD Gains📊 Market Overview:
• June’s Non-Farm Payrolls came in stronger than expected at +147K (vs 110K forecast), with unemployment ticking down to 4.1%.
• The US Dollar surged (DXY up ~0.5%) and Treasury yields rebounded following the release.
• Gold dropped sharply after the report, hitting a session low of $3,311 and is now trading around $3,328.
📉 Technical Analysis:
• Key Resistance: $3,364
• Immediate Support: $3,311
• EMA 09 (H1): Price is below the 09 EMA → confirms short-term bearish trend.
• Pattern / Momentum: A bearish engulfing candle near $3,364 signaled strong seller control. The failure to bounce afterward suggests persistent bearish pressure. RSI is tilting lower, confirming weakening momentum.
📌 Outlook:
Gold may continue to decline toward the $3,300–$3,290 area if USD and yields remain firm, especially if upcoming US data (such as ISM Services PMI) also supports the dollar strength.
💡 Suggested Trade Setup:
🔻 SELL XAU/USD at: $3,333 – $3,335
🎯 TP: $3,300
❌ SL: $3,339
🔺 BUY XAU/USD at: $3,293 – $3,290
🎯 TP: $3,330
❌ SL: $3,287
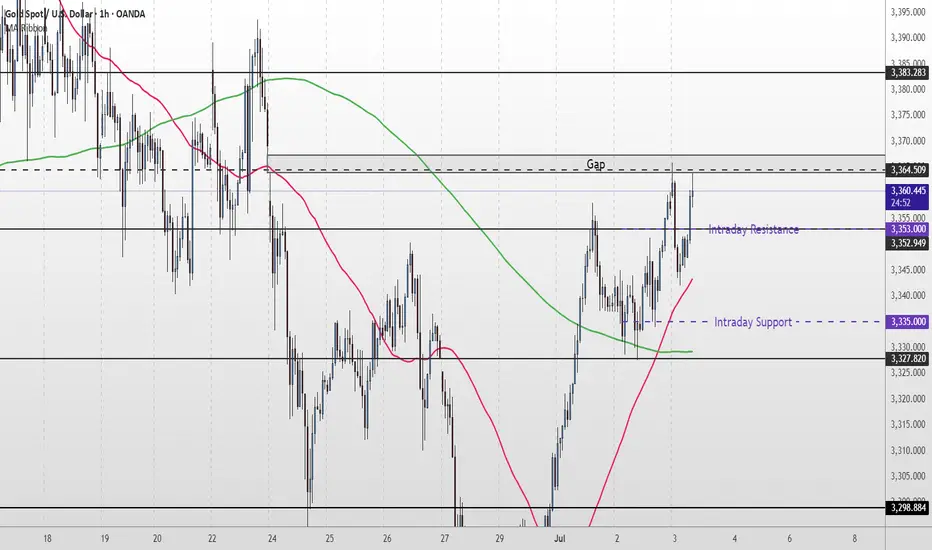
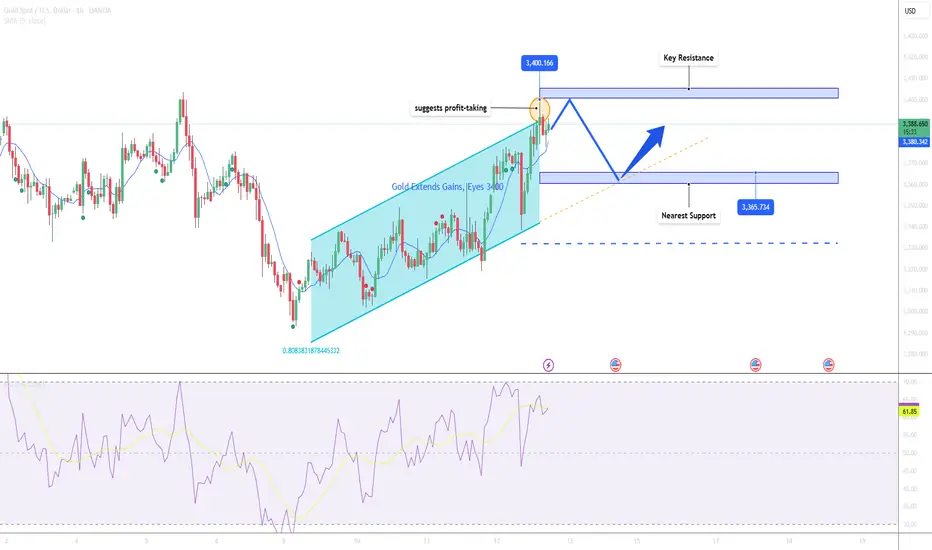
Gold Short Term OutlookYesterday, we highlighted that gold had reclaimed the 200MA and that the $3,327 support level needed to hold for further upside. Since then, price has steadily climbed and is now testing the $3,364 resistance — a level that also aligns with an unfilled gap.
Price action remains bullish for now, with price holding firmly above both the 50MA and 200MA.
If buyers manage to clear and hold above $3,364, we could see further upside toward $3,383 and $3,400, with possible extension into $3,418.
However, if price fails to break above $3,364, we may see a pullback into the $3,335–$3,327 zone. A break below there could open the door for a deeper drop into $3,298 or even $3,270.
📌 Key Levels to Watch:
Resistance:
$3,364 • $3,383 • $3,400 • $3,418
Support:
$3,352 •$3,335 - $3,327 • $3,298 • $3,270
🧠 Fundamental Focus:
📌 ADP Non-Farm Employment Change
📌 Initial Jobless Claims
📌 ISM Services PMI
📌 ISM Non-Manufacturing PMI
⚠️ With multiple red folder events on the calendar, expect elevated intraday volatility. Manage risk accordingly.
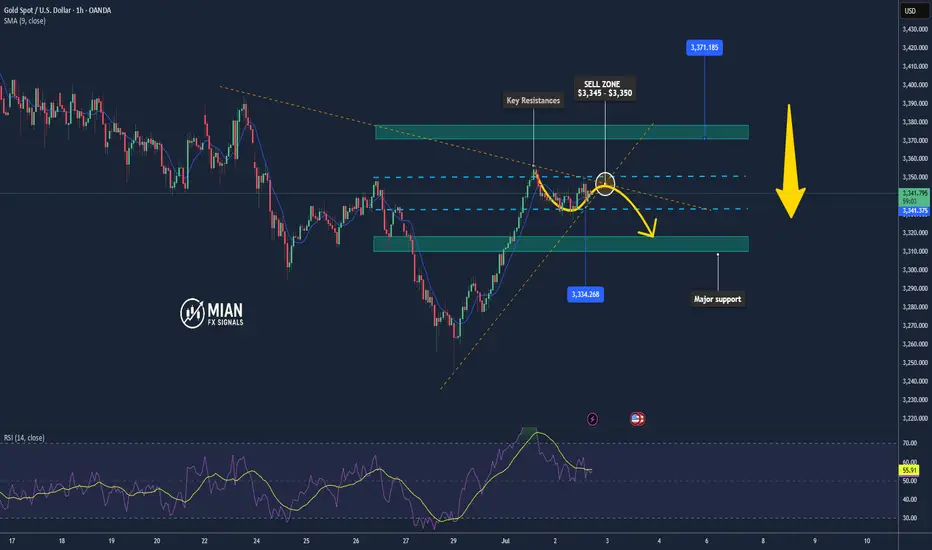
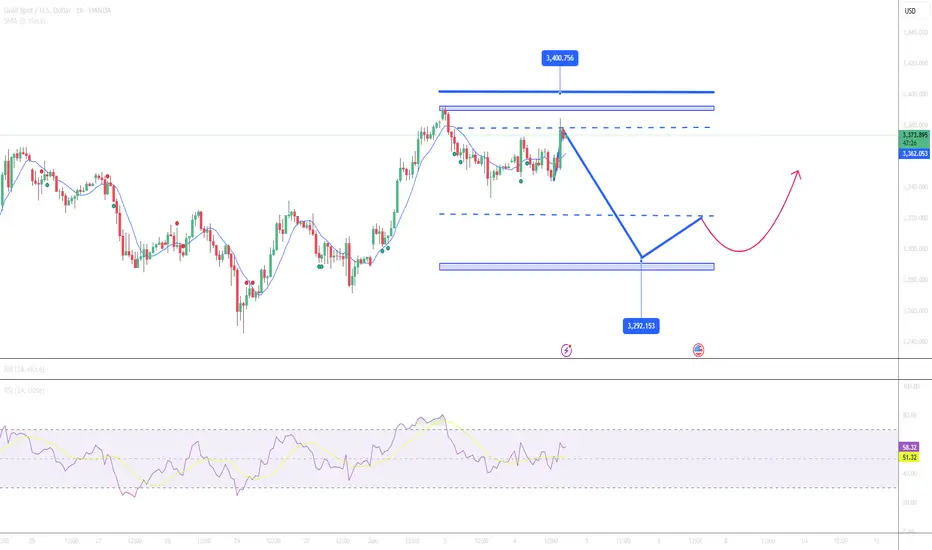
XAUUSD — July 3rd, 2025: Is the Downtrend Finally Over?Gold (XAUUSD) opened today with a bullish gap, and continued the momentum from Tuesday’s breakout above the major downtrendline that had capped the market for weeks. This technical breakout was long-awaited by many traders, and it's now leading us into a potential trend reversal phase — but not without resistance.
Price has now reached a critical resistance zone at 3366, which previously acted as a strong supply area during the last leg of the downtrend. If this level is broken decisively (ideally with a 4H candle close and follow-through), it may signal a clean shift toward a mid-term uptrend, with upside targets at 3379, 3403, and even 3430.
That said, rejection at 3366 has already triggered a minor pullback. We’re now watching the 3343–3351 zone as a potential support and an optimal buy entry area. If this zone holds, it could provide the fuel needed for bulls to continue their push.
🟢 Suggested Trade Plan
BUY LIMIT 3343–3351
Stop Loss 3325
Take Profit 1 3379
Take Profit 2 3403
Take Profit 3 3430
(Alternatively, consider a BUY STOP above 3370 in case of direct breakout)
📌 Market Structure
Resistance 3 3430
Resistance 2 3403
Resistance 1 3382
Pivot 3366
Support 1 3342
Support 2 3322
Support 3 3305
⚠️ Important Macro Alert
Today’s session is highly risky due to the early release of Non-Farm Payrolls (NFP) data, which is scheduled today instead of Friday because of the U.S. Independence Day (July 4) holiday tomorrow.
This brings a major volatility spike risk during the New York session. Manage your position size wisely, avoid emotional trades, and wait for solid confirmations.
Discipline beats prediction. Trade what you see — not what you feel.
Keep healthy so we can keep trading and we can keep on profiting.

Gold Sees Volatile Swings – Pullback Risk Remains📊 Market Highlights:
Gold surged to $3,351 earlier today after weaker-than-expected US ISM manufacturing data, which boosted expectations of a Fed rate cut. However, profit-taking quickly pushed prices down to $3,334 before recovering to $3,342.
📉 Technical Analysis:
• Key Resistance: $3,351
• Nearest Support: $3,334
• EMA: Price is above EMA 09 → uptrend still intact.
• Candles / Volume / Momentum: H1 candle shows a long upper wick, indicating selling pressure near the recent high. Bullish momentum is slowing, and volume has started to normalize.
📌 Outlook:
Gold may face a short-term pullback if it fails to break above $3,351 and the USD strengthens during the US session.
________________________________________
💡 Suggested Trading Strategy:
🔻 SELL XAU/USD at: $3,345 – $3,350
🎯 TP: $3,334
❌ SL: $3,353
🔺 BUY XAU/USD at: $3,332 – $3,334
🎯 TP: $3,350
❌ SL: $3,323
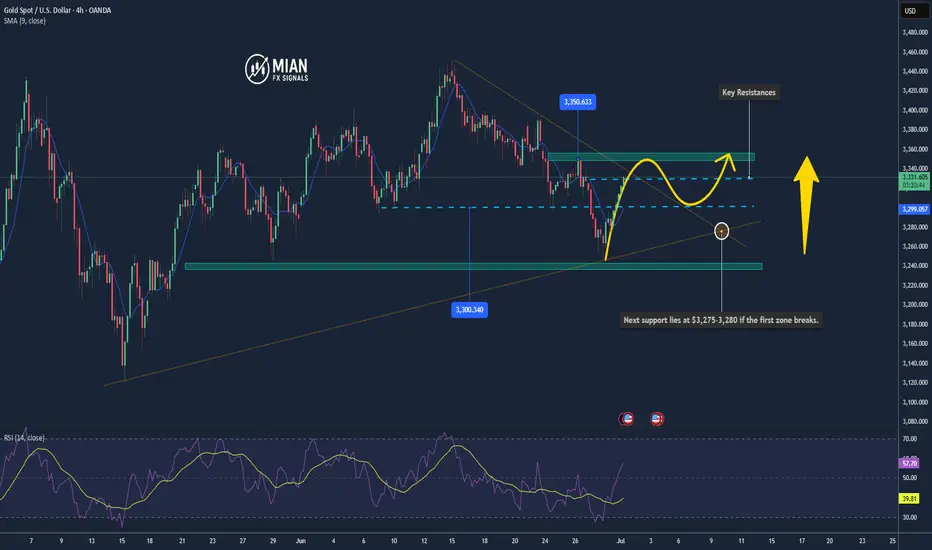
Gold Might Break Higher As It Hits $3,330 Resistance📊 Market Drivers
Gold has just climbed to $3,330/oz, supported by ongoing safe-haven demand and a slightly weaker U.S. dollar ahead of Fed Chair Powell’s speech. Investor expectations of a rate cut in September are keeping bullish momentum alive.
________________________________________
📉 Technical Analysis
• Resistance:
→ $3,330–3,335 (50-day SMA & Fibonacci level)
A breakout above $3,335 could open the door to $3,350+.
• Support:
→ $3,300–3,310 (psychological level & EMA9)
→ Next support lies at $3,275–3,280 if the first zone breaks.
• EMA09:
Price is currently above the 9-EMA, confirming a short-term bullish trend.
• Momentum Indicators:
o MACD is bullish; Stochastics is high — all signaling upside, though a short-term pullback may occur if the resistance holds.
________________________________________
📌 Outlook
Gold is likely to continue climbing in the short term if it breaks above the $3,330–$3,335 resistance zone, fueled by bullish sentiment and dovish Fed expectations.
If it fails to break higher, a minor correction toward $3,300–$3,310 could follow.
________________________________________
💡 Suggested Trade Strategy
BUY XAU/USD : $3,320–3,325
🎯 TP: 40/80/200 pips
❌ SL: $3,310
SELL XAU/USD : $3,340–3,345
🎯 TP: 40/80/200 pips
❌ SL: $3,350
Gold Short to Medium Term Outlook
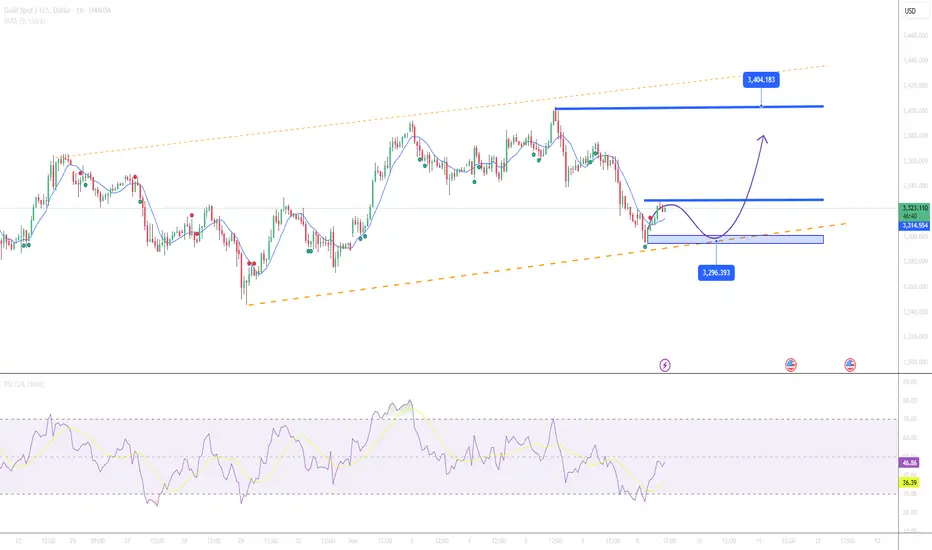
Last week, gold bounced from the lower Support Zone after briefly breaching $3,270. Price is now attempting a recovery, currently trading near $3,290, but remains below both the 50 EMA and 200 EMA — confirming bearish pressure is still intact.
For bulls to gain momentum, we need to see a clean break and hold above $3,298–$3,327which would open the path toward $3,352 and possibly higher resistance levels like $3,364 and $3,383.
Until then, this move may simply be a short-term pullback within a broader downtrend. If price fails to reclaim $3,327, watch for a drop back toward $3,270, with a deeper correction targeting the $3,241–$3,211 zone.
📌 Key Levels to Watch:
Resistance:
$3,298 • $3,327 • $3,352 • $3,364 • $3,383
Support:
$3,270 • $3,241 • $3,211 • $3,179
🧠 Fundamental Focus:
This week is packed with high-impact events — including FOMC minutes on Wednesday and Non-Farm Payrolls on Friday. Both events could trigger sharp moves in gold, so stay cautious and manage risk wisely.

Gold Pulls Back to 3332 Before Mild Rebound📊 Market Overview:
This morning, gold dropped sharply to $3,332/oz, marking the lowest level in recent sessions, due to profit-taking after the early-week rally and a slight recovery in the USD.
However, dip-buying interest returned near key support, pushing the price back up to around $3,350/oz.
The market remains sensitive to Middle East geopolitical headlines and comments from Fed officials scheduled throughout the week.
📉 Technical Analysis:
• Resistance: $3,360 – $3,370
• Support: $3,332 – $3,340 (tested this morning)
• EMA 09: Price is currently below EMA09 ($3,355) → short-term trend remains slightly bearish
• Momentum / Volume / Candlesticks:
o H1 candle shows a bullish hammer formation at $3,332 → signal of potential short-term rebound.
o RSI recovered from oversold (<30) to ~42 → mildly positive signal.
o StochRSI indicates short-term buying pressure, but a break above $3,355 is needed to confirm a reversal.
📌 Outlook:
Gold may see a mild recovery toward the $3,360–3,370 area if buying interest holds near the $3,330 support. However, failure to break above $3,370 could lead to a pullback during the US session.
💡 Suggested Trading Plan:
🔻 SELL XAU/USD at: $3,365–3,370
🎯 TP: $3,345 (~20)
❌ SL: $3,375
🔺 BUY XAU/USD at: $3,332–3,340
🎯 TP: $3,355 (~20)
❌ SL: $3,325

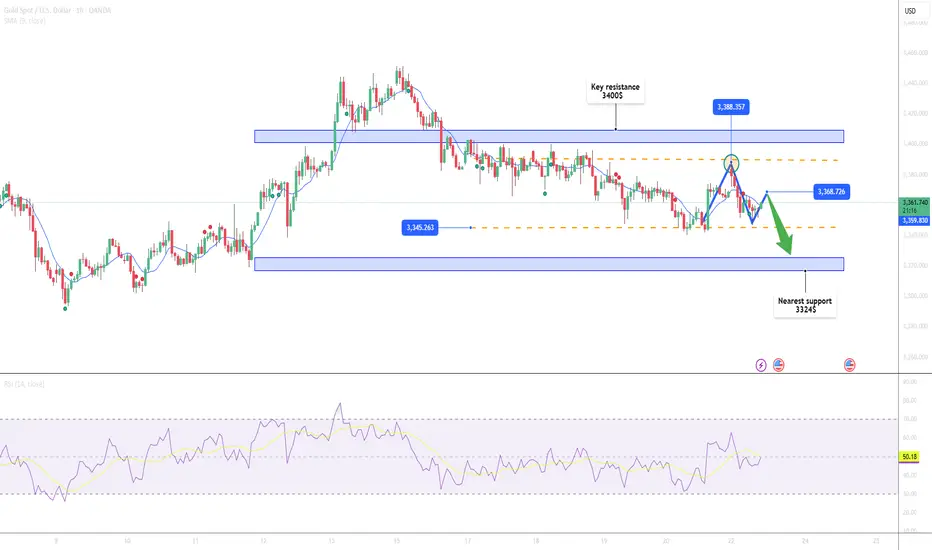
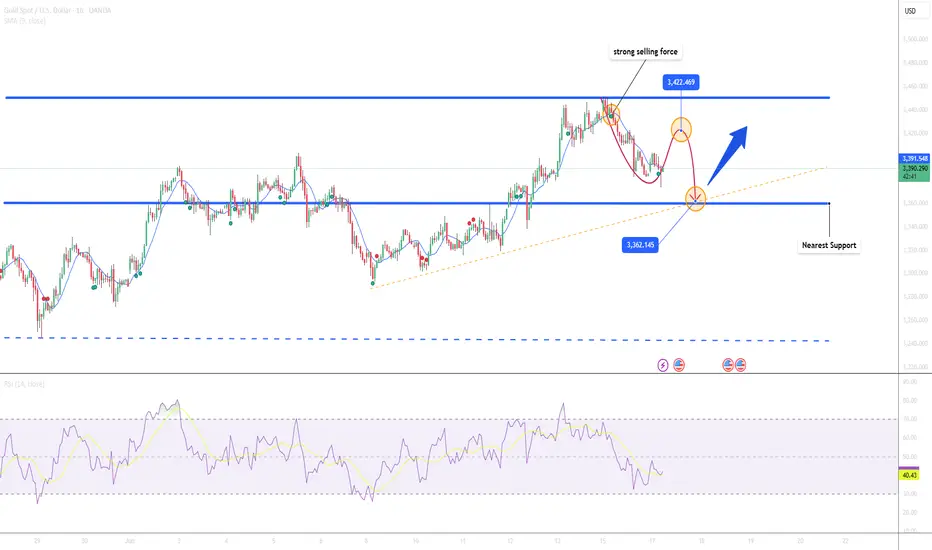
Gold Falling Toward 3345 Support📊 Market Overview
After failing to break the 3,389 resistance zone this morning, gold remains under pressure from profit-taking and a stronger USD. The price has dropped to around $3,360/oz, reflecting defensive sentiment amid ongoing geopolitical tensions in the Middle East.
📉 Technical Analysis
• Key Resistance: 3,389 – 3,400
• Nearest Support: 3,345 – 3,324
• EMA-09: Price is below the EMA-09 on the H1 chart → short-term bearish trend
• Candle Patterns / Volume / Momentum:
o M15 & H1 candles remain bearish
o RSI hovers around 45 → indicating continued correction
o No clear reversal signals yet
📌 Outlook
Gold may continue to decline slightly in the short term if the USD stays strong and no geopolitical surprises arise. However, the 3345 support zone could attract dip buyers.
________________________________________
💡 Suggested Trading Strategy
🔻 SELL XAU/USD at: 3,360 – 3,365
🎯 TP: 3,335 – 3,325
❌ SL: 3,372
🔺 BUY XAU/USD at: 3,320 – 3,324
🎯 TP: 3,340 – 3,344
❌ SL: 3,310
Gold May Dip Slightly Before Rebounding📊 Market Dynamics
• Gold is supported by ongoing Israel–Iran tensions and a weaker USD, despite a slight pullback as some investors take profits.
• Citi has revised its short-term outlook for gold to around $3,300, citing potential for deeper correction in the mid-to-long term if investment demand weakens.
📉 Technical Analysis
• Key Resistance: $3,440 – $3,450 (recent highs)
• $3,420 – minor resistance (psychological mid-level)
• Nearest Support: $3,374 – $3,380 (accumulation zone)
•$3,365 – deeper support, in case $3,374 is breached
• EMA 09: Price remains above both EMA09 and EMA20, signaling that short-term bullish momentum is still intact.
• Candle/Volume/Momentum:
RSI (H1): Currently at 46.8, indicating weakening momentum and potential for further pullback unless a rebound occurs soon. This is a neutral zone – neither overbought nor oversold.
📌 Outlook
With RSI below 50 and buying momentum fading, gold may undergo a mild correction toward the $3,374–3,380 zone before a clearer trend emerges. A break below $3,365 would likely trigger a short-term bearish shift. Conversely, if support holds and RSI climbs above 50, a bullish reversal could follow.
💡 Suggested Scalping Setup
• SELL XAU/USD at: $3,440–3,445
🎯 TP: $3,420
❌ SL: $3,451
• BUY XAU/USD at: $3,374–3,380
🎯 TP: $3,395
❌ SL: $3,365

Gold Pulls Back After Testing Resistance📊 Market Overview:
Gold fell to a low of $3,374 earlier today after testing the $3,434 resistance late last week. The drop was primarily due to profit-taking near recent highs, alongside a mild recovery in the US dollar. Despite this pullback, the medium-term uptrend remains supported by expectations of upcoming Fed rate cuts and persistent geopolitical tensions in the Middle East.
📉 Technical Analysis:
• Key Resistance: $3,434 – $3,450
• Nearest Support: $3,374 – $3.360
• EMA: Price remains above both EMA 09 and EMA 20, suggesting a continuation of the short-term bullish trend.
• Candlestick / Volume / Momentum:
o RSI is holding around 61–63, no longer in overbought territory.
o MACD remains positive, though upward momentum has slowed.
o Bearish candles during the Asian session suggest lingering sell pressure near $3,430. A technical rebound from $3,374 is currently underway.
📌 Outlook:
Gold may consolidate between $3,370–$3,390 in the near term. If the $3,360 support holds, a rebound toward $3,420–$3,440 is likely. However, a stronger USD could increase downside pressure.
💡 Suggested Trade Strategy:
🔻 SELL XAU/USD at: $3,410 – $3,420
🎯 TP: $3,385
❌ SL: $3,430
🔺 BUY XAU/USD at: $3,374 – $3,378
🎯 TP: $3,400 – $3,420
❌ SL: $3,360
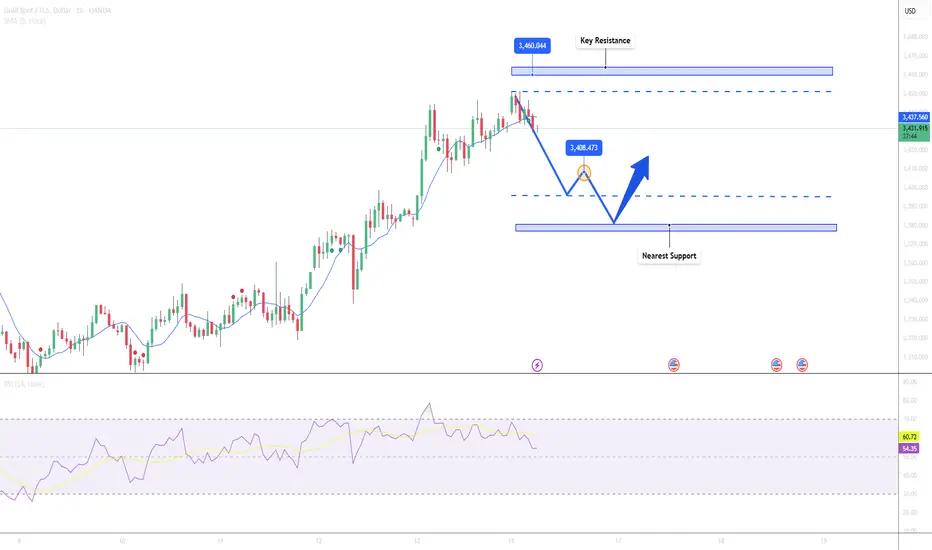
Gold May Pull Back Short-Term📊 Market Overview:
After several strong bullish sessions, gold prices are under short-term pressure as geopolitical tensions in the Middle East temporarily ease and the US Dollar shows slight recovery.
While expectations for a steady Fed policy remain, traders are locking in profits after gold tested the $3,445 resistance zone.
📉 Technical Analysis:
Key Resistance: $3,445 – $3,460
Nearest Support: $3,394 – $3,380
EMA 09: Price has dropped below the 09 EMA, signaling a potential short-term bearish shift.
RSI/Candles/Momentum: RSI is pulling back from overbought levels. A red candlestick pattern has emerged after a strong rally, suggesting a technical pullback may be forming. Trading volume is starting to decrease.
📌 Outlook:
Gold may correct lower in the short term toward the $3,390–$3,380 support zone if it fails to reclaim the 09 EMA. However, the medium-to-long-term trend remains supported by safe-haven demand and dovish Fed expectations.
💡 Suggested Trading Strategy:
SELL XAU/USD at: $3,440 – $3,445
🎯 TP: $3,420
❌ SL: $3,455
BUY XAU/USD at: $3,390 – $3,395
🎯 TP: $3,410
❌ SL: $3,380
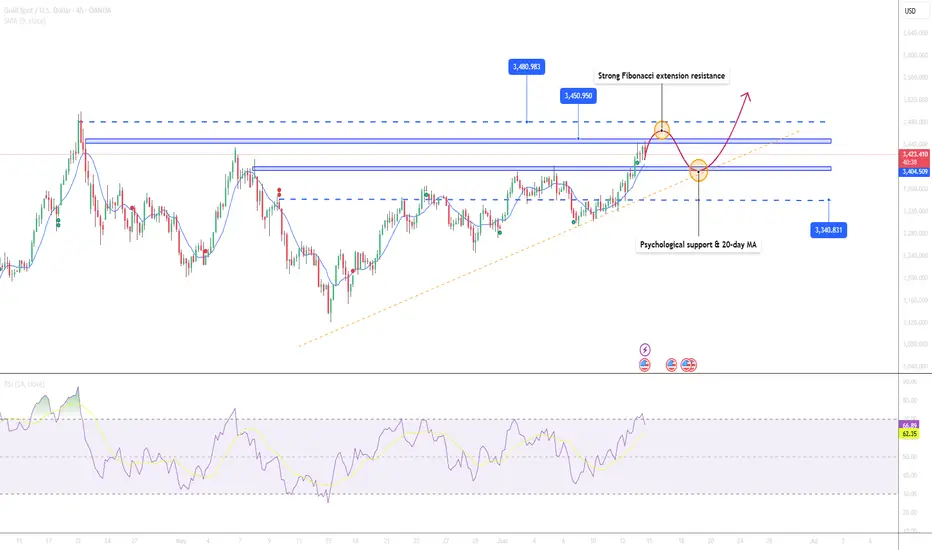
Gold Extends Rally as New High Emerges📊 Market Overview:
Gold reached a new intraday high at $3,447 today, supported by a weaker USD and stable U.S. Treasury yields. Prices then pulled back slightly to $3,423 amid short-term profit-taking. Ongoing geopolitical uncertainty and expectations that the Fed may hold or cut rates continue to drive demand for safe-haven assets like gold.
📉 Technical Analysis:
Key Resistance Levels:
• $3,447 – Intraday high on June 13
• $3,465 – Strong Fibonacci extension resistance
• $3,480 – Next upside target if price breaks above $3,447
Key Support Levels:
• $3,423 – Current price and intraday congestion zone
• $3,410 – Minor support on the H4 chart
• $3,400 – Psychological support & 20-day MA
• EMA: Price is trading above the 09-day EMA → short-term trend remains bullish
• Candlestick / Volume / Momentum:
Strong bullish candle with high volume; RSI at 67 indicates further upside potential. Short lower wicks suggest limited selling pressure. MACD on both H4 and daily charts favors continued upside momentum.
📌 Outlook:
Gold is likely to continue rising if it holds the $3,410–$3,423 support zone. A break above $3,447 may open the path toward $3,480 or higher.
💡 Suggested Trading Strategy:
🔺 BUY XAU/USD:
• Entry: $3,420 – $3,425
• 🎯 TP: $3,480
• ❌ SL: $3,408
🔻 SELL XAU/USD
• Entry: $3,445 – $3,450
• 🎯 TP: $3,423 – $3,410
• ❌ SL: $3,457
After the Pullback, Gold May Head Toward the 3500 Mark📊 Market Overview:
Gold surged to 3444 during the Asian session on rising expectations of an early Fed rate cut after softer-than-expected US CPI data. However, profit-taking pushed prices back to the 3425 zone.
📉 Technical Analysis:
• Key Resistance: 3444
• Nearest Support: 3403 – 3406
• EMA 9: Price remains above EMA 9 → trend is still bullish.
• Momentum & RSI: RSI has cooled off from near-overbought territory (~70), suggesting a short-term pullback may occur.
📌 Outlook:
Gold may correct slightly toward support before resuming its upward trend if the 3403–3406 zone holds firm.
💡 Suggested Trading Strategy:
🔻 SELL XAU/USD at: 3440 – 3444
🎯 TP: 3420
❌ SL: 3449
🔺 BUY XAU/USD at: 3406 – 3403
🎯 TP: 3426
❌ SL: 3399
Gold May See Minor Pullback After Testing $3400📊 Market Development:
Gold surged to approach the $3,400 mark after U.S. Unemployment Claims came in higher than expected. The weak labor data increased speculation of an earlier rate cut by the Fed, pressuring the USD and bond yields, which in turn supported gold prices.
📉 Technical Analysis:
• Key Resistance: $3,400
• Nearest Support: $3,365
• EMA: Price remains above EMA 09 → bullish bias intact
• Candle/Volume/Momentum: Long upper wick on H1 suggests profit-taking near $3,400; declining volume may signal weakening momentum.
📌 Outlook:
Gold may experience a short-term pullback if it fails to break above $3,400 and the USD strengthens in the New York session.
💡 Suggested Trade Setup:
🔻 SELL XAU/USD at: $3,395–$3,400
🎯 TP: $3,375
❌ SL: $3,406
🔺 BUY XAU/USD at: $3,365–$3,370
🎯 TP: $3,390
❌ SL: $3,355
Gold fluctuates repeatedly and opportunities emerge.Gold bottomed out in the Asian session and rebounded to break through the opening of the decline. The European session continued to break through yesterday's high. The US session continued to break through the key pressure position of 3335-3345, and walked out of the standard strong cycle. After the break, it is necessary to change the thinking and follow the trend to be bullish. Pay attention to the support below 3315-3325. In terms of operation, it is mainly long when it falls back. The upper side gradually looks to 3352 and 3365. If the pressure is not broken, look at the falling space!
Operation suggestion: Go long when gold falls back to 3325-3315, and look at 3338 and 3352! If the pressure above 3352 and 3365 is not broken, you can short!
The recent trading strategy ideas are all realized, and all the points are predicted accurately. If your current gold operation is not ideal, I hope I can help you avoid detours in your investment. Welcome to communicate with us!

Gold May See Short-Term Correction As US-China Talks Loom💡 Suggested Trading Strategies
SELL XAU/USD at: $3,320 – $3,326
🎯 TP: $3,300
❌ SL: $3,330
BUY XAU/USD at: $3,296 – $3,300
🎯 TP: $3,320
❌ SL: $3,290
📊 Market Summary
Gold prices have been volatile recently due to high-level trade negotiations between the US and China. Investors are cautious as a potential breakthrough could ease tensions and reduce safe-haven demand for gold.
📌 Outlook
Gold may decline slightly toward the $3,296–$3,300 range if no breakthrough is achieved in US-China talks. However, a positive outcome could trigger a rebound toward the $3,326–$3,340 zone.
Can Gold Reach $3400 This Week?📊 Market Overview:
On June 4, 2025, gold prices (XAU/USD) hovered around $3,370/oz after rebounding from the $3,333 level. However, selling pressure emerged as prices approached the strong resistance zone near $3,392–$3,400. Ongoing uncertainties regarding U.S.–China trade policies and expectations of a Federal Reserve rate cut continue to support safe-haven demand for gold.
📉 Technical Analysis:
• Key Resistance: $3,392 – $3,400
• Nearest Support: $3,333 – $3,320
• EMA 09: Price is currently above the 09 EMA, indicating a short-term uptrend.
• Candlestick Patterns / Volume / Momentum: The RSI on the H1 timeframe is at 59, suggesting bullish momentum remains but is approaching overbought territory.
📌 Outlook:
Gold may experience a short-term pullback if it fails to break above the $3,400 resistance level and profit-taking intensifies.
💡 Suggested Trading Strategy:
SELL XAU/USD at: $3,392 – $3,400
o 🎯 TP: $3,372
o ❌ SL: $3,410
BUY XAU/USD at: $3,320 – $3,333
o 🎯 TP: $3,352
o ❌ SL: $3,310
Gold Continues to Rise as USD Weakens📊 Market Overview:
Gold prices are rebounding slightly after a pullback from a four-week high. The weakening USD, driven by concerns over US-China trade tensions and upcoming employment data, has bolstered safe-haven demand for gold.
📉 Technical Analysis:
• Key Resistance: $3,365 – $3,377
• Nearest Support: $3,320 – $3,290
• EMA 09: Price is above the 09 EMA, indicating a short-term uptrend.
• RSI: The RSI on the H4 timeframe is at 64.06, suggesting bullish momentum with room before reaching overbought territory
📌 Outlook:
Gold may continue its short-term rise if the USD remains weak and US employment data falls short of expectations.
💡 Suggested Trading Strategy:
SELL XAU/USD at: $3,377
o 🎯 TP: $3,357
o ❌ SL: $3,387
BUY XAU/USD at: $3,290
o 🎯 TP: $3,310
o ❌ SL: $3,280
Gold May Undergo Short-Term Correction Before Continuing Uptrend📊 Market Overview:
Gold prices are currently around $3,307/oz, up 0.5% on June 2, supported by safe-haven demand amid escalating geopolitical tensions and trade concerns. However, after reaching a peak of $3,500 in April, gold has corrected as market sentiment shifted towards riskier assets due to easing US-China trade tensions.
📉 Technical Analysis:
• Key Resistance: $3,325 – $3,350
• Nearest Support: $3,280 – $3,265
• EMA: Price is above EMA 09 → uptrend.
• Candlestick Patterns / Volume / Momentum: Gold is in a consolidation phase with a slight upward bias. Technical indicators like RSI(14) at 56.183 and MACD(12,26) signaling buy suggest continued upward momentum.
📌 Outlook:
Gold may experience a short-term correction if it fails to hold the $3,280 support level. However, the long-term trend remains positive if the price stays above EMA 09 and does not break key support.
💡 Suggested Trading Strategy:
SELL XAU/USD at: $3,325 – $3,330
🎯 TP: $3,305
❌ SL: $3,335
BUY XAU/USD at: $3,280
🎯 TP: $3,300
❌ SL: $3,270

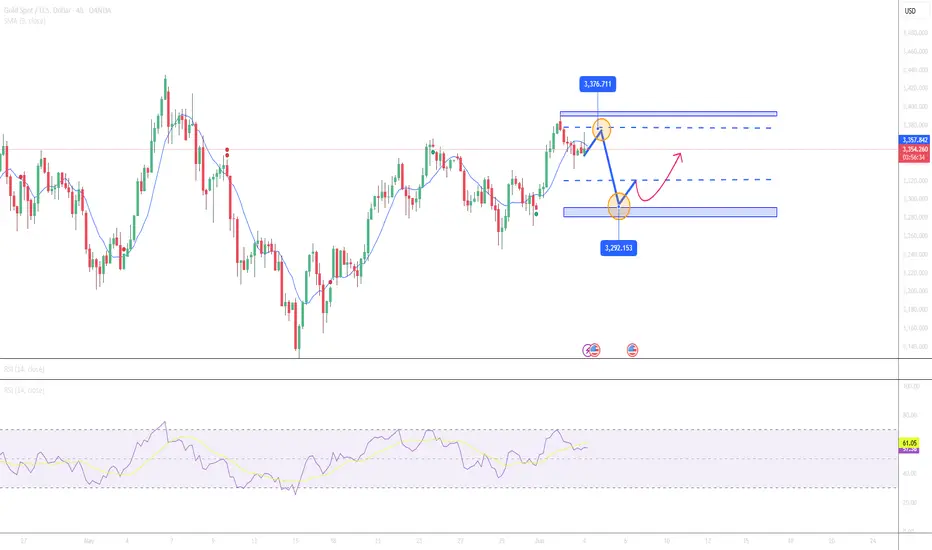
XAUUSD Rejection from Fib + OB Combo | Bearish Continuation?XAUUSD | Premium Smart Money Short Setup 🎯
This GOLD setup is a straight-up institutional-grade bearish continuation. Let’s break down why this is a high-probability short for Smart Money Traders.
🔍 1. Market Context
Price is trending inside a clear descending channel, tapping into the lower boundary and now pulling back.
We just had a reaction from the mid-supply zone, and price is now rebalancing into the Order Block (OB) aligned with:
🔻 79% Fibonacci Retracement
🔻 Previous Structure Break
🔻 OB + imbalance fill zone
🧱 2. Bearish Confluences
📉 Descending Channel = bearish structure
🟣 Order Block Zone = high-value area for institutional entries
📐 Fibonacci Levels = 61.8%, 70.5%, and 79% all stacked
💥 OB + 79% = high-prob sniper short
🕳 Imbalance + Liquidity Sweep = likely short continuation
🎯 3. Trade Idea
Entry: 3282.00–3290.00 (OB + 79% Fib)
Stop Loss: 3294.00 (above OB wick)
Take Profit: 3245.00 zone (channel bottom)
Perfect RR setup 👇
⚖️ 4. RRR (Risk-Reward Ratio)
💰 Entry: ~3285
🔒 SL: ~3294
📍 TP: ~3245
✅ RRR ≈ 1:4.3 = sniper level swing short 🎯
🧠 5. Smart Money Logic
Liquidity Sweep above minor high before short = engineered trap
OB reaction at fib premium zone = smart entry
Continuation expected unless price closes above 3295
📌 Save this chart — this is Smart Money flow in action
💬 Drop “Gold OB SMC 🔥” in comments if you saw this coming
🔁 Repost to help fellow traders master fib+OB sniper entries
