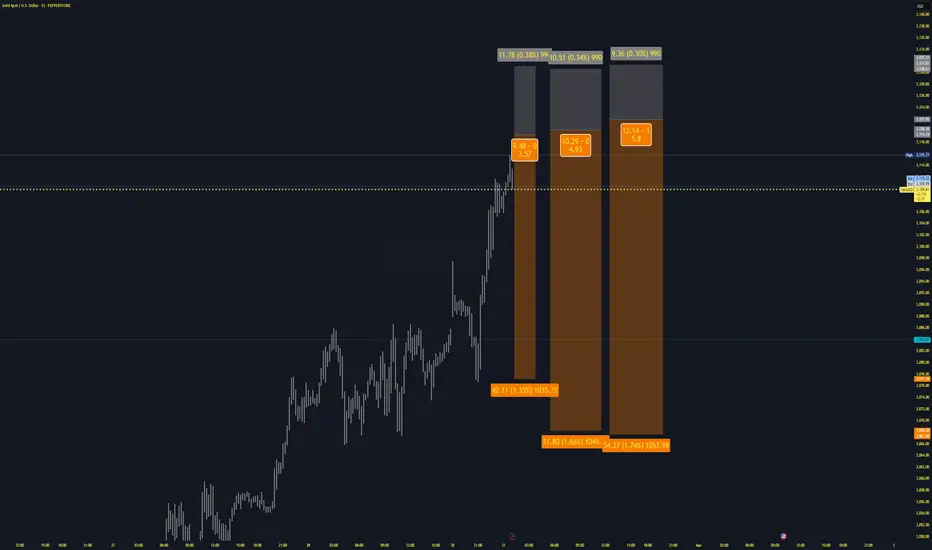
Gold trading zones: 10-APRIL-2025Good morning dear traders: Explore today's Gold trading zones and enhance your market knowledge.
Goldshort

Gold trading zones: 09-APRIL-2025Hey traders! Check out today's Gold trading zones and let's discuss potential opportunities.

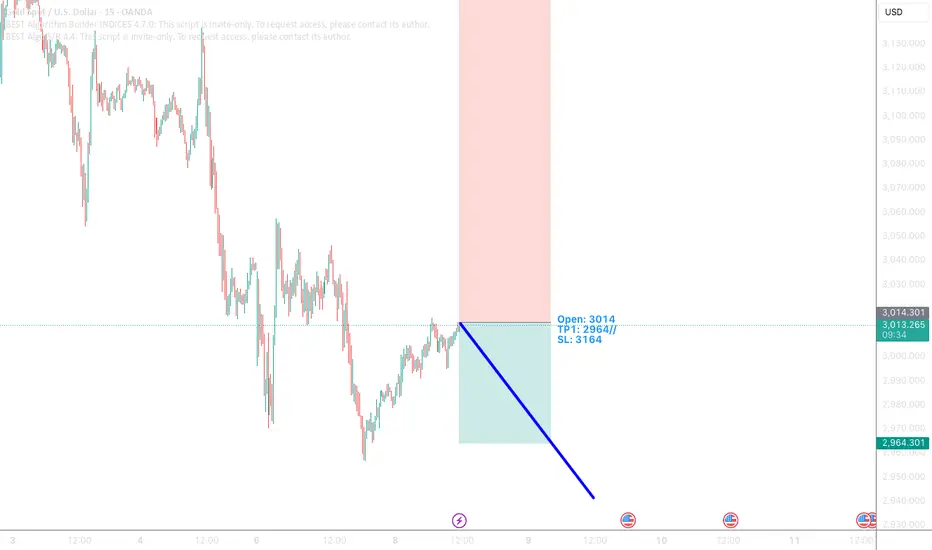
XAUUSD ShortWhat a Monday that was! Price broke way below 3000 and even hit 2954 level. It was a little shaky so I opt to not put in my positions, even if my predictions were correct, I chose to play safe. Today, price is still a little unstable but placing a position so to catch some pips if ever. Iv placed an SL just for Tradingview purposes, here's my position info: Open at 3014// SL 3164//TP 2964. As usual we decide as we go, but let's see how this trade rolls :)
Day 19of100
L:5
W:4
Gold trading zones: 08-APRIL-2025Today’s Gold trading zones: For educational purposes only, use at your own risk.

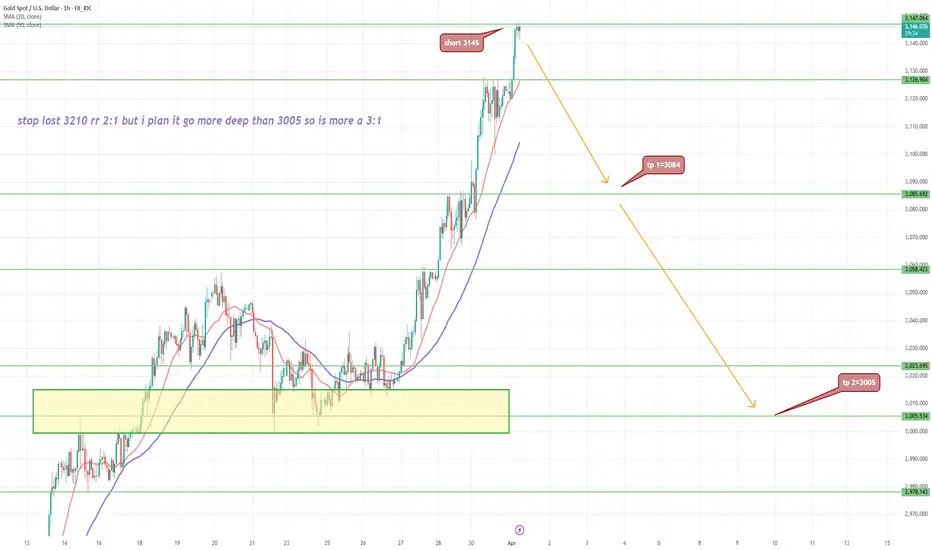
short 3145 with 2tp legit 3005 after trump tlk abou tarifffor me its clear here.
its a classic buy the rumour sell the news
so when Trump will talk about tariff psssssss it will back down a lot
also it go far up so fast and a legit good correction is welcome
also high price made many as electronic and other goods ewpansive
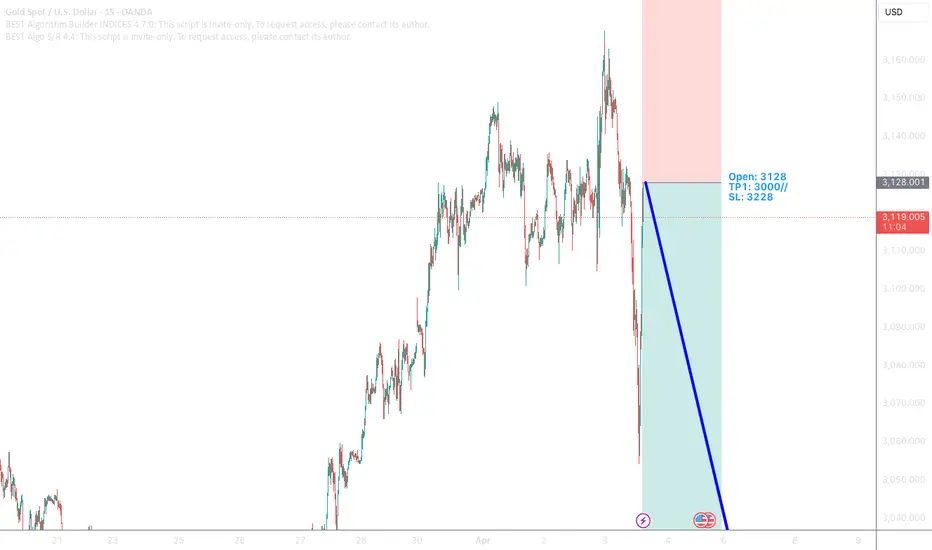
XAUUSD SELLXAUUSD short again. Caught another opportunity to sell !!Setting my position at 3135 // TP 3000 SL 3235. Let's see how this trade rolls :)
Day 17of100
L:5
W:3

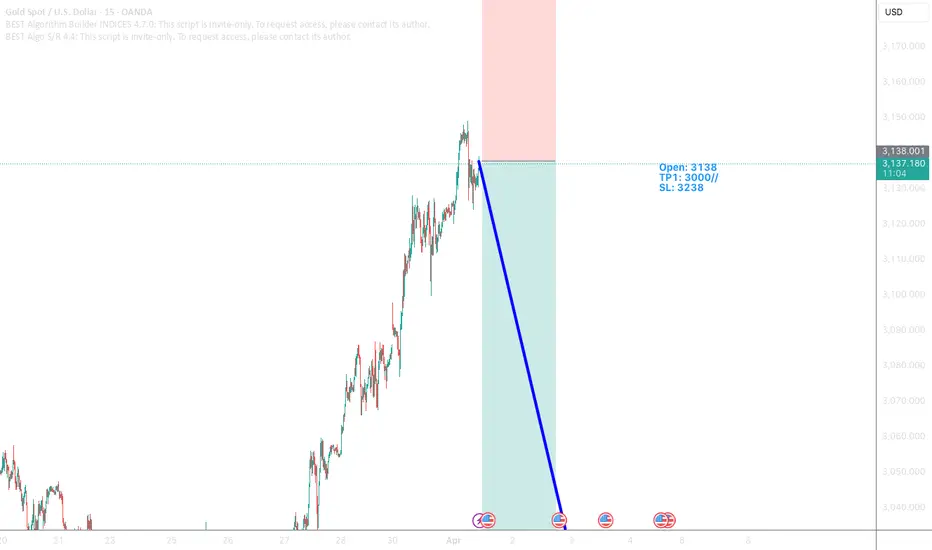
XAUUSD ShortXAUUSD short again. With the previous drop and increase, I guess it's still safe to hold on to sell positions. Setting my position at 3138 // TP 3000 SL 3238. Let's see how this trade rolls :)
Day 16of100
L:5
W:2
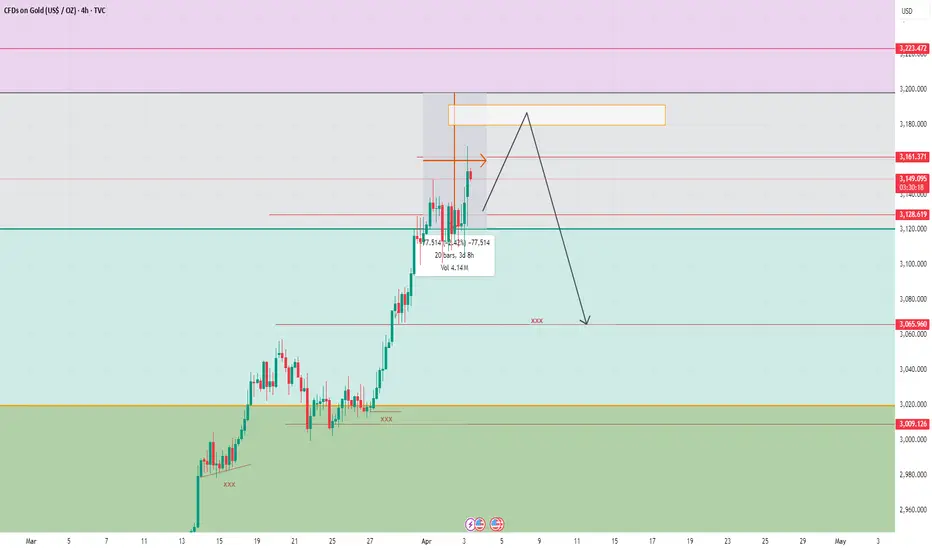
GOLD/XAUUSD SWING UPDATESHello folks, Gold are on a trend right now. Waiting for this zone for shorts? 3180 might be the high or 3200.
The Initial targets at 3066 zone.
This idea base on my previous idea on fibonacci, Full updates once price goes 3066 zone.
Idea on the new highs maybe later on High impact news.
The idea here is short.
Trade at your own risk.
Follow for more.
I will update once this zones mitigated. Good luck! pewwpeww
Gold trading insights: 04-APRIL-2025Gold trading insights: Not signals, but informative zones to aid your decision-making. Please note: These zones are not trading advice. Use them as a starting point for your own analysis.

XAUUSD SHORTXAUUSD short again, 9yr high for Gold and still holding on to my shorts. another day, another entry. Setting my position at 3138 // TP 3000 SL 3238
A lil discouraged with the current rallies, however, this is what trading is like, you take your L's, gather your emotion, recalculate and execute again(when you're less emotional). Sticking to my Short positions because I believe that this will reverse, it may take a while but im willing to wait. Setting my TP to my previous target to cover previous losses and SL a lil bit further to secure my positions. This isnt a trading or financial advice but my personal trading plan. Let's see how this trade rolls.
Day 14of100
L:5
W:1
Gold trading zones: 03-APRIL-2025Today's Gold trading zones: For educational purposes only. Use at your own risk.

GOLD Technical Analysis - Correction Incoming?OANDA:XAUUSD is trading within a well-defined ascending channel, with price action now testing the upper boundary. This level could act as dynamic resistance, and a rejection here could trigger a corrective move toward the 3,035 support zone.
If buyers defend this support, the bullish structure remains intact, with a potential move back toward higher levels. However, if price breaks below this zone, a deeper pullback toward the lower boundary of the channel could come into play.
Monitoring candlestick patterns and volume at this critical zone is essential for identifying buying opportunities. Proper risk management is advised, always confirm your setups and trade with solid risk management.
If you have any thoughts on this setup or additional insights, drop them in the comments!

GOLD - on resistance- Could Bitcoin resume its Gains Over GoldAs you can see, GOLD has come to a point where it has been rejected twice previously.
And on each of the previous occasions, PA ended up back on the lower trend line., taking around 2 years to do so on each occasions
GOLD MOVES SO SLOW - mostly due to its HUGE market cap..... But thats another story
Has the recent rise of Gold come to a line of defeat ?
The Daily chart here shows how PA is stalling at this moment in time
Each push is getting Shorter. PA is tired.
PA is Getting OVERBOUGHT on many time frames. It needs a break
The thing is, Mr Trump will later today introduce the "liberation Tariffs"
The expectation is of FEAR as reprisals and reduced markets could cause issues in the USA , including reversing the Drop in inflation.
If the Tariffs backfire, the $ will Drop..and people will look to safe haves
Traditionally GOLD. Maybe Gold can break through its old nemesis of rejection.
But PA Is TIRED
BITCOIN has been under pressure recently, following posting a new ATH and this has taken a toll on the BTC XAUT trading pair while Gold has risen.
We can see how PA dropped and has in fact, fallen below the lower line of support.
But it needs to be understood is that RSI and MACD are now in very positive positions to make a push higher.
Gold is tired
In the Near Future, we may well see the tables turn in Bitcoins Favour again
But Me Trumps, today, May actually upset that idea.
We just have to wait and see how sentiment is towards Risk assets later today , after the announcement of these Tariffs.
But, in the Longer term, once the dust settles, I do see Bitcoin taking over again and continuing its rise to greatness.....
ENJOY
Time Will tell
Gold trading zones: 02-APRIL-2025Discover today's Gold trading zones and refine your market analysis skills.

XAUUS SHORTStubborn XAUUSD, played with my TP1 a few times, almost hitting it but never really reached and instead it went the other way and touched my SL. However Im still on a strong sell in this. Opening at 3078 and still maintaining my previous TP 3005 because I know that's the direction that it will head to, if this reaches, it will cover 3days loss, and setting my SL on a much further rate. Personally, I dont use SL's but for Tradingview Im opting to put one as a good practice
Day12of100
L:4
W:1
Such a shame that my L days are way more than my W's but still believing in my trade and I know this will pick up. let's see how this new trade rolls. XAUUSD is already in it's all time high, so I believe soon enough my much awaited correction will happen, Il be patient :)
Happy New Month: -1-APRIL-2025Good morning Traders! Happy New Month! Improve your trading strategy with our Gold zones. Understand market dynamics and make informed decisions.

GOLD XAUUSD ShortI m short. Gold can go even to 3100.No matter I sell more
Wall Street goes full bull with tariffs and payrolls looming
Gold surges toward $3,100 amid unrelenting rally
Smart money knows one thing very clearly: a large part of the bad news is already baked into the prices, and there is limited room for further downside. Especially considering the parabolic moves we’ve seen
Never the less we are in overbought zone,A correction coming.That will be good chance to buy Gold again
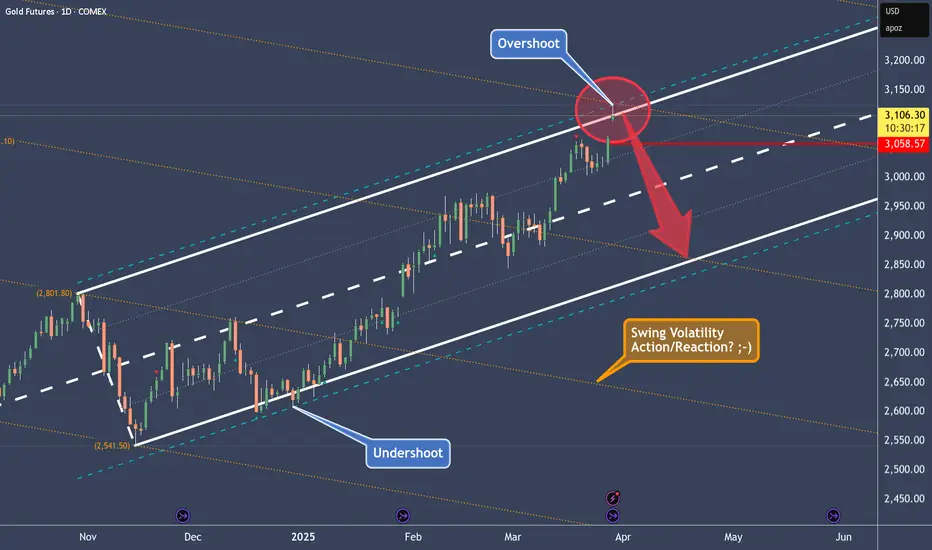
A Gold'en Newtonian Sell-Off Porjected By MedianlinesSir Isaac Newton stated the Third Law of Motion in his landmark work, Philosophiæ Naturalis Principia Mathematica (commonly called the Principia), which was first published in 1687. This law appears in Book I, in the section titled Axioms, or Laws of Motion.
(Axiom: A self-evident truth)
Newton did explicitly present it as an axiom. In fact, it's Axiom III (or Law III) of his three fundamental laws of motion. Here's how he phrased it in the original Latin and in his own English translation:
"To every action there is always opposed an equal reaction: or the mutual actions of two bodies upon each other are always equal, and directed to contrary parts."
And what does this have to do with Medianlines / pitchforks?
This tool measures exactly that: the action — and the potential reaction!
Medianline traders know that pitchforks project the most probable direction that a market will follow. And that direction is based on the previous action, which triggered a reaction and thus initiated the path the market has taken so far.
…a little reciprocal, isn’t it? ;-)
So how does this fit into the chart?
The white pitchfork shows the most probable direction. It also outlines the extreme zones — the upper and lower median lines — and in the middle, the centerline, the equilibrium.
We see an “undershoot,” meaning a slightly exaggerated sell-off in relation to the lower extreme (the lower median line). And now, as of today, we’re seeing this overreaction mirrored exactly at the upper median line!
Question:
What happened after the lower “overshoot”?
New Question:
What do you think will happen now, after the market has overshot the upper median line?
100% guaranteed?
Nope!
But the probability is extremely high!
And that’s all we have when it comes to “predicting” in trading — probabilities.
Why? Because we can’t see the future, can we?
Gold?
Short!
Looking forward to constructive comments and input from you all
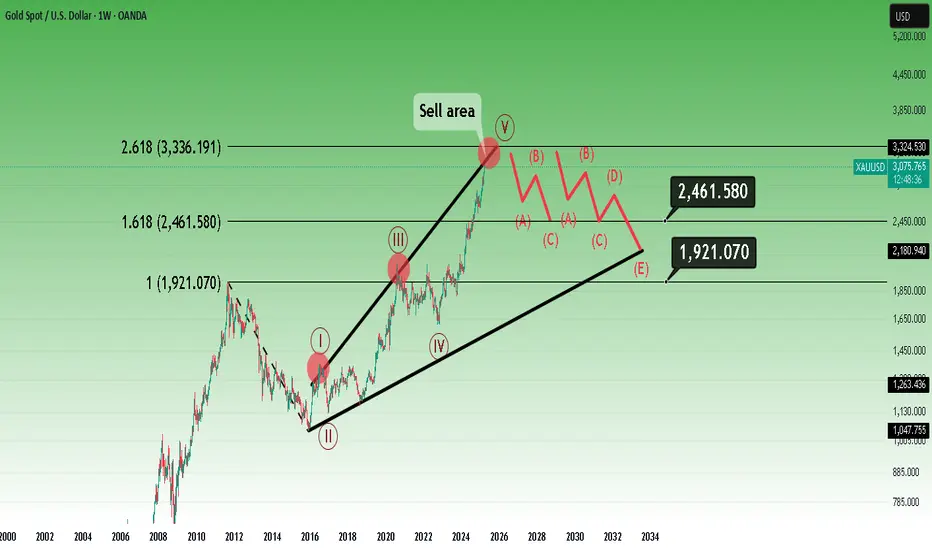
Summer is almost over for gold, winter is coming.To me it's a clear 5-way Elliot cycle.
And as I always say, trends usually target the Fibonacci range between 1.618 and 2.618.
I would never push for more, would be an unnecessary risk.
* What i share here is not an investment advice. Please do your own research before investing in any asset.
* Never take my personal opinions as investment advice, you may lose all your money.
Gold trading zones: 28-MAR-2025Today’s Gold trading zones: For educational purposes only, use at your own risk.

GOLD XAU Short at All Time High! Silver.too!It seems that Trump taming some market investors,Gold is falling because of lower risk of tariffs on April 2nd 2025
More entry profit target details :Take a look at the chart

Gold trading insights: 26-MAR-2025Gold trading insights: Not signals, but informative zones to aid your decision-making. Please note: These zones are not trading advice. Use them as a starting point for your own analysis.

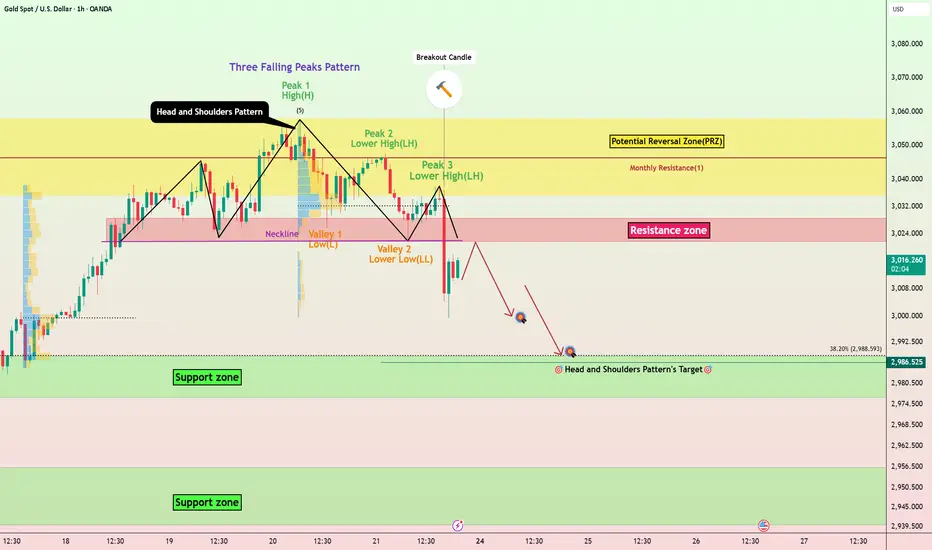
Gold’s Bearish Setup – What’s Next for $XAUUSD?Gold ( OANDA:XAUUSD ) fell to $3,003 as I expected in my previous post . Of course, since this is a round number , we can expect good support .
In terms of Classic Technical Analysis , Gold appears to have succeeded in breaking the neckline of the two patterns , the Head and Shoulders Pattern and the Three Falling Peaks Pattern .
Educational Note : The Three Falling Peaks is a bearish reversal pattern that occurs after an uptrend, where the price forms three consecutive lower peaks. Each peak represents a failed attempt to continue the uptrend, signaling weakening bullish momentum. A breakdown below the support confirms the pattern and signals a potential downtrend.
In terms of Elliott Wave theory , it seems that Gold has completed 5 impulsive waves and we should wait for corrective waves .
I expect Gold to attack the $3,000 at least once more after completing the pullback , and the next target could be the Support zone($2,989-$2,976) .
Note: If Gold goes above $3,039, we should expect more pumps.
Gold Analyze ( XAUUSD ), 1-hour time frame.
Be sure to follow the updated ideas.
Do not forget to put a Stop loss for your positions (For every position you want to open).
Please follow your strategy; this is just my idea, and I will gladly see your ideas in this post.
Please do not forget the ✅' like '✅ button 🙏😊 & Share it with your friends; thanks, and Trade safe.