XAUUSD | GOLDSPOT | New perspective | follow-up detailsWelcome back to another exciting episode of our weekly XAUUSD technical analysis! 📈 In the ever-evolving world of forex trading, gold seems to be holding its ground around the crucial $1,900 mark. 🔒 The recent surge in the U.S. Consumer Price Index (CPI) has sparked inflation concerns, making investors wonder about the Fed's next move. 📊
This week, we'll explore how gold managed to stand strong despite the CPI surprises and the European Central Bank's (ECB) bold rate hike decision. 🌍💰 The upcoming Federal Reserve meeting on September 20th is generating curiosity about Chairman Jerome Powell's remarks and the future path of interest rates. 🏦🤔
XAUUSD Technical Analysis:
In this video, we dissected the XAUUSD chart from a technical standpoint, analyzed the key levels, analyzed historical price moves, market behaviors, and buyer-seller dynamics and uncover potential trading opportunities.
The $1,925 zone will take center stage for this week. Its historical significance makes it a crucial point. If the bullish momentum is sustained then the breakout of the uptrend continuation pattern - falling wedge identified on the daily timeframe could incite a strong uptrend continuation. However, if the price breaks below the demazone at the $1,900 then some selling opportunities could take center stage to trigger a USD-favored sell-off.
Stay tuned for more thrilling updates on the Gold market! Remember, trading involves risks, and I always recommend exercising caution and seeking advice from financial professionals. Hit the like button if you found this analysis helpful, and don't forget to subscribe for more insightful content! 📺🔔💼
Disclaimer Notice:
Please be aware that margin trading in the foreign exchange market, including commodity trading, CFDs, stocks, and other instruments, carries a high level of risk and may not be suitable for all investors. The content of this speculative material, including all data, is provided by me for educational purposes only and to assist in making independent investment decisions. All information presented here is for reference purposes only, and I do not assume any responsibility for its accuracy.
It is important that you carefully evaluate your investment experience, financial situation, investment objectives, and risk tolerance level. Before making any investment, it is advisable to consult with your independent financial advisor to assess the suitability of your circumstances.
Please note that I cannot guarantee the accuracy of the information provided, and I am not liable for any loss or damage that may directly or indirectly result from the content or the receipt of any instructions or notifications associated with it.
Remember that past performance is not necessarily indicative of future results. Keep this in mind while considering any investment opportunities.
Goldspot

XAUUSD | GOLDSPOT | New perspective | follow-up detailsGold's recent performance faced an unexpected twist, challenging the notion that a Fed rate pause could be its ticket to a breakout. Instead, the precious metal found itself in the shadow of its formidable rival, the US dollar.
The preceding week had seen gold bask in the glory of the US non-farm payrolls report for August. Despite an employment gain of 187,000 jobs, surpassing the forecasted 170,000, the unemployment rate inched up from July's 3.5% to 3.8%. This unexpected rise fueled speculation that the upcoming Fed meeting on Sept. 20 might result in unchanged interest rates, briefly propelling gold higher.
However, as the week unfolded, a new narrative emerged. Speculation resurfaced, suggesting that the Fed might consider not just a pause but potentially more rate hikes before year-end to achieve its 2% annual inflation target. Inflation, as measured by the Consumer Price Index (CPI), rekindled in July, surging to 3.2%. These mounting concerns prompted the Dollar Index to soar to six-month highs.
Now, the burning question is: What lies ahead for the Gold market in the coming week? Join us as we unravel the intricacies and potential scenarios in this ever-evolving landscape.
XAUUSD Technical Analysis:
In this video, we delve into XAUUSD from a price action-based technical analysis standpoint. By analyzing historical price moves, market behaviors, and buyer-seller dynamics, we extract insightful cues.
The $1,915 zone will take center stage for this week. Its historical significance makes it a crucial point. If the bullish momentum is sustained then the breakout of the uptrend continuation pattern - falling wedge identified on the daily timeframe could incite a strong uptrend continuation. However, if the price breaks below both the ascending trendline and the $1,915 zone then some selling opportunities could take center stage to trigger a USD-favored sell-off.
Stay tuned for more thrilling updates on the Gold market! Remember, trading involves risks, and I always recommend exercising caution and seeking advice from financial professionals. Hit the like button if you found this analysis helpful, and don't forget to subscribe for more insightful content! 📺🔔💼
Disclaimer Notice:
Please be aware that margin trading in the foreign exchange market, including commodity trading, CFDs, stocks, and other instruments, carries a high level of risk and may not be suitable for all investors. The content of this speculative material, including all data, is provided by me for educational purposes only and to assist in making independent investment decisions. All information presented here is for reference purposes only, and I do not assume any responsibility for its accuracy.
It is important that you carefully evaluate your investment experience, financial situation, investment objectives, and risk tolerance level. Before making any investment, it is advisable to consult with your independent financial advisor to assess the suitability of your circumstances.
Please note that I cannot guarantee the accuracy of the information provided, and I am not liable for any loss or damage that may directly or indirectly result from the content or the receipt of any instructions or notifications associated with it.
Remember that past performance is not necessarily indicative of future results. Keep this in mind while considering any investment opportunities.

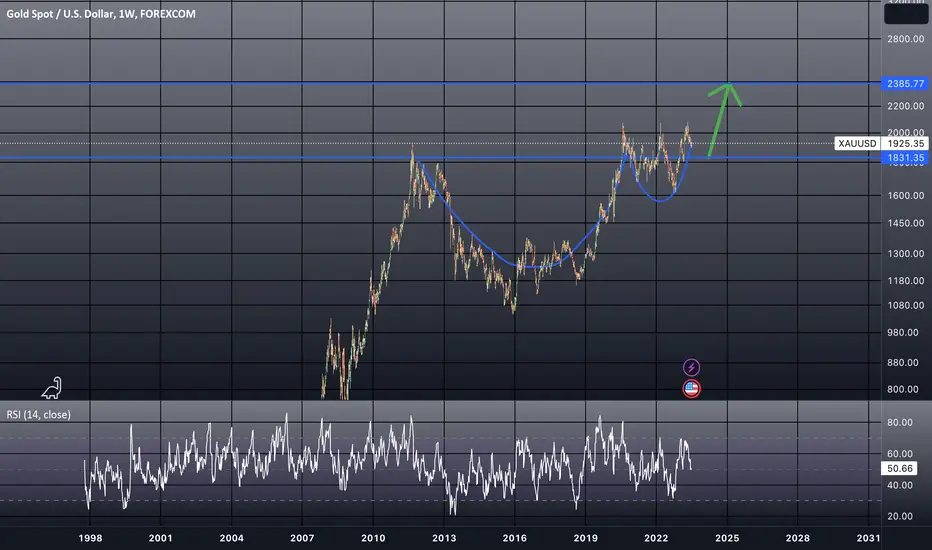
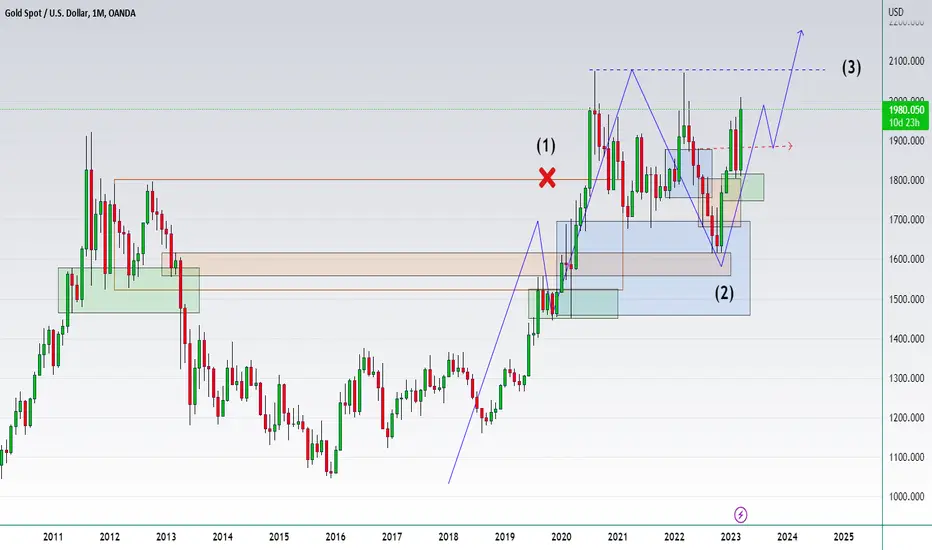
Gold may correct towards $1500 an ounce towards the end of 2024.A rise from the November 2015 level of $1050 per ounce in Gold Spot may have ended at $ $2080 per ounce in May 2023.
Over the next year and a half, a correction to $1500 per ounce is possible. Gold may rocket higher in wave 3 after bottoming near $1500 per ounce by the end of 2024.

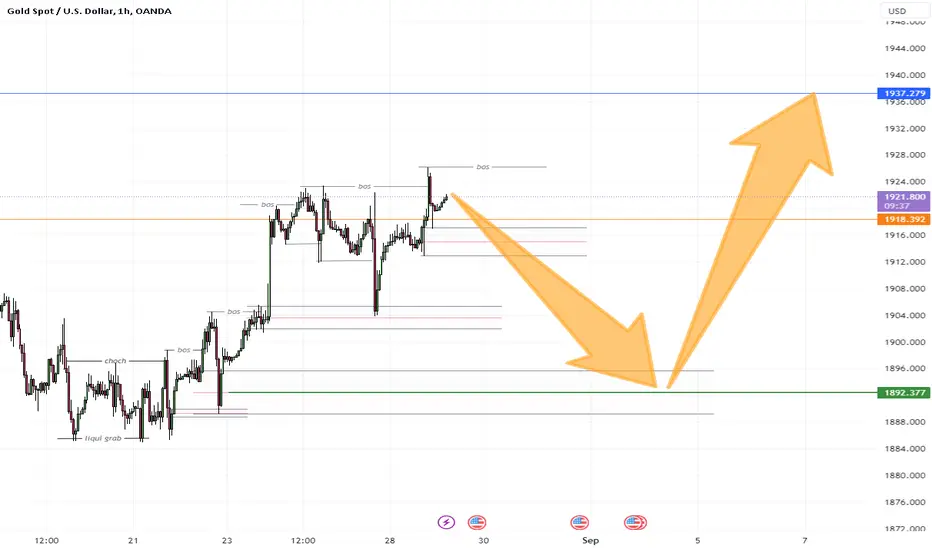
XAUUSD plan | 29/08/2023Hello 500 Bros!
The structure of XAUUSD is showing bullish signal again ( H1, H4 time frame).
In the near term, I predict that XAU price could return to the 189x zone before a strong rally afterwards.
Happy trading and thank you!
GOLD long at 1800+ upto 2400Gold is creating a cup and handle pattern, the current triple top will go up to 2400 in the next 2 years. 1800+ will be an excellent place to accumulate.
Xauusd Bias Update: Short Looking at the chart above, you will see that the price is making a short pullback to the key level area. But I bet with you that this is the best time to shorten it by going down to the lower timeframe like H1 or m15. The price is still within the range of the pin bar candlestick. If you short this market, then the best area to place your stop is above the resistance line.
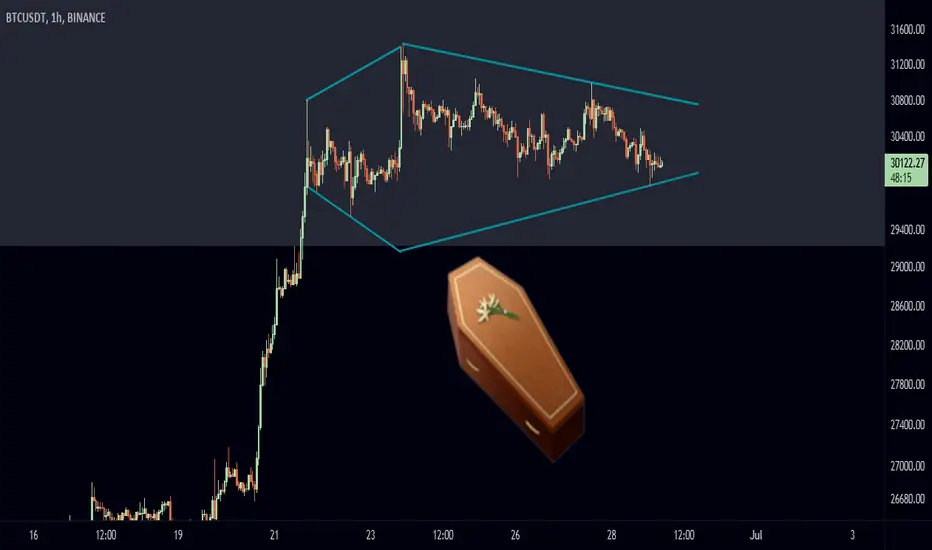
BTC/USDT 1H: Coffin waiting for buyers!In the 1H time frame, we see the formation of a coffin pattern
For the farewell ceremony with buyers who enter buy positions in resistance areas, please wear formal clothes
thank you so much
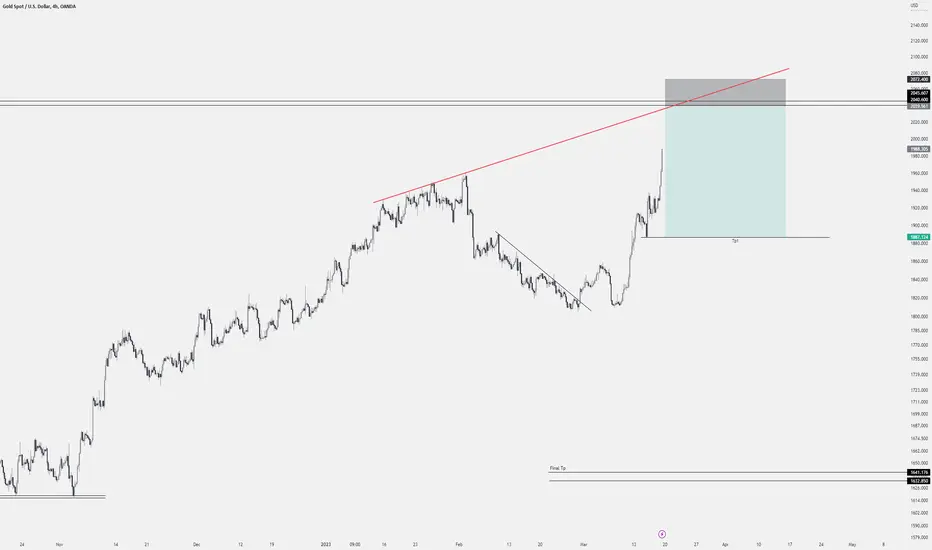
XAUUSD | GOLDSPOT | New perspective | follow-up detailsJoin us as we delve into a comprehensive price action analysis of the XAUUSD market in this video. With the gold price comfortably surpassing the $1,950.00 mark and the USD Index remaining weak, we examine the current market conditions.
Investors are divided on whether the Fed will implement two more rate hikes this year, putting pressure on the USD Index. Encouraging signs of cooling inflation contribute to the hopeful sentiment. While the Fed maintained steady interest rates in its recent meeting, it has left room for potential rate increases later in the year, depending on forthcoming data. However, Morgan Stanley holds a different perspective, projecting no further hikes and expecting the Fed to maintain a rate of 5.1% until a 25 bps cut in March 2024.
Amidst this dilemma, the market mood is cheerful as uncertainty surrounding the interest rate peak subsides after Fed Chair Jerome Powell's presentation of the dot plot. Now, let's discuss our plans for the upcoming week based on price action analysis.
In this video, we conduct a comprehensive examination of the XAUUSD market, assessing both bullish and bearish sentiments, as well as accumulation and distribution patterns. By analyzing past price patterns, market behavior, recurring trends, and crucial support and resistance levels, we gain valuable insights into the potential actions of buyers and sellers in the coming week(s).
It is worth nothing that we identify a significant level at 1,960, which is expected to play a major role in determining the direction of price action this week. Despite this zone being a strong selling area in recent weeks, the market's indecisiveness becomes evident, reflecting the uncertainty among market participants. The reactions observed on Monday within this zone will provide valuable indicators atleast for the first half of the week. Stay prepared to seize the opportunities that lie ahead! Don't forget to stay tuned for updates that will guide our trading decisions throughout the week.
Disclaimer Notice:
Please be aware that margin trading in the foreign exchange market, including commodity trading, CFDs, stocks, and other instruments, carries a high level of risk and may not be suitable for all investors. The content of this speculative material, including all data, is provided by me for educational purposes only and to assist in making independent investment decisions. All information presented here is for reference purposes only, and I do not assume any responsibility for its accuracy.
It is important that you carefully evaluate your investment experience, financial situation, investment objectives, and risk tolerance level. Before making any investment, it is advisable to consult with your independent financial advisor to assess the suitability of your circumstances.
Please note that I cannot guarantee the accuracy of the information provided, and I am not liable for any loss or damage that may directly or indirectly result from the content or the receipt of any instructions or notifications associated with it.
Remember that past performance is not necessarily indicative of future results. Keep this in mind while considering any investment opportunities.

XAUUSD: Forming a medium term Channel Down.Gold turned neutral again on its 1D technicals (RSI = 48.178, MACD = -10.040, ADX = 34.352) after the strong rebound at 1,924.70. This pushed the price back over the 4H MA50, even closed a candle over it but today's LL is a new bottom and technically calls for the emergence of a Channel Down pattern.
This pattern's RSI has a clear Buy and Sell Zone. As long as the top of the Channel Down holds, we will be bearish targeting the LL trendline (TP = 1,915). If it crosses over it, we will take a fast buy and target the 4H MA200 (TP = 1,977), which is unbroken for a full month. Only a cross over the R2 (1,985.50) can reverse the trend to bullish.
## If you like our free content follow our profile to get more daily ideas. ##
## Comments and likes are greatly appreciated. ##

XAUUSD | GOLDSPOT | New perspective | follow-up detailsWelcome to our Goldspot analysis for the week! Despite speculations suggesting otherwise, Gold is far from being dead after the U.S. debt ceiling deal has been finalized. Although futures of the yellow metal experienced a slight decline on Friday, breaking a three-day winning streak, the drop was not enough to erase the gains made in the previous days. As a result, Gold remains in positive territory, instilling hope for continued bullish momentum.
In addition to the U.S. debt ceiling deal, we also explore the impact of the latest U.S. job data on Gold prices. While the data showed stronger-than-expected job numbers, it also revealed a rise in unemployment and a slowdown in wage growth. These mixed signals have led to a divided opinion among economists regarding a potential interest rate hike during the Federal Reserve's upcoming meeting on June 14.
In this video, we delve into a comprehensive analysis of XAUUSD's bullish/bearish sentiment and accumulation/distribution patterns. Through a thorough examination of past price patterns, market behavior, recurring trends, support and resistance levels, and other essential insights, we assess the potential of both sellers and buyers from a technical standpoint. By identifying a key level at 1,955 and recognizing that price action has been confined within a range in recent weeks, we equip ourselves with the necessary knowledge to make informed trading decisions for the upcoming week.
Disclaimer Notice:
Please be aware that margin trading in the foreign exchange market, including commodity trading, CFDs, stocks, and other instruments, carries a high level of risk and may not be suitable for all investors. The content of this speculative material, including all data, is provided by me for educational purposes only and to assist in making independent investment decisions. All information presented here is for reference purposes only, and I do not assume any responsibility for its accuracy.
It is important that you carefully evaluate your investment experience, financial situation, investment objectives, and risk tolerance level. Before making any investment, it is advisable to consult with your independent financial advisor to assess the suitability of your circumstances.
Please note that I cannot guarantee the accuracy of the information provided, and I am not liable for any loss or damage that may directly or indirectly result from the content or the receipt of any instructions or notifications associated with it.
Remember that past performance is not necessarily indicative of future results. Keep this in mind while considering any investment opportunities.

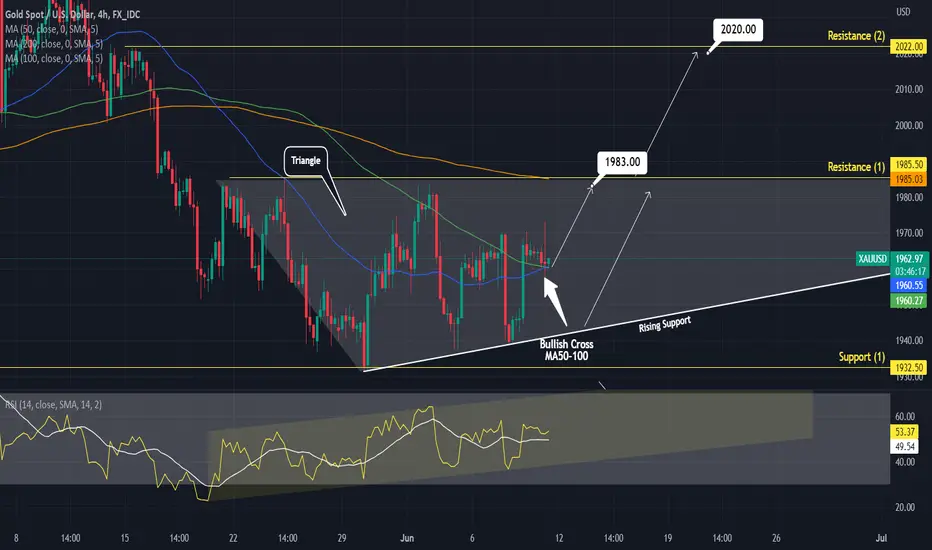
XAUUSD Bullish Cross on 4h targeting Triangle's topGold has just formed a Bullish Cross between the MA50 and MA100 on the (4h) time frame.
Besides this buy signal, the price is holding the MA50 (4h) as Support.
The whole price action is supported by the Rising Support of this medium term Triangle pattern.
Trading Plan:
1. Buy as long as the price is closing over the MA50 (4h).
2. If it breaks, buy near the Rising Support.
Targets:
1. and 2. 1983 (under Resistance 1 and MA200 (4h)).
Tips:
1. The RSI (4h) is trading inside a Channel Up since the price started the Triangle. The price near the Channel's bottom is a buy and near its top is a sell.
Please like, follow and comment!!
Notes:
Past trading plan:
XAUUSD | GOLDSPOT | New perspective | follow-up detailsLast week's U.S. data showed stronger-than-expected consumer spending in April. The increase in personal consumption expenditures (PCE) raised expectations that the Federal Reserve is likely going to hike interest rates again in June. The U.S. debt ceiling proceedings appear to be closing in on an agreement ahead of a June 1 deadline that would raise the government's $31.4 trillion debt ceiling for two years.
Gold Price Forecast: All these economic developments appear to be taking a positive toll on the Greenback as gold was off 2% after another 2% loss the prior week and 0.25% the week before that.
XAUUSD Bullish/Bearish Sentiment: However, from a technical standpoint, the appearance of buying pressure around the 1,940 zone is a concern for Gold sellers as this zone has the potential of becoming a platform for another wave of bullish momentum if not broken to the downside (XAUUSD Accumulation/Distribution Analysis). In the coming week ahead of the US economic features - ADP employment change, ISM manufacturing PMI, and Nonfarm payroll; we might likely see a choppy situation during the first half of the week before a major spike in price movement. In this video (XAUUSD Technical Analysis), we analyzed the current market structure from a technical standpoint by examining past price patterns and market behavior, recurring trends, support and resistance levels, and other crucial insights that can aid us in making a well-informed trading decision ahead of the new week.
Disclaimer:
Margin trading in the foreign exchange market (including commodity trading, CFDs, stocks etc.) has a high risk and is not suitable for all investors. The content of this speculation (including all data) is organized and published by me for the sole purpose of education and assistance in making independent investment decisions. All information herein is for your reference only and I take no responsibility.
You are hereby advised to carefully consider your investment experience, financial situation, investment objective, risk tolerance level, and consult your independent financial adviser as to the suitability of your situation prior to making any investment.
I do not guarantee its accuracy and is not liable for any loss or damage which may result directly or indirectly from such content or the receipt of any instruction or notification therewith.
Past performance is not necessarily indicative of future results.

XAUUSD: Technical pull back after bullish breakout. Buy.Gold made the expected bottom and rebound on the 1D MA100 and crossed over the LH of the May corrective wave. It also broke over the 4H MA50 with technicals turning bullish just before today's pull back that brought them back to neutral (RSI = 44.078, MACD = 2.520, ADX - 28.652). This is a standard technical pull back for Support retesting after a bullish breakout. The price remains inside the High Fluctation Zone of 1,951 - 1,984.65.
The 4H RSI is nearing the bottom of its Channel Up and that is an early buy signal for XAUUSD. If the price bottoms here and forms a Channel Up then we will buy and target its top (TP = 2,000).
Prior idea:
## If you like our free content follow our profile to get more daily ideas. ##
## Comments and likes are greatly appreciated. ##

XAUUSD | New perspective | follow-up detailsAmidst the U.S. debt crisis saga market participants were reluctant to have open sell positions into the weekend, on the off chance that an agreement to raise the U.S. government’s debt ceiling is struck over the weekend hence the engulfing bullish candle observed on Friday. The reluctance of holding short positions resulted in the bullish green light to officially settle Friday’s session at 1,978.78 an ounce (just around the key level at the 1,980 zone), up by 1.1% on Friday. In this video, we dissected the current market structure for trading opportunities both the buyers and sellers have in this market ahead of the new week while taking into consideration the handful of economic features from the U.S. docket.
Disclaimer:
Margin trading in the foreign exchange market (including commodity trading, CFDs, stocks etc.) has a high risk and is not suitable for all investors. The content of this speculation (including all data) is organized and published by me for the sole purpose of education and assistance in making independent investment decisions. All information herein is for your reference only and I take no responsibility.
You are hereby advised to carefully consider your investment experience, financial situation, investment objective, risk tolerance level, and consult your independent financial adviser as to the suitability of your situation prior to making any investment.
I do not guarantee its accuracy and is not liable for any loss or damage which may result directly or indirectly from such content or the receipt of any instruction or notification therewith.
Past performance is not necessarily indicative of future results.

Will I renew my ATH...Hello?
Traders, welcome.
If you "Follow", you can always get new information quickly.
Please also click "Boost".
Have a good day.
-------------------------------------
(XAUUSD chart)
Rising above 1909.525, the long-term trend is positive.
Therefore, a break below 1909.525 is expected to end the long uptrend.
Looking at the 1W chart, we can see that it is moving up along the upper uptrend line within the uptrend channel.
Therefore, a break below 1988.520 is expected to touch the lower uptrend line of the uptrend channel.
(1D chart)
Looking at the 1D chart, we can see that the price is moving up, within several uptrend lines.
Currently, XAUUSD is located near the new high (ATH), so the downside view is more credible than the upside view.
The reason is that the basis of analysis is the movement of the previous chart.
However, the key is whether it can rise above the Fibonacci ratio point of 2081.026.
-------------------------------------------------- -------------------------------------------
** All descriptions are for reference only and do not guarantee profit or loss in investment.
** Even if you know other people's know-how, it takes a considerable period of time to make it your own.
** This is a chart created with my know-how.
---------------------------------

gold sell side from the current loevel for 2 hours.view will last for 2 hours then book sl or take profit

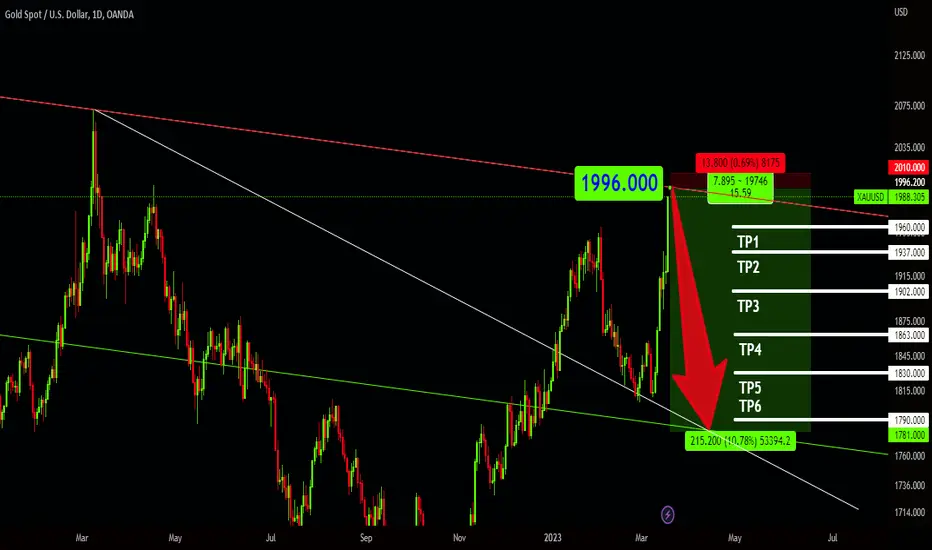
XAUUSD Dump Ahead
I think XAUUSD Dumping from $1996 to 1800~1790
My SL is 2010 and TP shown on chart
Be nice...
Can't believe we have to spell this out, but yes, please treat others how you'd like to be treated yourself. Be respectful, kind, tolerant, and constructive, even when you disagree. There's no room for negativity, swearing, trolling, or conflict here: it's a waste of time and the hallmark of an idiot.
Good Luck
XauusdIn the short term, expect price correction until around 1900. In case of formation of bullish confirmations in the desired area, it is expected to continue to climb up to the price of 2100 dollars in the medium and long term
PRO ANALYSIS ON GOLD !!!The key is in the chart below:
The main structure is bearish on daily TF, so the last pivot has a key reversal zone that has been identified by my own personal advanced strategy.
Keep yourself tuned with my posts to grab these as earlier as possible.
Gold Spot (XAUUSD) Likely To Break Below Support... ($1690)Gold Spot (XAUUSD) is now testing the ~$1850 support level... This level is likely to fail.
Our focus goes to cryptocurrency, Bitcoin but mainly Altcoins...
We are seeing Gold, BTC, and the SPX moving in many similar ways.
Here XAUUSD is testing a support level that is likely to break.
On this correction/drop, we are likely to see $1690 as the final support level before more up...
We have chances of seeing higher prices right away but I don't think this is how things will go.
We will have a very nice/strong correction for a few months and then Gold, Cryptocurrency, Bitcoin, and the Altcoins will again move up strong.
Namaste.

Gold Long SetupeGold in bullish
Previous high break
Bulls ready for attack
Long trade opportunity
* If price break SL before triger, cancel order

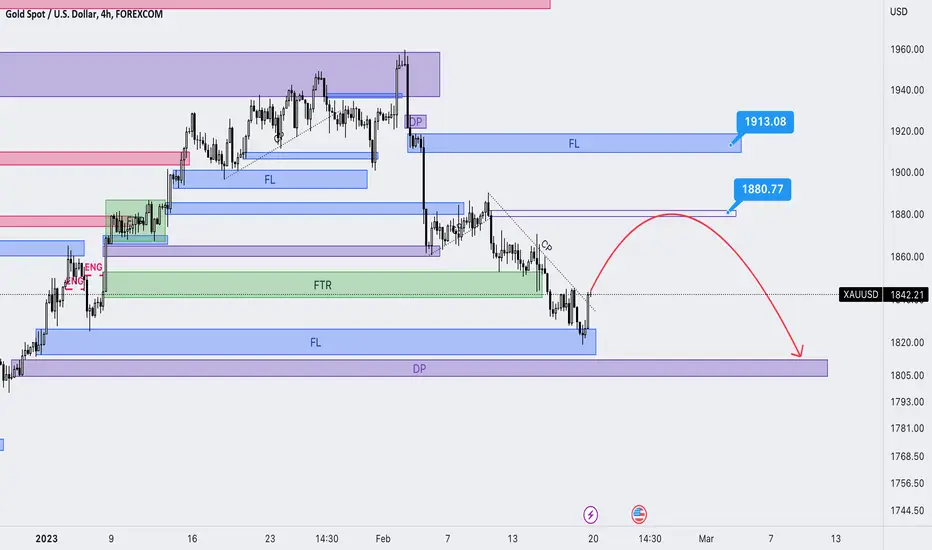
XAU/USD We are reaching the Bullish FTR zone in weekly timeframHi guys
In this post, I will analyze the XAU/USD chart by RTM method in the weekly timeframe. I suggest you learn this method which was developed by If Myante and his friends and is famous for its accuracy and high risk-reward ratio.
If we look carefully at the chart of the Gold, we could see the evident Bullish FTR (failure to return) between the range of 1770 to 1800.
First of all, the price had a resistance surface in 1807 but we can see that this surface engulfed later (ENG point). After that, the price failed to return to its bearish downtrend and the price jumped to around 1960. so if the price makes a pullback to that FTR Surface, we could see a bullish reaction.
Also, we could see the Caps on price which was shown by a red border. Caps on price structure are usually RBR (RALLY BASE RALLY) or DBD (DROP BASE DROP) structures which in the second phase we could see a base an FTR or its better to say FL (flag limit). When the price reaches this surface, we expect a bearish reaction.
So we expect a bullish reaction from the range of 1770 to 1800 with the first target of 1860 and 1950 but we have to see the trigger in the lower timeframe in order to trade when the price reached to the selected zone.
Don't forget to check the fundamental reasons.
Sincerely
Hosein Poursaei

xauusd long for this weekgold hited a good support zone this week and I hope to see either the fl or end cp fl the two major demand zones, I believe there's a slight chance to have a short from first demand zone to dp (lower support zone) and then a long to next demand zone.