Diamond Setup Forming in XAUUSD Pairs?Diamond formation happens to be one of my favorite patterns just like head and shoulder which finds its way to my target point 90% of the times.
Gold presents another opportunity for us all to earn big this NFP Friday.
Use a good SL and avoid overleveraging your account.
PPPDirhams.
Disclaimer: This is just my idea. Am not liable for the end results if adapted by anyone. Trade cautiously as there are chances that you will lose your investment..
Goldspot

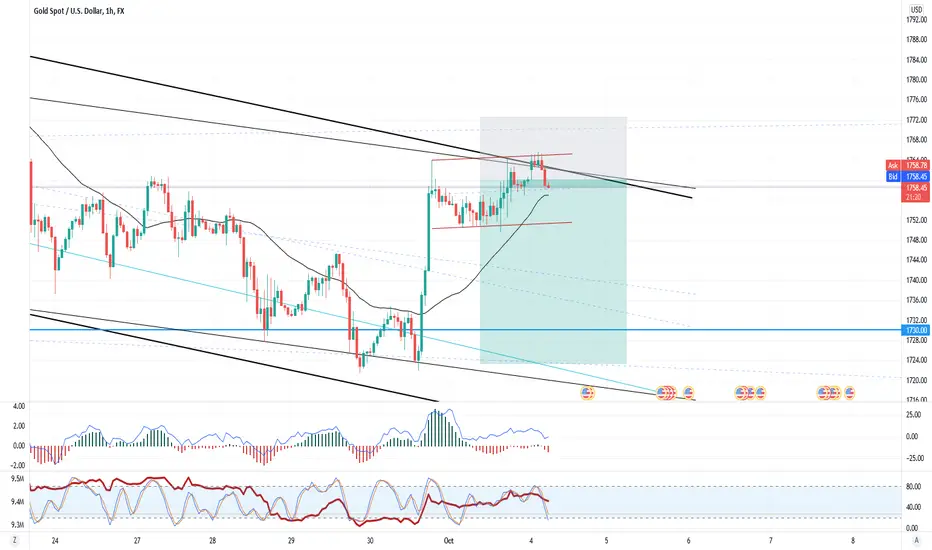
GOLD SPOT Sell Setup Almost Completed - SHORT XAUUSDFX:XAUUSD
Our price ranging area looks pretty strong. Gold will drop to correct it's previous move as it seems.
PPPDirhams.
Disclaimer: This is just my idea. Am not liable for the end results if adapted by anyone. Trade cautiously as there are chances that you will lose your investment..
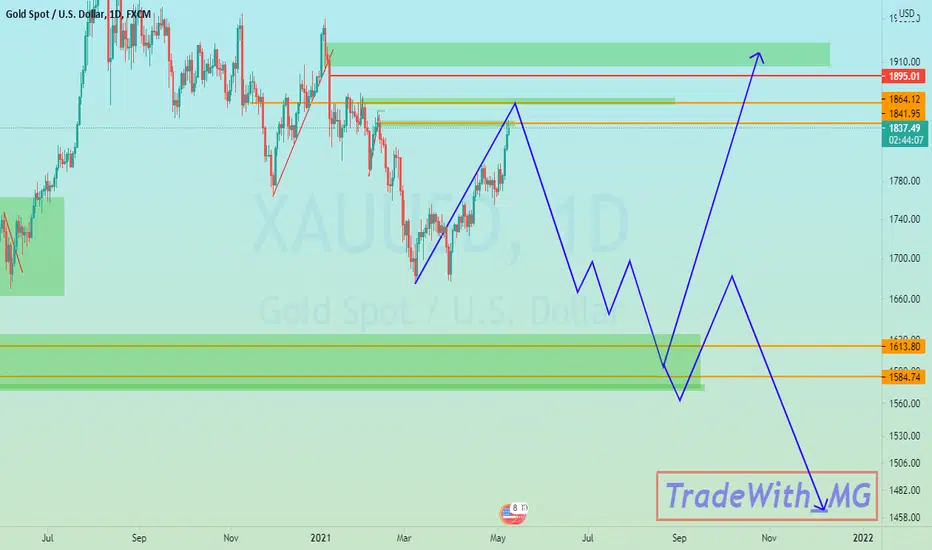
Gold Spot Set to take a DIPOANDA:XAUUSD
I think gold will rally to complete the flag formation and quickly drop to the lower bounds of or inner channel.
PPPDirhams.
Disclaimer: This is just my idea. Am not liable for the end results if adapted by anyone. Trade cautiously as there are chances that you will lose your investment..

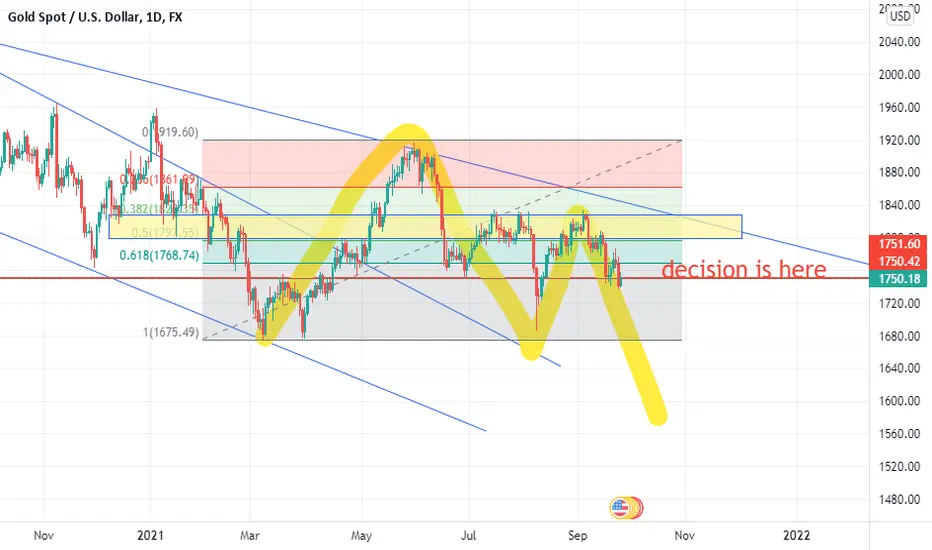
Gold to falllooking at weekly chart you can see the gold on critcal descision going lower time frame you can see in my point of view that bearish pressure continue i can expect 1678 test
XAUUSDGo see my previous analysis( XAUUSD ) , Now!
Follow me and you will be surprised AND get rich😉✌️
, saymoti 👋
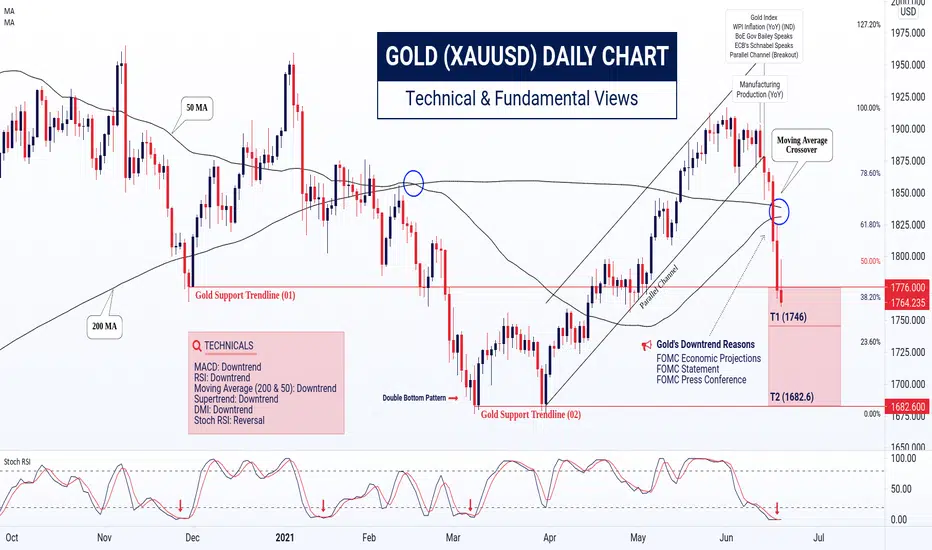
Will Gold Spot Decline More? (TP 1682.6)Gold (XAUUSD) and silver (XAGUSD) has crashed in the previous week. Gold has lost -113.585 points ( -6.05% ), and silver lost -2.14315 ( -7.68% ). Millions of CFD's traders have lost money in that week.
Where's gold's bottom?
According to technical analysis and fundamentals research, gold can decline more. Gold has broken the strong support trendline (01) and marching for 02 . If it doesn't close above to trendline of 01 in the first two trading sessions, it will be unstoppable through high selling pressure by speculators. And we will see the target price 2.
Technically, the most popular indicators are indicating a complete downtrend. And Stoch RSI is signaling for a reversal. So, it can pullback up to a retracement level of 38.2% or 01 trendlines. If that not happen, gold can lose 81.635 points more.
In the previous week, gold and silver were falls due to economic events and high selling pressures by speculators. For advance traders, watch significant releases or events that may affect the movement of gold , silver & crude oil .
Tuesday, Jun 22, 2021
00:30 - FOMC Member Williams Speaks
01:00 - All CFTC Speculative net positions
11:00 - Gold Index
20:30 - FOMC Member Daly Speaks
23:30 - Fed Chair Powell Testifies
Wednesday, Jun 23, 2021
02:00 - API Weekly Crude Oil Stock
18:30 - FOMC Member Bowman Speaks
19:15 - Flash Manufacturing PMI | Flash Services PMI
20:00 - Crude Oil Inventories
20:30 - FOMC Member Bostic Speaks
Thursday, Jun 24, 2021
18:00 - Final GDP q/q | Initial Jobless Claims
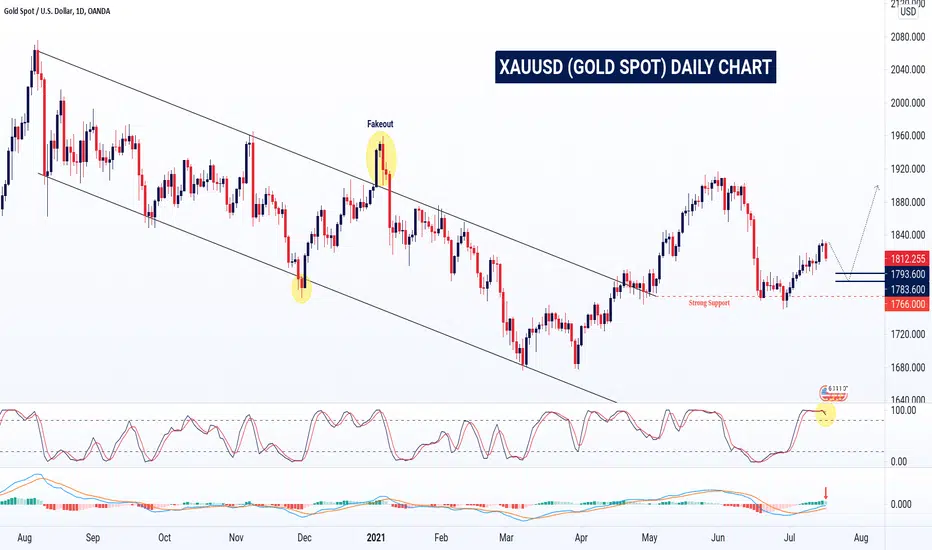
Weekly outlook of Gold SpotIn June, XAUUSD and MCX Gold crash due to FOMC events. It has recovered almost 60% to 70% loss in the July month.
Gold spot needs to break 1809 levels to retest support of 1793.6 - 1783.6 . These support levels will push the gold price higher. Gold isn't sellable until the breakout of 1766 ( strong support ).
XAUUSD will touch 1858 - 1898 levels soon.
Watch significant releases or events that may affect the movement of gold, silver, crude oil, and natural gas:
Wednesday, Jul 21, 2021
02:00 API Weekly Crude Oil Stock - Medium Impact
20:00 Crude Oil Inventories - High Impact
20:00 Cushing Crude Oil Inventories - Medium Impact
Thursday, Jul 22, 2021
20:00 Natural Gas Storage - Low Impact
Part 2: What Drives Gold (XAUUSD) Prices?PREVIOUS:
-------------------
Weekly outlook of Gold Spot -
WHAT'S NEXT:
----------------------------
Key levels: 1793.6 and 1783.6
According to my previous newsletter, my gold key levels will remain the same. It's not sellable until breakout the 1766 (strong support).
In XAUUSD, buying pressures are increasing. We may see 1812 - 1824 - 1836+ levels.
Alternatively, gold is taking a reversal from the first key level, so its upside rally may be weak. But, day traders can play between my range. And stop buying when it breaks the first key level. That could drag down the gold price directly at the second key level ( 1783.6 ).
And gold's closing price below 1783.6 means blast. It may hit the strong support level directly.
Please note, don't forget to watch significant releases or events mentioned above in the chart that may affect the movement of gold, silver, and crude oil.

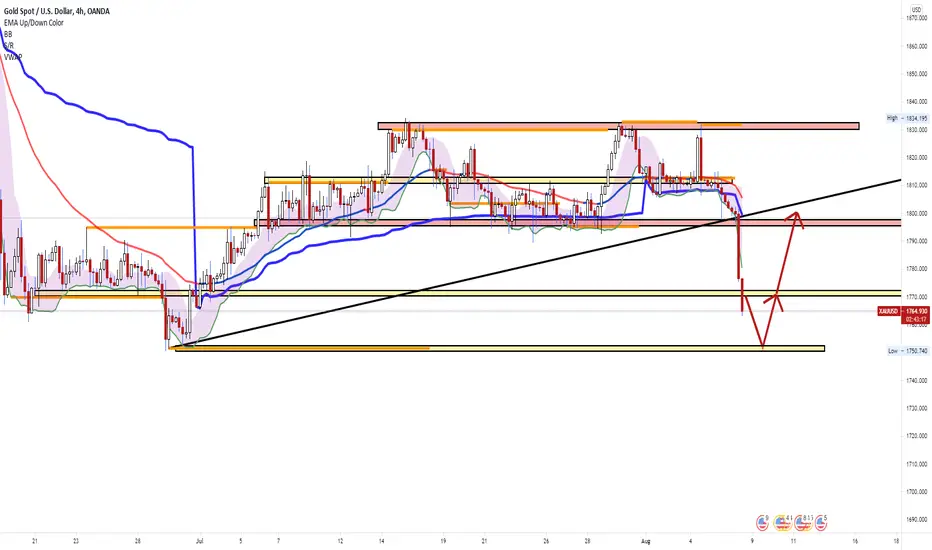
GOLD: XAU / USD Analysis (UPDATE). Very strong support!Hello TradingView Community!
Gold is at a very strong S/R level.
At first it functioned as a resistance, than for a long time as a support, then again as a resistance, and now the price has stopped by this level and again it functions as a support.
The price also reacts to the weekly Pivot point R1, from which it is reflected upwards.
At the moment, we prefer to be stay without a position on the Gold spot. It is possible to scalp in the direction of Long, but I would rather wait to see what the middle of the week and today's fundamental news will bring us.
Have a nice day. Your UCT Team.

GOLD: XAU / USD Analysis. Gold spot under pressure!As you know The EMA 200 Daily is very strong and psychologically divides the market into bull and bear.
At this point, the price of gold stopped by EMA 200 and bounced downwards, which means a drop in the price.
In addition, the price rebounded from the weekly level of Pivot point R2. To do this, we are just below the Trend Line, which has been with us since the 1st of June.
This is a confluence of several factors that, according to a technical analysis, tell us that the price of gold will fall this week.
However, the price will also move the fundamentals, so it is necessary to follow world events, especially the FED and the price of the dollar.
The UCT team wishes you pleasant trading.

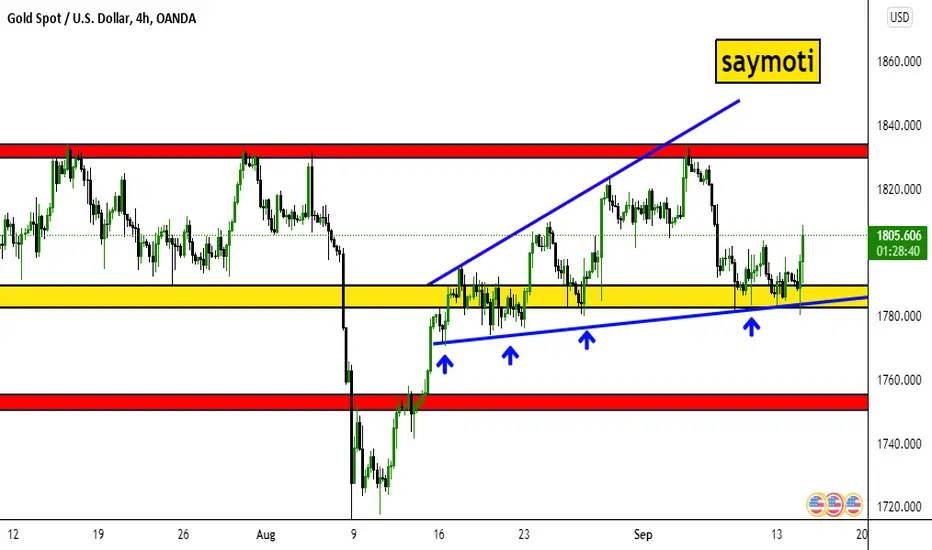
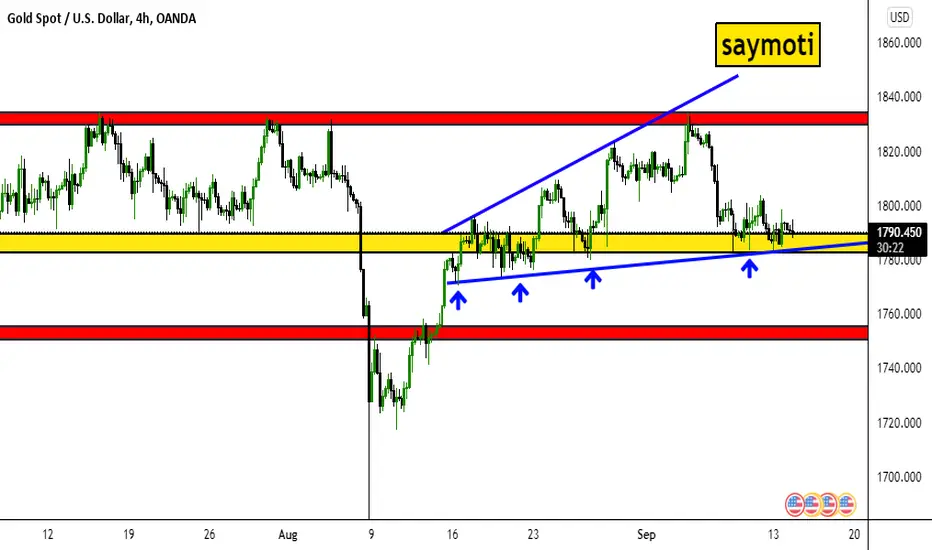
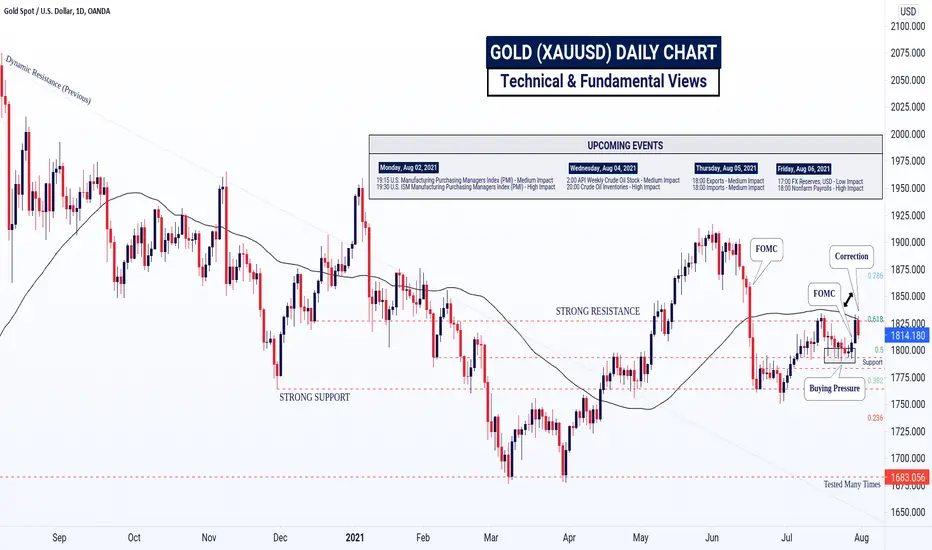
FOMC Minutes: A confirmation for an explosive rally in XAUUSDGold has started collapsing nonstop after Nonfarm Payrolls data. And it stopped at my ' tested many times ' level. XAUUSD has recovered 50% almost in the previous week.
The gold spot needs to break the 1793.6 level to start an uptrend. Afterward, it will go for 1806 - 1826 levels. And these levels can push the gold price up to 1900 .
But if gold breaks the strong support again, it will start falling. This time, it won't stop! Hence, the short-term traders can start selling from there for the targets of 1744 - 1726 - 1684 .
For advance traders, watch significant releases or events that may affect the movement of gold, silver & crude oil. Especially, don't forget to watch this Wednesday's events to find out gold upcoming actions.
Tuesday, Aug 17, 2021
18:00 Core Retail Sales (MoM) (Jul) - High Impact
23:00 Fed Chair Powell Speaks - High Impact
Wednesday, Aug 18, 2021
02:00 API Weekly Crude Oil Stock - Medium Impact
20:00 Crude Oil Inventories - High Impact
23:30 FOMC Meeting Minutes - High Impact
Thursday, Aug 19, 2021
18:00 Initial Jobless Claims - High Impact
20:00 Natural Gas Storage - Low Impact
Friday, Aug 20, 2021
Baker Hughes US Oil Rig Count - Low Impact
MCX Gold Will Have An Explosive Rally This Wednesday:
MCX traders should keep their eyes on the 46720 levels. It's a trend changer.
As per XAUUSD, Indian MCX Gold can raise 47500 - 48260 after a breakout of $1793.6 . And if it breaks the strong support of Gold Spot, it will keep falling for targets of 46260 - 45860 .

XAU LOSING FANS TO BTC INFLATION FEARS Basic Supply n demand
I use fib levelz to mark my tp levels
Heading is what it means fundamentally
Forget gold forget bonds, what better place to invest ur about to inflate money than crypto i guess that's unless the banks don't plummet it to instill fear into the sheep of get rich quick masses withdrawing investment at a loss hence increasing market fluidity...ouch right anyway Banks in control of bitcoin so ur money definitely ain't safe especially with the masses coming from the inflation fears
I would say one more pump n dump
Google it

XAU letting the shorts cool then looking for upsideThis is an idea not a advice
News drifted Gold to the lowers side, now looking for supports and stabilisation before moving back to its average price.
Gold will come back to the $1800 level?On 16 July, gold has crashed over 60$ during the FOMC event. At that time, Commodity Futures Trading Commission (CFTC) data was highlighting selling pressure.
GOLD - COMMODITY EXCHANGE INC.
FUTURES ONLY POSITIONS AS OF 07/27/21
(CONTRACTS OF 100 TROY OUNCES) | OPEN INTEREST: 500,187
NON-COMMERCIAL & COMMERCIAL TOTAL
-----------------------------------------------------------------------
LONG 452,107 | SHORT 481,533
Ref: CFTC Gov
And on 27 July, CFTC data was said OI (Open Interest) of a gold future contract is 500,187 and total shorts 481,533 & buys 452,107 . But, gold prices increased.
We have to notice that the bullish rally wasn't powerful compare to the 16 July data. And selling pressure has higher compare to buyers. Hence gold has moved bearish side in the last trading session.
If gold wants to move upside, then it has to crossover my strong resistance. That will lead the gold's prices above 1840 - 1860 - 1882 - 1900 .
But if you focus fundamentally & CFTC data, XAUUSD will keep falling and touch the following targets: 1793.6 - 1783.6 - 1763.6 . Gold is making double top formation also.
XAU Long This is an idea not an advice
Looking at long after strong institutional upward after recent news and current correction, as expected in the post i made before.
However if the trend violates the red zone and drops below it will move back down to last support around 1795.
Fundamentally, due to pressure of inflation, gold is a security that most will look towards as a safety net. So upwards is mostly expected.

XAU ShortThis is an idea not an advice or guide
Bouncing off that EMA line, now looking strong downward momentum to reach stronger demands to push off to the top.
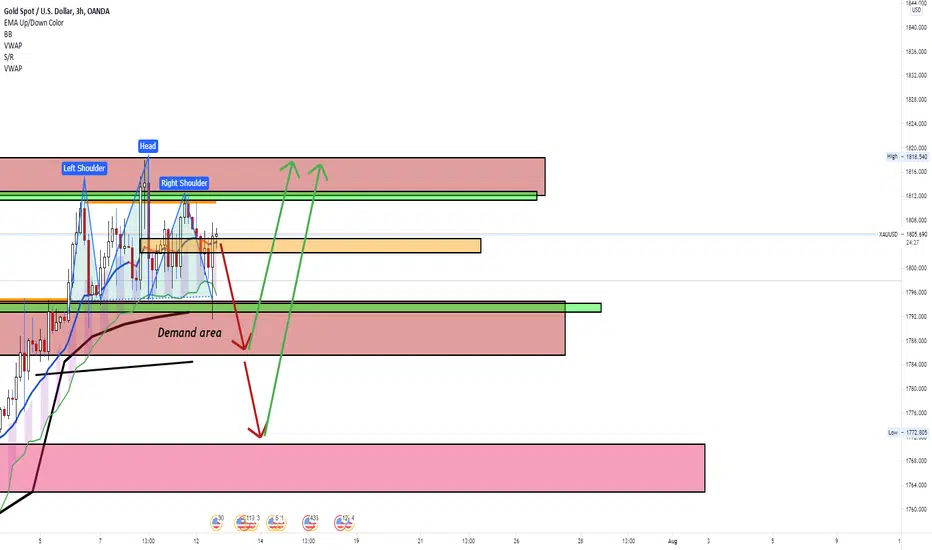
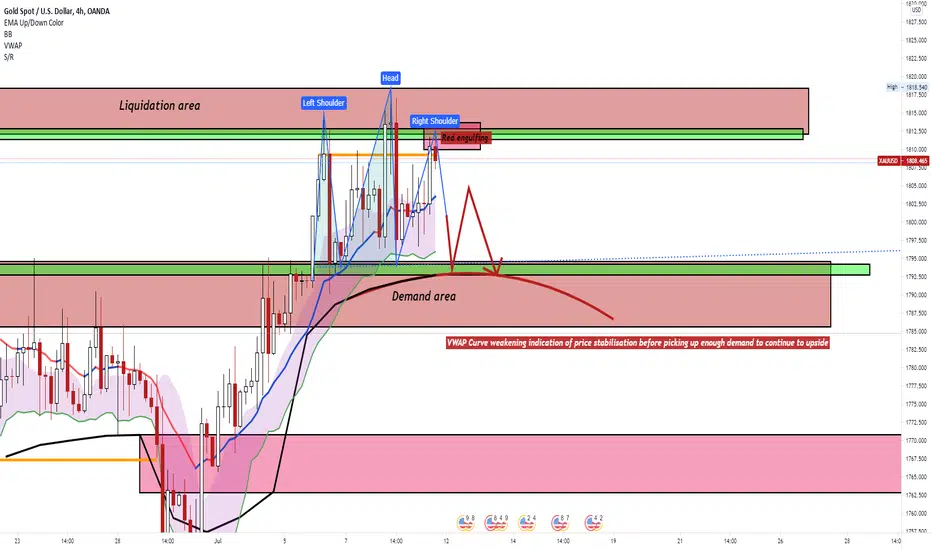
XAU ShortThis is an idea not a guide
Reasons for short
Red engulfing after reaching liquidity area
Head and shoulders formation
VWAP arriving towards the demand area
Price looking to stabilise before having enough demand to push off again
Gold, falling wedge pattern at H1OANDA:XAUUSD
It's my perception.
Lets see..
DISCLAIMER :
What I publish is my analysis for your overview. At your own risk.

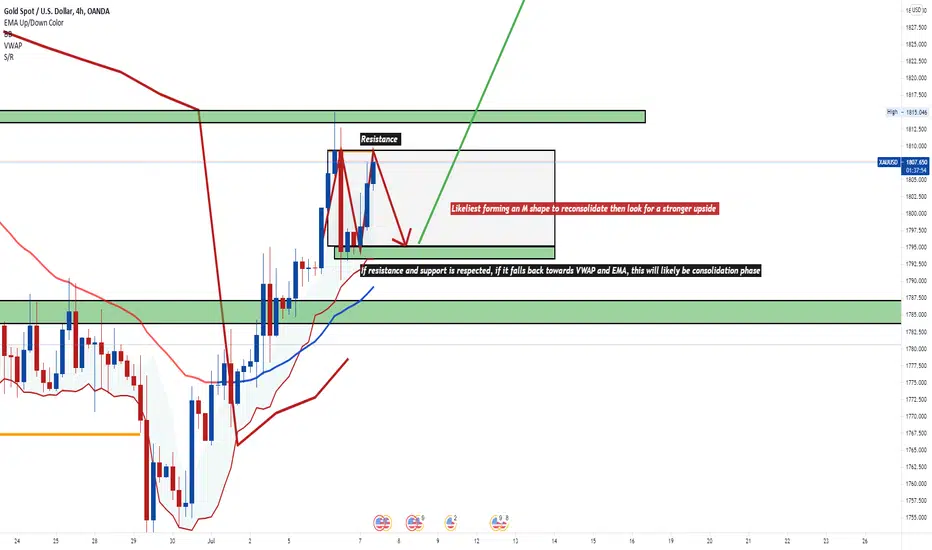
Short XAU/USD This is an idea not an advice
Reconsolidation
M shape formation
Close to resistance
VWAP and EMA below, which will be the demand area
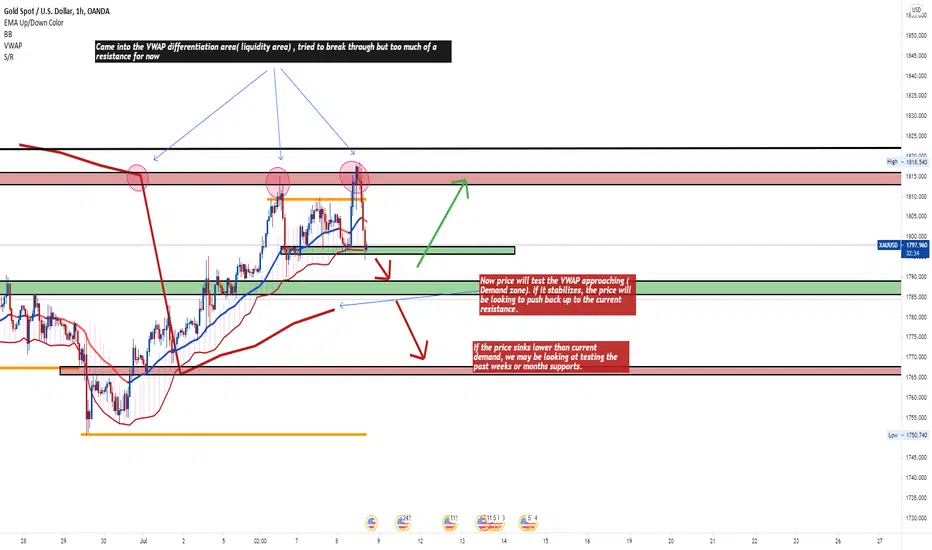
XAU SellThis is an idea, not a guide or advice
We are currently observing a move to the down side after reaching liquidity zone, which was too much resistance. However, the downwards shift will test the demand area. If it holds, we will look for a move up to the current resistant area again. If it does break through that demand zone , we will possibly be looking at previous weekly and monthly supports.
Gold is about to break the long time descending channelGold has been on a decline path within 6 months or so, now by getting support of Ichimuko and gathering strength from the previous bearish leg and also getting provided by enough support from lower boundary of the channel, IS READY to make a move and find its way up. So keep an eye on it and hope we'll see its drought come to an end.
Trade Safe ...
