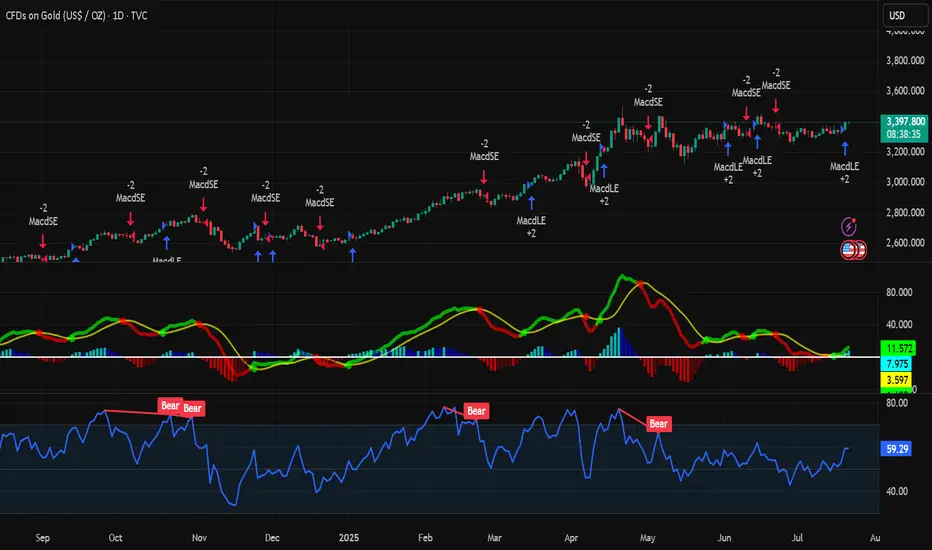
The trend is clear, why do I choose to be firmly bullish on goldGold Trend Analysis: Yesterday, the gold market demonstrated strong upward momentum, opening near 3290 before falling slightly to a low of 3281 before fluctuating upward. Boosted by the non-farm payroll data, the gold market surged during the US trading session, reaching a single-day gain of 2.02%, reaching a high of 3363 and closing there. The daily chart formed a long bullish candlestick with a long lower shadow, forming a Morning Star pattern, reinforcing the bullish trend. From the perspective of the cycle structure, the daily level is clearly in the 5-wave upward stage, and the upward trend of the large cycle has not changed. At the indicator level, the daily MACD momentum column (the column below the zero axis) represents the short-selling momentum. Its "gradual shortening" means that the short-selling force is weakening and the downward momentum is gradually fading. It is a potential signal of stopping the decline or rebounding. KDJ is about to form a golden cross between 20-50, which is a signal that short-term bullish power is beginning to increase, and the overall trend is bullish.
The 4-hour level shows typical bullish characteristics: the moving average system is arranged in a bullish pattern, but there is a certain deviation between the short-term price and the moving average. The technical side needs to correct the deviation rate through a callback before continuing to rise. The short-term support below is focused on the line near 3330-3335. This position is both the relay support level in the previous rise and the intersection of the 4-hour moving averages MA10 and MA20, which has strong support strength; the short-term resistance above is focused on the line near 3370-3383. This area is a pressure-intensive area near the previous high point. If it can be effectively broken through, it will further open up upward space. A successful breakout would open up further upside potential. A breakout would further open up the 3400 mark.
For gold trading, the short-term strategy is to buy on dips. If the price pulls back to the 3330-3335 support level, consider entering a long position with a target of 3355-3365. If it reaches 3370-3380, consider a short-term short position with a target of 3350-3340.
Goldtradeidea

Only by understanding the trend can you be firmly bullish.The market is changing rapidly, and going with the flow is the best way to go. When the trend comes, just go for it. Don't buy at the bottom against the trend, so as not to suffer. Remember not to act on impulse when trading. The market is good at dealing with all kinds of dissatisfaction, so you must not hold on to orders. I believe many people have experienced this. The more you resist, the more panic you will feel, and the floating losses will continue to magnify. You will not be able to eat or sleep well, and you will miss many opportunities in vain. If you also have these troubles, then you might as well follow Tian Haoyang's rhythm and try to see if it can make you suddenly enlightened. If you need help, I will always be here, but if you don't even extend your hand, how can I help you?
Gold rose unilaterally after the positive non-farm payrolls on Friday, hitting a new high this week. This week's K-line closed in a hammer shape, and the gold hourly line has a double bottom structure. However, gold should not have such a big retracement for the time being. The 3335-3330 line below is also an important support. So gold will mainly be bought on dips above 3335-3330 next week. Technically, there is still room for growth next week. The bulls continued to attack at the end of Friday and closed at 3363. Next week, we will continue to pay attention to the short-term suppression at the 3370-3375 line above. In terms of operations, we will continue to maintain retracement and buy. If your current operation is not ideal, I hope I can help you avoid detours in your investment. Welcome to communicate and exchange. Judging from the current gold trend, the short-term resistance above next week will be around 3370-3375, with a focus on the important pressure line of 3395-3400. Keep buying on pullbacks, and try to maintain a stable wait-and-see position in the middle. I will prompt the specific operation strategy at the bottom, so please pay attention in time.
Gold operation strategy: Go long on gold when it retraces to around 3340-3330, target 3370-3375, and continue to hold if it breaks through.

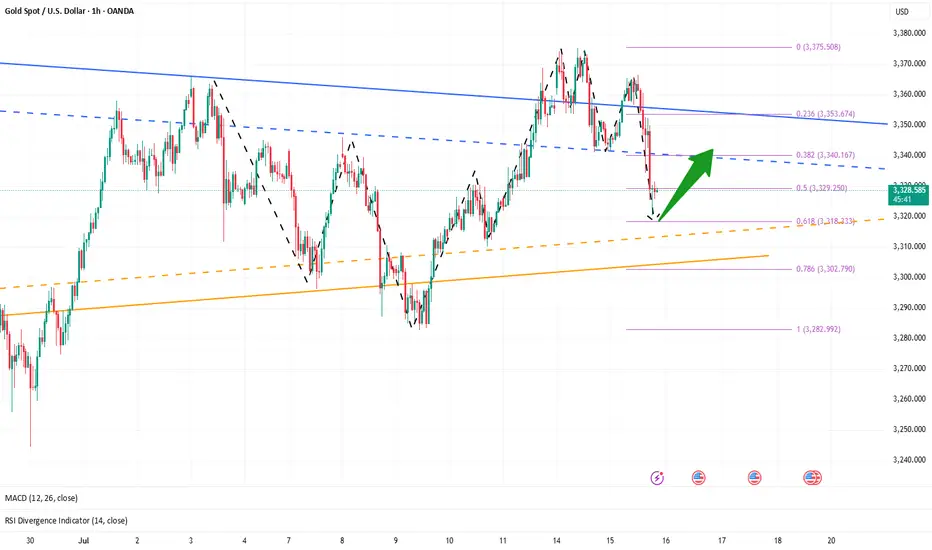
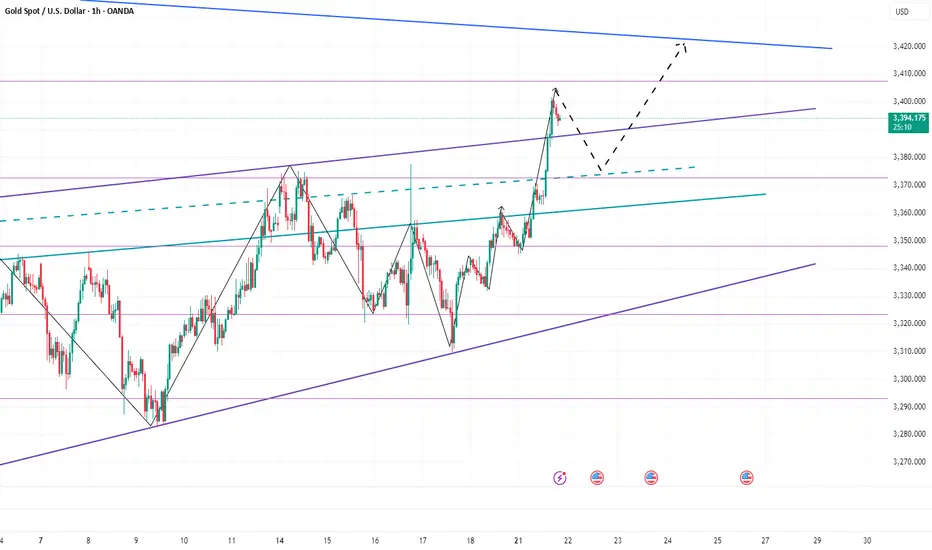
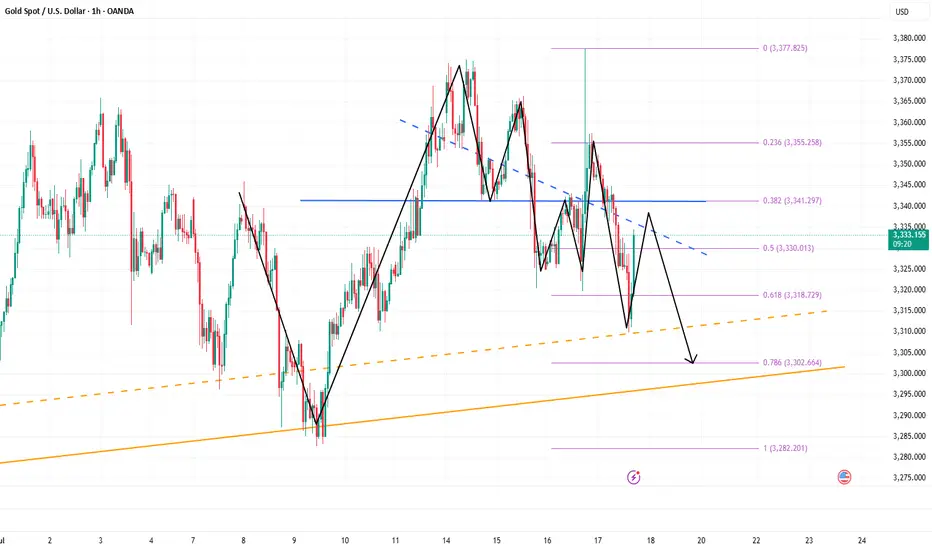
Gold Awaits Fed Rate Decision – Key Levels & Volatility AheadGold is currently trading near $3,332, showing a minor recovery after recent downward momentum. The price action on the 1-hour chart highlights a short-term ascending structure, which often acts as a corrective move rather than a strong bullish trend. The market previously saw significant selling pressure from above $3,355–$3,360, creating a short-term supply zone. Unless the price breaks and holds above this zone, the overall momentum remains bearish.
The chart also shows a projected price path where gold could push slightly higher toward $3,355, meet resistance, and potentially reverse downward again. Key support lies at $3,320, and if this breaks, we could see gold testing $3,290–$3,280 levels, aligning with the black trend line support. However, if bulls manage to break above $3,360, it would signal potential upside continuation toward $3,380–$3,400.
Key Points
- Key Resistance Levels: $3,355 and $3,360 (critical supply zone).
- Key Support Levels: $3,320 (short-term), followed by $3,290–$3,280 (major trendline support).
- Expected Short-Term Move: Possible push toward $3,355 → rejection → decline back toward $3,320 and possibly $3,290.
Bullish Breakout Scenario: A strong close above $3,360 could push price toward $3,380–$3,400.
Overall Bias: Bearish while trading below $3,360.
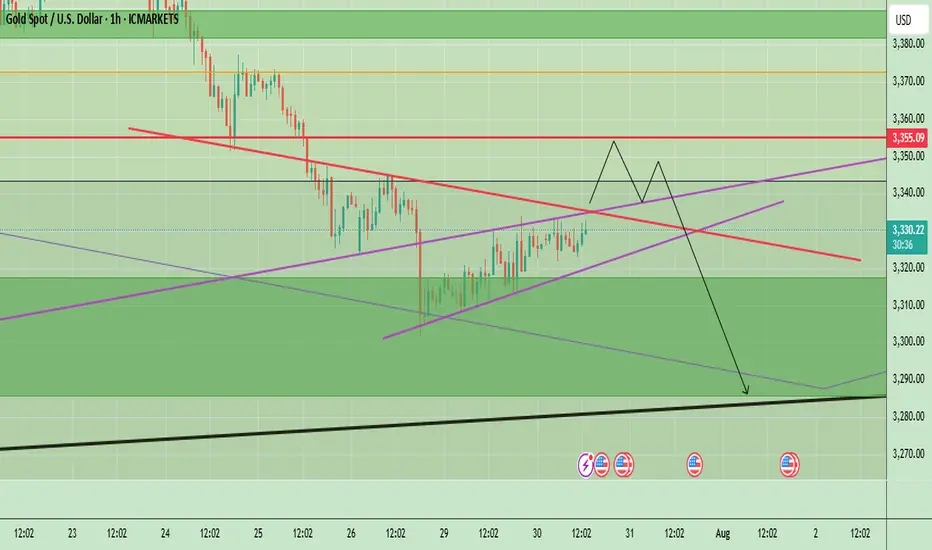
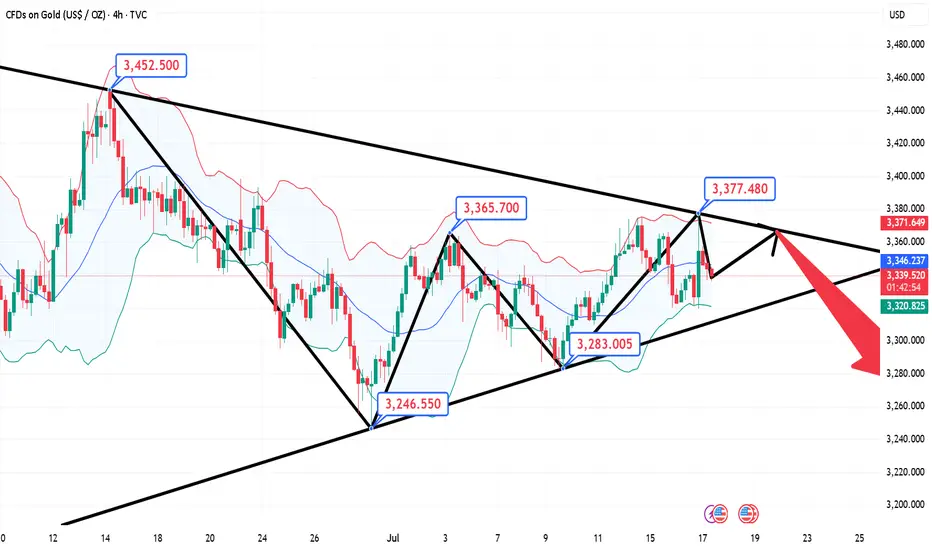
4hr Chart
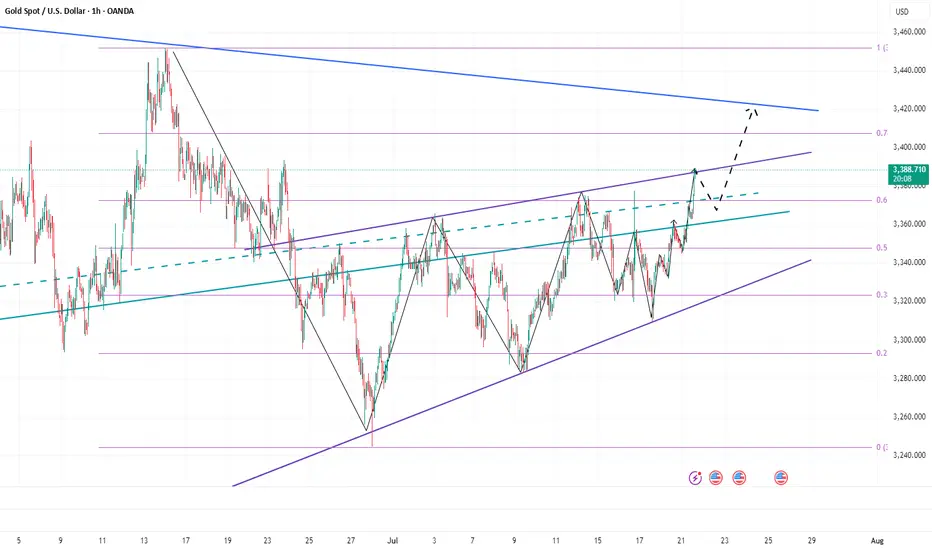
Price remains under pressure below the descending trendline. A small pullback toward $3,345–$3,350 is possible, but as long as price stays under this resistance, the bias remains bearish with potential downside targets around $3,300–$3,280.
Key Levels:
- Resistance: $3,350 → $3,381 → $3,394
- Support: $3,324 → $3,281 → $3,254
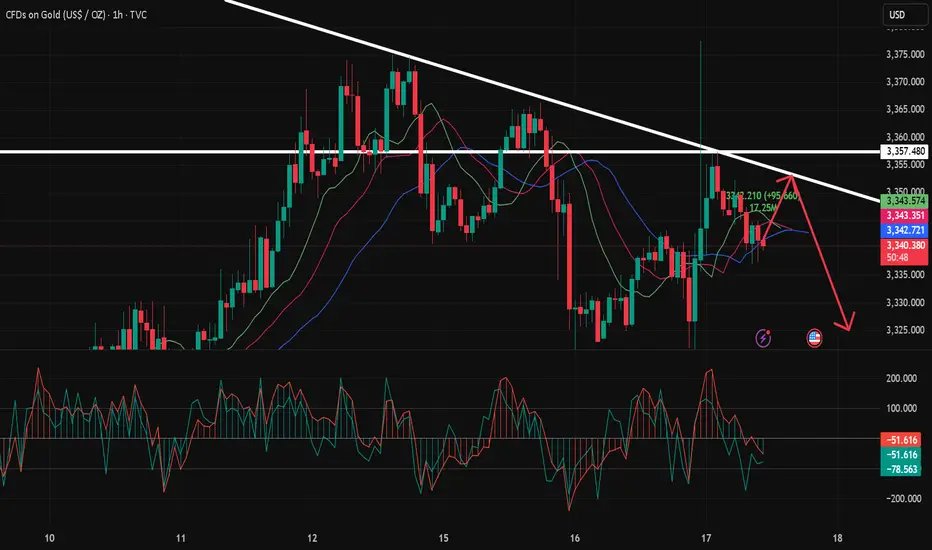
Today’s FOMC interest rate decision is a key driver for Gold. Here’s the quick analysis:
- If Fed Hikes Rates or Maintains Hawkish Tone:
- Strong USD likely → Gold could face more selling pressure.
- Key support zones: $3,324 – $3,300, then $3,281 and $3,254.
- If Fed Pauses or Turns Dovish:
- Dollar weakens → Gold may bounce toward resistance zones.
- Upside levels: $3,355 – $3,360 and higher toward $3,381 – $3,394 (Fib levels).
Expect high volatility; $3,300 is a critical support to watch. A dovish Fed may give Gold short-term relief, but a hawkish stance could accelerate the downtrend.
Note
Please risk management in trading is a Key so use your money accordingly. If you like the idea then please like and boost. Thank you and Good Luck!
Gold Softens — Watching for a Tactical Long OpportunityYesterday, gold hit a low of around 3351 and then began to rebound. During the rebound, it hit a high of around 3377 and then retreated again. We can clearly see that below 3400, gold is still weak overall, and even failed to reach 3380 during the rebound. In the short term, the 3380-3390 area has become an obvious resistance area.
Yesterday, gold rebounded after dropping to around 3351. Whether the support near 3350 is effective has not been verified again, so from a technical perspective, gold still has the need to retreat again and test the support near 3350. Once gold falls below the area when testing the support near 3350, gold may continue to fall to the 3335-3325 area.
Therefore, in today's trading, the focus is still on shorting gold, supplemented by trying to go long on gold with the support.
1. Consider shorting gold in the 3380-3390 area, TP: 3365-3355;
2. Consider going long gold in the 3355-3345 area, TP: 3365-3375; strictly set SL
3. If the 3355-3345 area is broken, try to go long gold again in 3335-3325, TP: 3360-3370
350pips Secured — Focus Shifts to Dip-Buying StrategyToday's trading was very successful, and the grasp of the long and short rhythm was very accurate. Today's trading situation is as follows:
1. Close the short position with an overnight entry price of around 3386 near 3380, with a loss of 60 pips, and the loss amount exceeded $6K;
2. Directly short gold near 3380, manually close the position near 3366, profit 130pips, profit amount exceeded $12K;
3. Long gold near 3356, hit TP: 3372 and end the transaction, profit 160pips, profit amount exceeded $8K;
4. Long gold near 3362, hit TP; 3375 and end the transaction, profit 120pips, profit amount exceeded $6K.
Intraday trading summary: Today, the long and short sides completed a total of 4 transactions, one of which suffered a loss, but the net profit was 350pips, and the profit amount exceeded $20K. For short-term trading, I think I can submit a satisfactory answer to myself today!
How to execute the transaction next? Gold started to pull back from around 3438 and has now reached a low of around 3351, with a retracement of more than 870pips. The retracement space is not small. However, gold has stabilized above 3350 and has started a technical rebound repair, and the upward force is not weak, so gold may have completed the retracement. Under the support of these two technical conditions, gold may regain its upward momentum and hit 3400 again.
At present, the short-term resistance is obvious, located in the area near 3380. Once gold breaks through 3380, gold will inevitably continue to rise and hit 3400 again; but I think as long as gold stabilizes above 3350, it is not difficult to break through the short-term resistance of 3380, so gold will inevitably test the 3400 mark again; and the short-term support below is in the 3365-3355 area. Gold may still retreat to this area first during the rise in order to increase liquidity and accumulate momentum, helping gold to break through 3380 more easily.
So for the next short-term trading, I think it is feasible to go long on gold in the 3365-3355 area, first looking at the target area of 3380-3390, and then 3400.
Double Down on Gold — Targeting 3400–3410!Obviously, gold did not give us the opportunity to short gold near 3440 today. In the process of its recent pullback, gold tested 3400 as expected, and after falling below 3400, it continued to fall to around 3385 as if it was planned by me. Although the lowest point had reached around 3381, it quickly rebounded above 3385. What is relatively regrettable today is that both of our plans to short gold ended in failure. The first time was when gold did not give us the opportunity to short near 3440. The second time was when we were preparing to short gold at 3400 and set the TP to 3385. However, we did not have time to create an order because the price fell too quickly, causing us to miss the gold short trade again.
At present, I have a trading order to go long on gold near 3386. And I go long on gold with twice the usual trading volume. Why am I still optimistic about the rebound of gold in the short term after the gold price fell by nearly $60? Because the area around 3385 is the short-term bull-bear dividing line, although gold has fallen sharply, as long as it stays above the area around 3385, gold is still in a bullish trend as a whole, and the bullish structure has not been destroyed, so in the short term, gold still has a lot of room for rebound after the pullback. This is why I dare to use twice the usual trading volume to buy gold near 3386.
However, because the current gold long and short continuity is not strong, and the market uncertainty is still increasing due to complex news, the gold market is prone to violent fluctuations in the short term, so we have to be more careful in trading. At present, I still hold a gold long position near 3386, and I hope that gold can continue to rebound to the target area: 3400-3410.
Gold CFD Trading: Practical Steps and Influencing Factors Gold CFD Trading: Practical Steps and Influencing Factors
Gold trading in forex offers a dynamic and potentially rewarding opportunity for traders. This article delves into the essentials of trading gold, from understanding its unique position as both a commodity and a financial asset to its price determinants and how to trade it.
Understanding Gold as a Trading Asset
In international gold trading, gold's role extends beyond being just a precious metal; it is a unique asset class. Its intrinsic value and universal appeal have made gold a cornerstone in financial markets for centuries. Unlike many other commodities, gold maintains its value not just in times of economic stability but also during volatility. This dual nature arises from its status as both a tangible commodity and a symbol of wealth, leading to its classification as a so-called safe-haven asset.
Investors often turn to gold when currencies and other markets face instability. Additionally, gold's relatively limited supply, juxtaposed with its consistent demand across industries and jewellery markets, ensures its lasting relevance in the trading world. Understanding these characteristics of gold is crucial for forex traders, as they form the foundation of its behaviour and pricing in the financial markets.
Fundamentals of Gold Trading
For those looking to learn to trade gold, it's essential to grasp the basics of how gold is traded. Primarily, gold trading is conducted through Contracts for Difference (CFDs), a popular derivative that allows traders to speculate on its price movements without owning the physical metal.
CFDs offer a flexible way to engage in gold trading, providing the ability to trade both rising and falling markets. This versatility is often cited as the best way to trade gold, especially for those who prefer short-term positions. Unlike gold stock trading, where investors buy shares in gold-related companies, gold CFD trading focuses directly on the price movements of the metal itself.
Via CFDs, gold is typically traded against the US dollar, denoted as XAU/USD. Here, XAU represents one troy ounce of gold, a standard unit of measurement in the precious metals market. Traders analyse market trends and use leverage to potentially enhance their opportunities. However, leverage is a double-edged sword, potentially magnifying losses.
Factors Influencing Gold Prices
Understanding the factors that influence gold prices is critical for anyone engaged in trading this precious metal. Here are key elements that traders usually monitor:
1. Economic Indicators: Key economic data such as GDP growth rates, employment figures, and inflation reports can significantly impact prices. Typically, weak economic performance or high inflation rates increase gold's appeal as a hedge against currency devaluation.
2. Monetary Policy: Central banks' decisions on interest rates and quantitative easing play a major role. Lower interest rates can decrease the opportunity cost of holding non-yielding assets like gold, thus boosting its demand.
3. Currency Strength: The strength of the US dollar is inversely related to gold prices. As gold is paired with the US dollar, rising USD will make gold cheaper.
4. Geopolitical Events: Political uncertainties and global crises often drive investors towards gold as a so-called safe-haven asset. Events causing economic instability can lead to a surge in prices.
5. Market Demand: Demand from industries like technology and jewellery and investment demand significantly influence prices.
6. Gold Trading News: News and reports related to mining, supply constraints, or large market transactions can immediately affect prices.
How to Trade Gold
Trading gold effectively requires a combination of well-chosen strategies, relevant indicators, and insights from trading signals. A comprehensive gold trading tutorial is a great starting point for understanding the mechanics of the market.
One of the best strategies to trade gold is following the trend. This involves identifying the direction of the market trend and making trades in alignment with this trend. For instance, if gold is on an upward trend, a trader might take a long position, and vice versa for a downward trend.
Regarding the best indicators for gold trading, traders often rely on tools like Moving Averages to identify trends, the Relative Strength Index (RSI) for overbought or oversold conditions, and MACD for momentum and trend changes.
Additionally, utilising gold trading signals can be effective. These signals, provided by market analysts or automated systems, offer assumptions on when to enter or exit trades based on market analysis. However, traders usually use these signals as a guide rather than a definitive command, combining them with their own research and risk management strategies.
Practical Steps for Gold Trading
Starting your journey in gold trading can be both exciting and challenging. Here are some practical steps to help you navigate this market:
- Educate Yourself: Before diving in, invest time in understanding the gold market. You can read books, watch webinars, and follow gold trading tutorials.
- Start Small: Begin with smaller investments to limit risk as you learn the ropes.
- Use Demo Accounts: Practice with demo accounts to gain experience without financial risk.
- Keep Up with News: Stay updated with global economic news, as they can significantly impact prices.
- Risk Management: Always use stop-loss orders to minimise potential losses.
- Review and Learn: Regularly review your trades to learn from successes and mistakes.
The Bottom Line
Embarking on your gold trading journey can be a transformative experience. With the knowledge and strategies outlined in this article, you can be well-equipped to navigate the market. Happy trading!
This article represents the opinion of the Companies operating under the FXOpen brand only. It is not to be construed as an offer, solicitation, or recommendation with respect to products and services provided by the Companies operating under the FXOpen brand, nor is it to be considered financial advice.

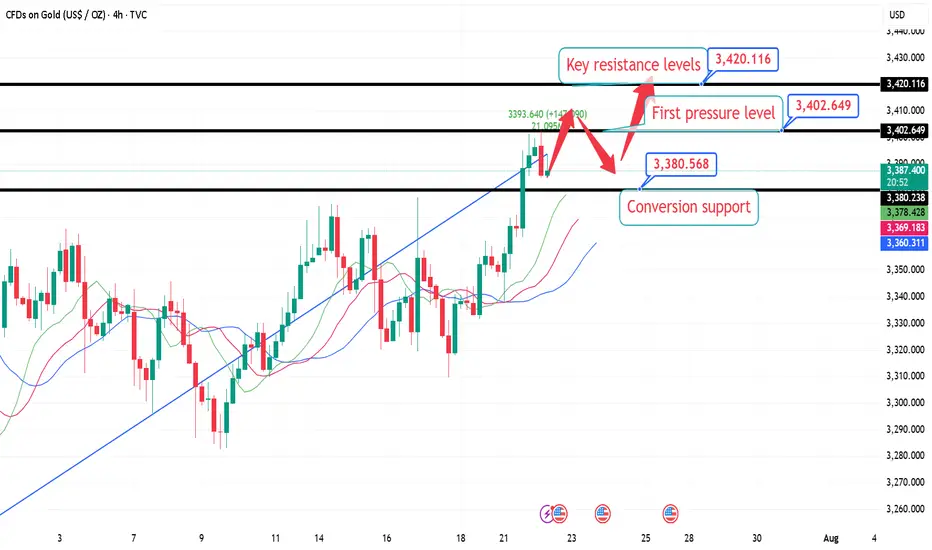
More Pain for Gold? The Charts Say It’s PossibleSince the start of the London market, gold has almost maintained a narrow range of fluctuations in the 3390-3385 area. Compared with yesterday, the market is much weaker today, and gold has failed to stabilize at 3400 several times, indicating that the sentiment of cashing out near this area is also very high. From the current gold structure, gold is obviously biased towards a long structure. Since gold broke through 3400, 3375-3365 has become the key support area after the top and bottom conversion in the short term.
However, gold rose strongly yesterday but did not stabilize at 3400. The bullish sentiment may no longer be strong. Moreover, after the accelerated rise in gold, the sustainability was not strong, so gold still needs to retreat in the short term. This is why I insisted on shorting gold again near 3400 yesterday. Therefore, I think gold has not yet retreated to the right level. I will pay attention to the opportunity to go long on gold after it pulls back to the 3375-3365 area.
Gold fell after touching 3400 twice. Whether a short-term effective "M" double top structure has been formed, I think more signals are needed to verify. However, in the short term, it is still under pressure in the 3405-3410 range, so if there is no major positive news, I think gold may maintain a wide range of fluctuations in the 3410-3360 range. Therefore, if gold rises to the 3400-3410 range again, I will continue to try to short gold!

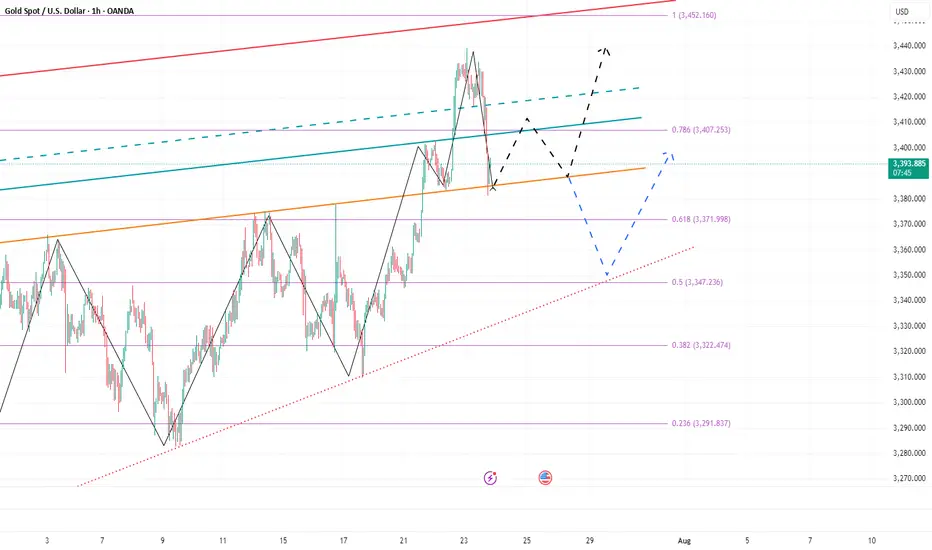
7.22 London Gold Market Analysis and Operation SuggestionsFrom the market perspective, the trend suppression line from the historical high of 3500 to the secondary high of 3452 has moved over time and is now around 3420, which can be used as an important resistance level reference for this week; the previous resistance level of 3376 can be converted into support after breaking through. For intraday short-term operations, focus on this range of callbacks and go long, wait for the key resistance level to be touched before going short, or see if there is an opportunity to arrange a mid-term short order based on the real-time trend.
Specific intraday operation ideas:
①. When the gold price falls back to around 3380, participate in long orders and call, protect the position of 3374, and first look at the position of 3402, the high point on Monday;
②. After yesterday's high point breaks, wait for a correction to around 3395 to continue to participate in long orders and call, protect the position of 3388, and look at the key suppression level of 3420;
③. (Aggressive orders, for those who are afraid of missing out) If you are short or have enough positions, you can first participate in long orders with a light position at the current price of 3388, and wait for 3380 to increase your position, and the target is the same as above.
Analysis of short-term gold trading on July 22Technical aspects:
From the daily candlestick chart, gold has recently shown signs of breaking upward after five weeks of sideways fluctuations. In terms of MACD indicators, the MACD bar chart has turned from green to red, and the fast and slow lines have formed a "golden cross", strengthening the expectation of a short-term technical rebound.
At the same time, the 14-day RSI index rebounded to 57.67, still in the neutral and strong area, and has not yet entered the overbought area, indicating that the price still has room to rise. Analysis shows that the middle track of the Bollinger Band 3342 constitutes initial support, while the strong support below is at the two previous lows of 3247.87 and 3120.64.
If the bulls maintain their advantage above the integer position of 3400, they are expected to hit the high point of 3451.14 in the short term, and even further test the historical high of 3499.83; on the contrary, if they fall back below 3342, the short-term upward momentum will be tested.
Bull analysis:
If gold successfully stands above 3400, the market will turn its attention to the two key resistance areas of 3451 and 3499, the high point of the year. Breaking through the former will open up the space to test the historical high upward; combined with the current MACD golden cross pattern, if the capital side and the fundamentals continue to cooperate, it is not ruled out that there will be a short-term accelerated rise.
Bear analysis:
If the breakthrough fails, especially if gold falls back below the middle track of Bollinger, the adjustment pressure will be restarted, and the lower edge of the previous consolidation range of 3300 will constitute an important support. If it falls below again, it is necessary to pay attention to the important technical support near 3247 and the 100-day moving average of 3180.
7.22 Gold falls back and continues to be bullish, 3400 is not thFrom the 4-hour analysis, the short-term support below is 3370, the important support is 3350-55, and the upper resistance is 3400-05. The overall support during the day is to maintain the main tone of high-altitude and low-multiple cycles in this range. For the middle position, watch more and do less, be cautious in chasing orders, and wait patiently for key points to enter the market.
Gold’s Rapid Surge: A Trap Before the Drop?Gold finally showed signs of retreat. We are still holding a short position near 3400. So far, we have made a profit of 50 pips. However, I will still hold it to see if gold can fall back to the 3385-3375 area as expected. We have completed 2 transactions today, and there is still 1 transaction left to hold.
1. First, we bought gold near 3345 and ended the transaction by hitting TP: 3370, making a profit of 250 pips, with a profit of more than $12K;
2. We shorted gold near 3385 and ended the transaction by hitting SL: 3395, with a loss of 100 pips, a loss of nearly $5K;
3. We are still holding a short gold transaction order near 3400, with a current floating profit of 60 pips and a floating profit of nearly $4K;
The above is the detailed transaction situation today. To be honest, today's rebound strength far exceeded my expectations, and after our first long position hit TP, the market never gave any chance to go long on gold after a pullback, but accelerated to around 3401. But obviously, the accelerated rise of gold is suspected of catching up with the top, and in the short term it faces resistance in the 3405-3410 area, and secondly pressure in the 3420-3425 area. So I don't advocate chasing gold at the moment. On the contrary, I am still actively trying to short gold around 3400, first expecting gold to pull back to the 3385-3375-3365 area.
And I think if gold wants to continue to test the 3405-3415 area, or even sprint to the area around 3425, gold must go through a pullback to increase liquidity to accumulate upward momentum. I think it will at least pull back to the 3385-3375 area.
Warning Signs After Gold’s Sharp Rise — Is a Pullback Coming?Today, gold rebounded from around 3345, and has now rebounded to around 3389, which is only one step away from the 3400 mark. Gold has hardly retreated during the rise, and the rise is strong. However, we can see from the small-level candle chart that gold suddenly accelerated its rise after consolidating around 3365, and continued to around 3390, and is now oscillating near the recent high trend line.
After gold accelerated its rise and oscillated near the recent high trend line, this made me have to be more cautious, because we must be careful that the acceleration of gold's rise in the short term is a trap for buyers, so even if we are bullish on gold in the short term, we should not directly chase gold at a high level; according to the current structure of gold, I think it is necessary for gold to retest the 3370-3360 area support before continuing to rise and hitting 3400. Only after verifying that the support in this area is effective can it be conducive to a better rise in gold!
So for short-term trading, I think we can still try to short gold now, and then wait patiently for gold to retest the 3370-3360 area.
Analysis of short-term operations of gold on July 21Daily Analysis:
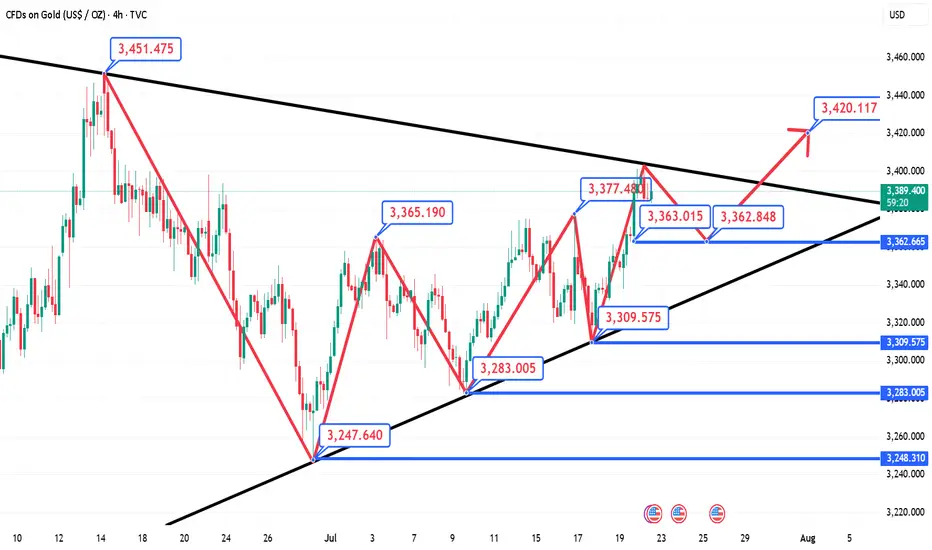
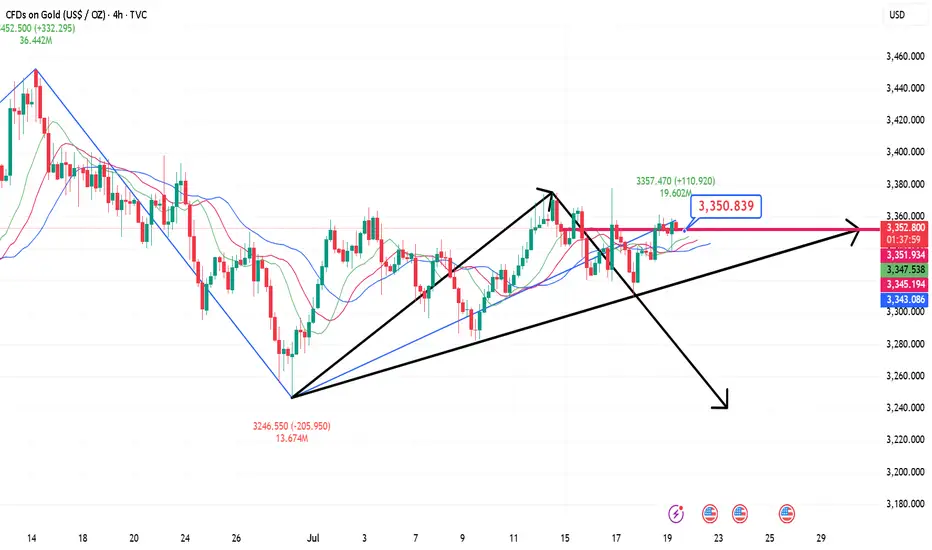
On the daily chart, it can be seen that gold has rebounded from the main rising trendline again, and bargain hunters have set clear risks below the trendline, betting on a price rebound to the 3438 resistance level. Bears need the price to break below the trendline to open up space for a deeper correction, with the next target looking at the 3120 level.
4-hour analysis
On the 4-hour chart, it can be seen that there is a secondary resistance area near 3377. If the price rebounds to this level, it is expected that bears will intervene here and set risks above the resistance, with the goal of pushing the price below the main trendline. Bulls will look for the price to break through this resistance to increase their bullish bets on the 3438 level.

Is This the Start of a New Gold Bull Run?News that must be paid attention to:
1. The Middle East region is in constant conflict and the situation is unstable, which may re-stimulate the market's risk aversion sentiment;
2. Trump strongly called for a rate cut, and many Fed directors agreed to the rate cut. Under the situation of internal and external troubles, can Powell withstand the pressure of rate cuts? In addition, the tense relationship between Trump and Powell, as well as the development of Powell's dismissal storm, have increased the market's risk aversion demand and enhanced the market's bullish sentiment;
3. The uncertainty brought about by the tariff issue may disrupt the market.
Technical aspects:
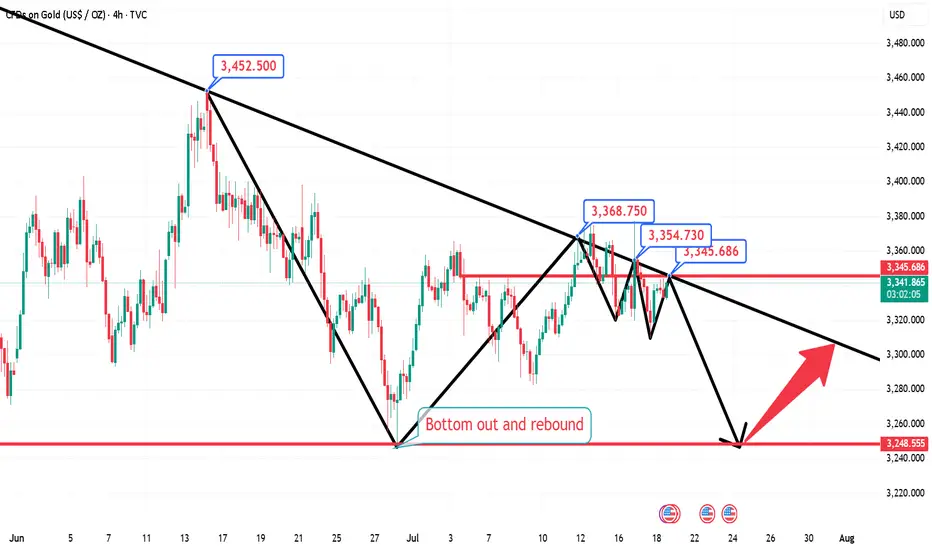
This week, the gold market is roughly a bottoming out and rebounding trend. We can clearly see from the recent candle chart that the recent trend line suppression is located near 3380, and this week gold has repeatedly encountered resistance and fallen in the 3375-3380 area, which has strengthened the suppression effect of resistance in this area to a certain extent; and gold has repeatedly tested the 3320-3310 area support during the retracement process. Gold has not fallen below the support of this area during multiple retracements, giving the market bulls great confidence.
On Friday, gold hit 3360 during the rebound and closed above 3350, which is strong in the short term. As gold continues to rebound, the current bull-bear dividing line is in the 3345-3335 area. If gold cannot even fall below the 3345-3335 area during the retracement next week, it will greatly boost buying power and is expected to hit the 3380 area again. Once gold breaks through the 3380 area during the rise, there will be a chance to further continue the rise and test 3400, or even the 3420 area.
Therefore, at the beginning of next week, if gold retreats to the 3345-3335 area for the first time, I think we must make an attempt to buy gold, first focusing on the target 3370-3380 area, and then bullish to the 3400-3420 area after a strong breakthrough.

Buy first when gold falls back, and pay attention to the strengtGold went on a roller coaster ride last week. It rose to around 3377 at the beginning of the week and then fell back under pressure. After stabilizing near 3309 on Thursday, it strengthened again on Friday and came under pressure near 3361. It fell back slightly to around 3344 at the opening in the morning and is currently rising again. In the morning, pay attention to the opportunity to buy first after the pullback, pay attention to the strength of the European session, and pay attention to the pressure near 3378/80 on the upside.
7.18 Gold intraday operation strategy, short-term short first stFrom the 4-hour analysis, the short-term support below continues to focus on around 3316-25, the short-term suppression above focuses on the 3340-45 line, and the key pressure above focuses on the 3380 line. The overall support of 3316-3345 range still maintains the main tone of high-altitude and low-multiple cycles. In the middle position, watch more and do less, be cautious in chasing orders, and wait patiently for key points to enter the market.
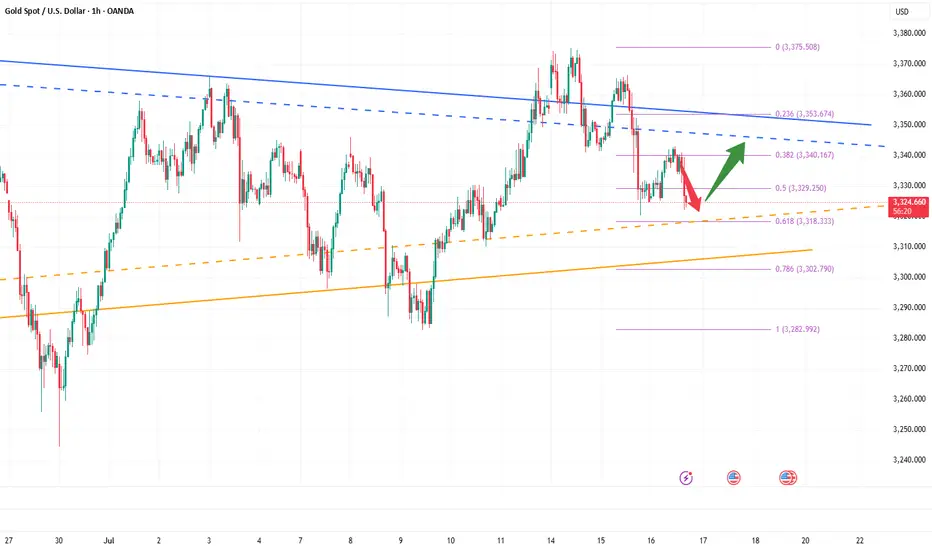
3340-3300: Lock in the buy high and sell low in this area!Under the influence of unemployment benefits and zero monthly sales data, gold fell sharply in the short term, but it did not effectively fall below 3310 during multiple tests, effectively curbing the further downward space of the shorts. Multiple structural supports are also concentrated in the 3310-3300 area, so as long as gold does not fall below this area, gold bulls still have the potential to rebound.
However, for the current gold market, it may be difficult to see a unilateral trend in the short term. After experiencing discontinuous surges and plunges, gold may focus on consolidation and repair, and the consolidation range may be limited to the 3340-3300 area.
So for short-term trading, first of all, I advocate going long on gold in the 3320-3310 area, and expect gold to rebound and reach the 3330-3340 area;
If gold reaches the 3335-3345 area as expected, we can start to consider shorting gold, and expect gold to step back to the 3320-3310 area during the shock and rectification process.
False breakout? Gold reverses sharply after news surgeBecause of the news that Trump hinted at firing Powell, gold surged strongly in the short term and passed to 3377, recovering the recent decline in one fell swoop. We went long on gold near 3323 in advance, and went long on gold near 3340 again after gold retreated, hitting TP: 3345 and 3355 respectively. The two long trades successfully made a profit of 370pips, with a profit of more than $18K.
Although gold has risen sharply in the short term and effectively destroyed the downward structure, it is mainly news that drives the market. After Trump denied firing Powell, gold rose fast and fell fast. So we can't chase long gold too much. First, the sustainability of the news-driven market needs to be examined, and second, the certainty of Trump's news is still unreliable. He always denies himself the next day.
After the gold price retreated quickly, a long upper shadow appeared in the candlestick chart, indicating that the upper resistance should not be underestimated. Therefore, we should not rush to buy gold. We can still consider shorting gold in the 3355-3365 area. We should first focus on the area around 3340. If gold falls below this area during the retreat, gold will return to the short trend and test the area around 3320 again, or even fall below this area after multiple tests and continue to the 3310-3300 area.

Analysis of 7.17 Gold Operation: Buy High and Sell LowYesterday, the trend of gold in the first half was quite regular. The rebound in the Japanese session was under pressure, and the European session continued to fall back to test the 3320 mark. The key here has been repeatedly emphasized yesterday. The gold market in the second half was more exciting. First, the news was released that Trump was ready to draft the dismissal of the Federal Reserve Chairman. Gold directly rose by 50 US dollars and broke through the recent high of 3375. Then he said that he had no intention of dismissing the Federal Reserve Chairman. Gold rushed up and fell back by 40 US dollars. The daily line finally closed with an inverted hammer pattern with a very long upper shadow line.
After the end of this pattern, today's market is still bearish. If the market is extremely weak, it will continue to fall below 3358. Pay attention to the attack and defense of the 3320 mark below. If it falls below, it will open the downward space to test the 3300 mark. During the day, we will temporarily set the small range of 3320-3358 to run, sell high and buy low, and retreat to 3325. One low long, defend yesterday's low, look up to 3335, 3342, 3358, and then reverse high.
7.17 Gold Short-Term Operation Technical Analysis!!!After a strong rise in the 1-hour gold price, it quickly fell back and closed with a long upper shadow line. The gold bulls did not successfully stabilize the market. This market is actually a venting of the news. The gold bulls are not very confident about rising again. The 1-hour gold moving average is still in a dead cross short pattern. So the gold rebound will continue to be short. The 1-hour gold pattern excludes the influence of the upper shadow line stimulated by yesterday's news. In fact, the whole rhythm is still fluctuating and falling. The upper shadow line is not long, and it is probably just a lure to buy more. After the ups and downs of gold last night, it rebounded again to the 3357 line or continued to fall under pressure. So gold will continue to rebound in the early trading and continue to be short at highs under the pressure of 3357.
3325–3315: Potential Bullish Reversal ZoneGold maintained a volatile trend today, but the highest intraday price only touched 3343. Overall, gold is still weak, but the bulls have not completely given up, and there is still a certain amount of energy, which limits the retracement space of gold. The current short-term support is in the 3325-3315 area. If gold cannot fall below this area in such a weak situation, the market may reach a consensus that 3325-3315 is the support area, thereby attracting a large amount of buying funds to flow into the gold market, thereby boosting gold to regain the bullish trend again and is expected to hit the 3350-3360 area.
So for short-term trading, I currently prefer to start long gold with the 3325-3315 area as support, first expecting gold to recover some of its lost ground and return to the 3350-3360 area!
Golden Support Holds — Bulls Poised for Another Leg Higher"If gold cannot break through the 3365-3375 area, gold will fall under pressure again, or refresh the recent low of 3341, and continue to the 3335-3325 area." Gold's performance today is completely in line with my expectations. Gold just retreated to a low of around 3320, but soon recovered above 3325, proving that there is strong buying support below.
From the current gold structure, the short-term support below is mainly concentrated in the 3320-3310 area. If gold slows down its downward momentum and its volatility converges when it approaches this area, then after the gold bearish sentiment is vented, a large amount of off-site wait-and-see funds will flow into the gold market to form strong buying support, thereby helping gold regain its bullish trend again, thereby starting a retaliatory rebound, or a technical repair rebound.
Therefore, for short-term trading, I still insist on trying to go long on gold in the 3330-3320 area, first expecting gold to recover some of its lost ground and return to the 3340-3350 area.