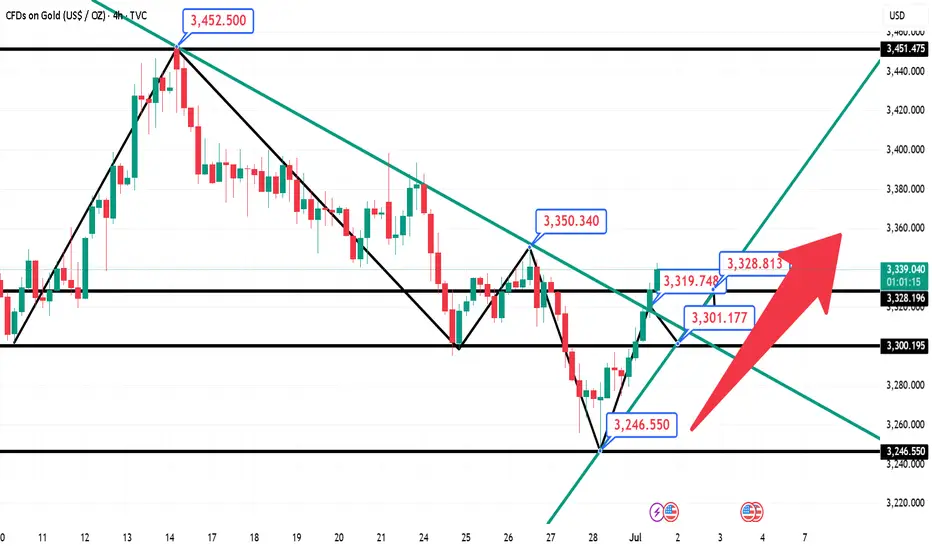
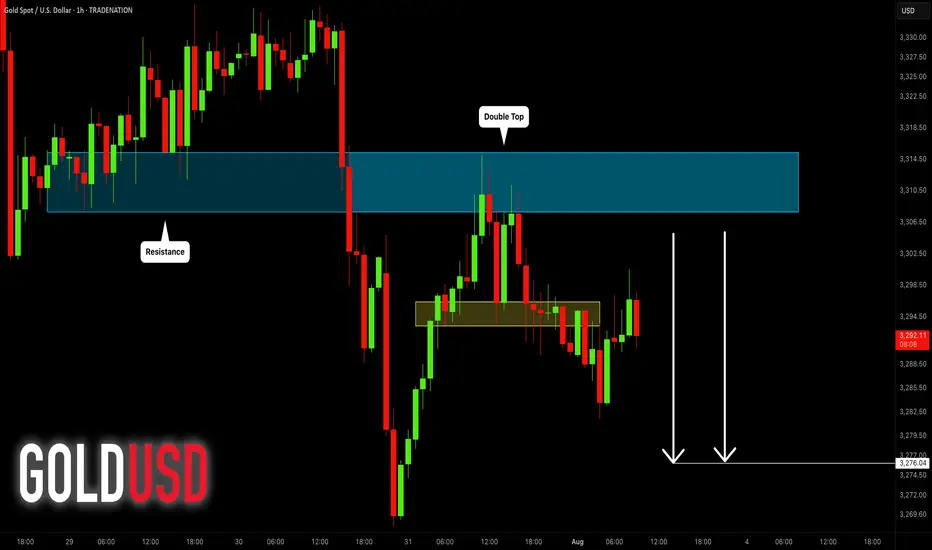
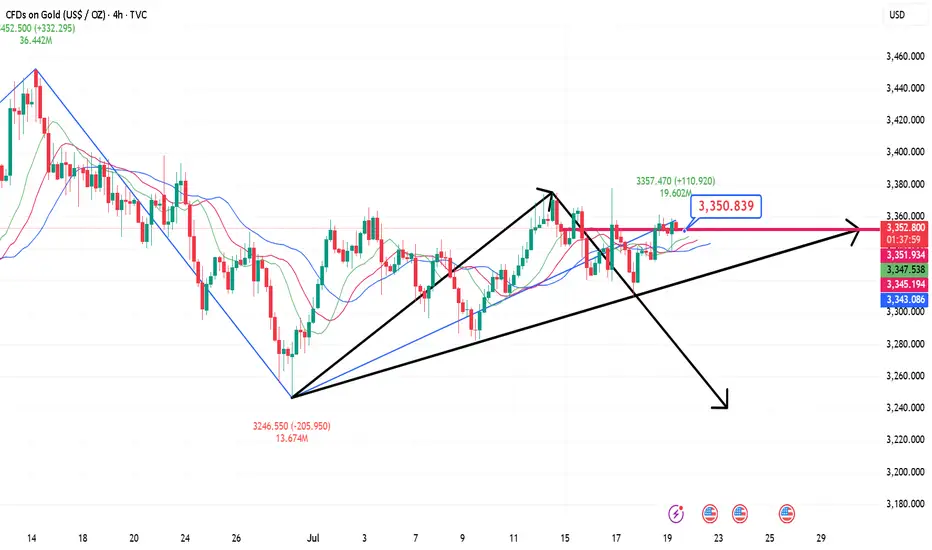
GOLD (XAUUSD): Bearish Continuation Ahead?!
Gold retested a recently broken significant liquidity cluster.
I see a clear sign of strength of the sellers after its test
with multiple intraday confirmation.
I think that the price will retrace to day to 3276 level.
❤️Please, support my work with like, thank you!❤️
I am part of Trade Nation's Influencer program and receive a monthly fee for using their TradingView charts in my analysis.
Goldtrader
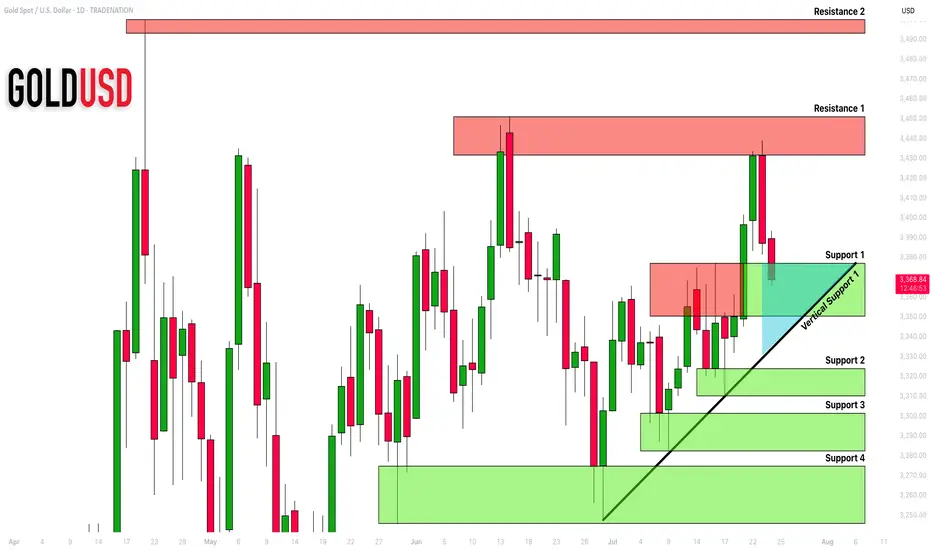
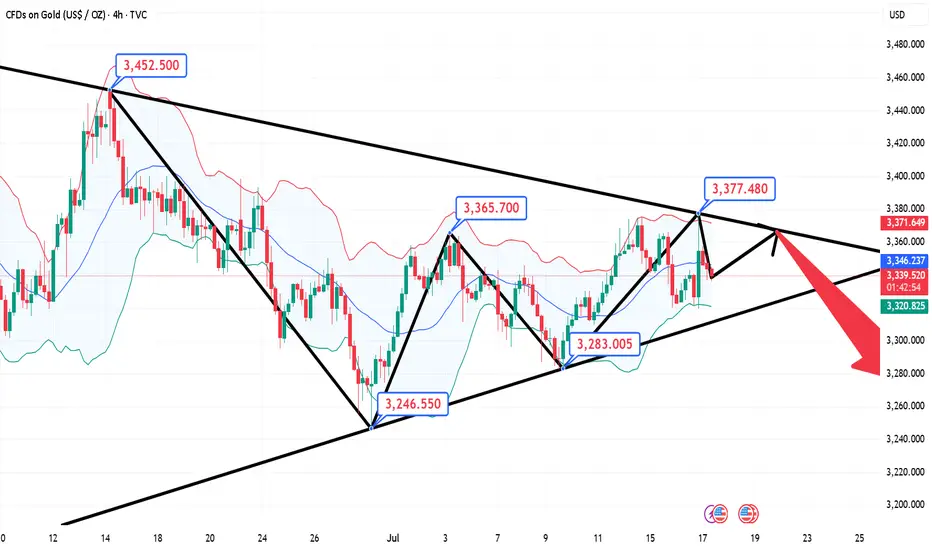
GOLD (XAUUSD): Important Demand Zone Ahead
Gold is currently retracing from a key daily horizontal resistance.
Here are important structures to watch.
Horizontal Structures
Support 1: 3350 - 3377 area
Support 2: 3310 - 3324 area
Support 3: 3282 - 3301 area
Support 4: 3245 - 3374 area
Resistance 1: 3431 - 3451 area
Resistance 2: 3493 - 3500 area
Vertical Structures
Vertical Support 1: rising trend line
Vertical and Horizontal Supports 1 compose a contracting demand zone.
Probabilities are high the price will pull back from that.
❤️Please, support my work with like, thank you!❤️
I am part of Trade Nation's Influencer program and receive a monthly fee for using their TradingView charts in my analysis.
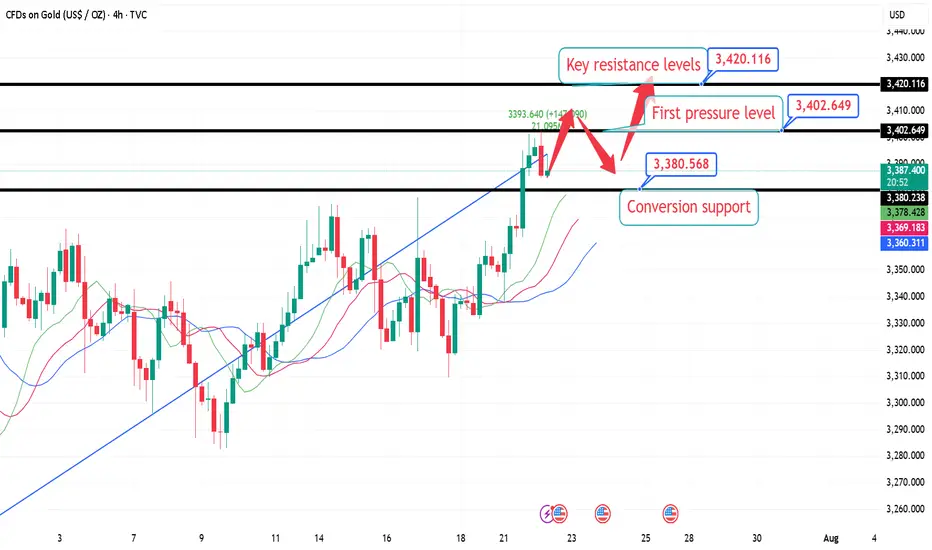
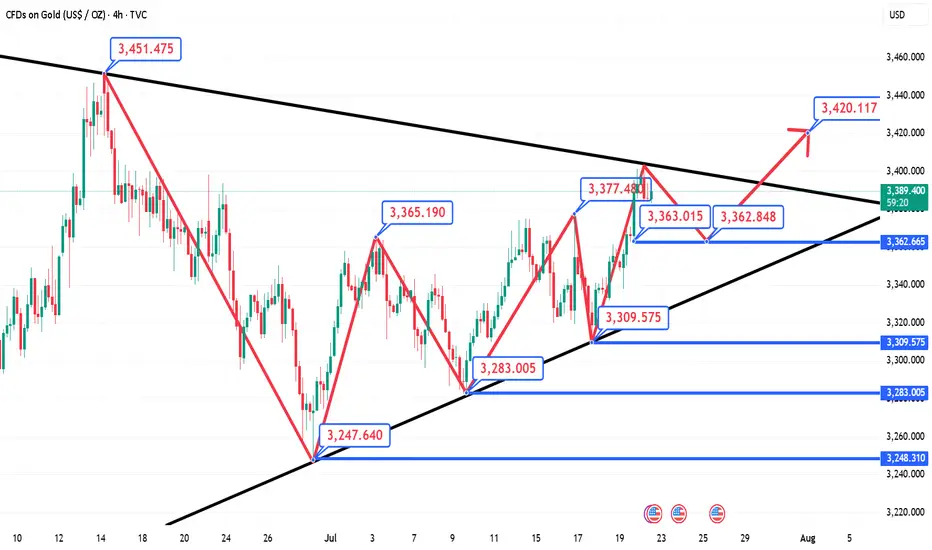
7.22 London Gold Market Analysis and Operation SuggestionsFrom the market perspective, the trend suppression line from the historical high of 3500 to the secondary high of 3452 has moved over time and is now around 3420, which can be used as an important resistance level reference for this week; the previous resistance level of 3376 can be converted into support after breaking through. For intraday short-term operations, focus on this range of callbacks and go long, wait for the key resistance level to be touched before going short, or see if there is an opportunity to arrange a mid-term short order based on the real-time trend.
Specific intraday operation ideas:
①. When the gold price falls back to around 3380, participate in long orders and call, protect the position of 3374, and first look at the position of 3402, the high point on Monday;
②. After yesterday's high point breaks, wait for a correction to around 3395 to continue to participate in long orders and call, protect the position of 3388, and look at the key suppression level of 3420;
③. (Aggressive orders, for those who are afraid of missing out) If you are short or have enough positions, you can first participate in long orders with a light position at the current price of 3388, and wait for 3380 to increase your position, and the target is the same as above.
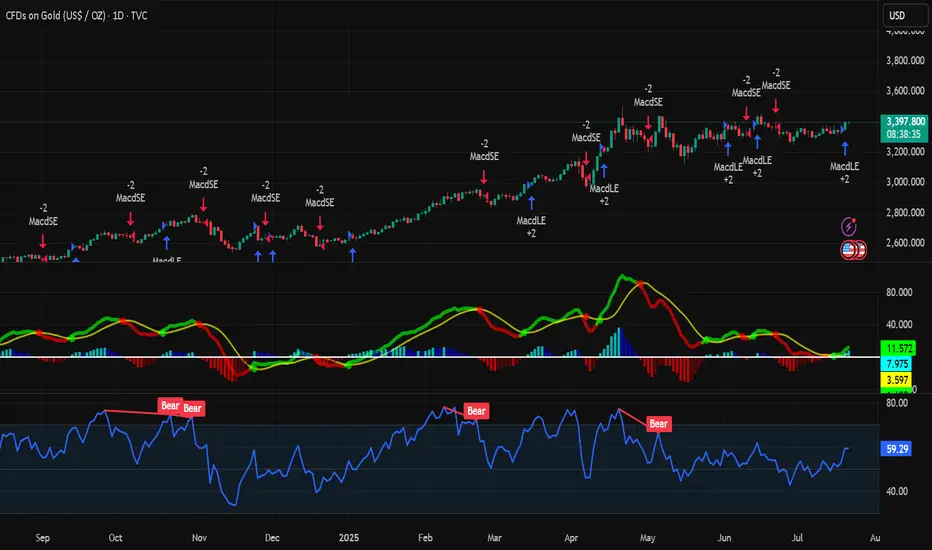
Analysis of short-term gold trading on July 22Technical aspects:
From the daily candlestick chart, gold has recently shown signs of breaking upward after five weeks of sideways fluctuations. In terms of MACD indicators, the MACD bar chart has turned from green to red, and the fast and slow lines have formed a "golden cross", strengthening the expectation of a short-term technical rebound.
At the same time, the 14-day RSI index rebounded to 57.67, still in the neutral and strong area, and has not yet entered the overbought area, indicating that the price still has room to rise. Analysis shows that the middle track of the Bollinger Band 3342 constitutes initial support, while the strong support below is at the two previous lows of 3247.87 and 3120.64.
If the bulls maintain their advantage above the integer position of 3400, they are expected to hit the high point of 3451.14 in the short term, and even further test the historical high of 3499.83; on the contrary, if they fall back below 3342, the short-term upward momentum will be tested.
Bull analysis:
If gold successfully stands above 3400, the market will turn its attention to the two key resistance areas of 3451 and 3499, the high point of the year. Breaking through the former will open up the space to test the historical high upward; combined with the current MACD golden cross pattern, if the capital side and the fundamentals continue to cooperate, it is not ruled out that there will be a short-term accelerated rise.
Bear analysis:
If the breakthrough fails, especially if gold falls back below the middle track of Bollinger, the adjustment pressure will be restarted, and the lower edge of the previous consolidation range of 3300 will constitute an important support. If it falls below again, it is necessary to pay attention to the important technical support near 3247 and the 100-day moving average of 3180.
7.22 Gold falls back and continues to be bullish, 3400 is not thFrom the 4-hour analysis, the short-term support below is 3370, the important support is 3350-55, and the upper resistance is 3400-05. The overall support during the day is to maintain the main tone of high-altitude and low-multiple cycles in this range. For the middle position, watch more and do less, be cautious in chasing orders, and wait patiently for key points to enter the market.
XAUUSD Analysis – Smart Money Perspective XAUUSD Analysis – Smart Money Perspective
🧠 Market Structure & BOS (Break of Structure):
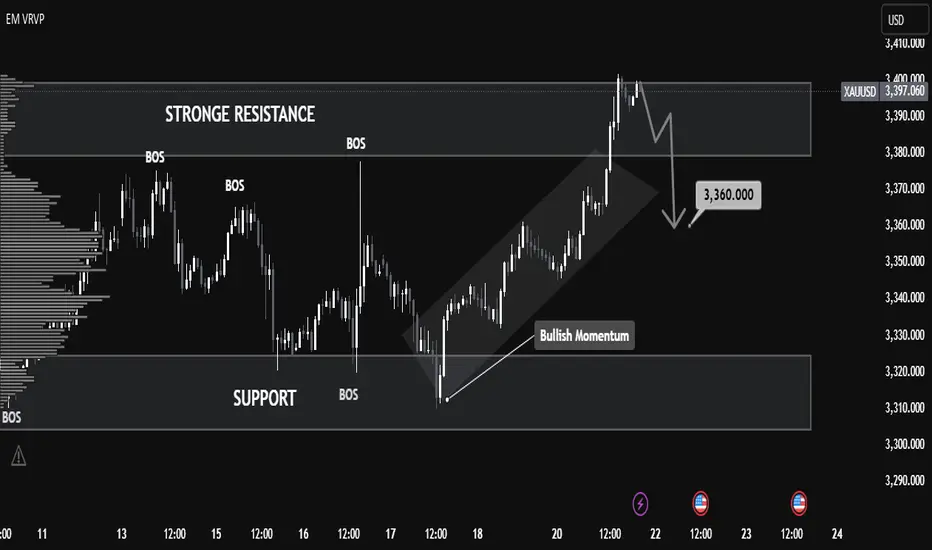
The chart clearly shows multiple Break of Structure (BOS), confirming bullish intent.
After the final BOS around 3,370, price aggressively broke above resistance, forming a new high at 3,397.
This indicates bullish market momentum backed by strong demand.
🔎 Key Zones Identified:
🔼 Strong Resistance (3,390 – 3,400 Zone)
This level has been tested and now shows potential exhaustion, possibly trapping late buyers.
Price currently rejecting this zone with a bearish reaction.
🔽 Support Zone (3,300 – 3,320)
Prior consolidation and BOS originate from here.
Strong bullish OB and demand lie here—key area for future long setups.
📉 Expected Short-Term Move:
The projection arrow indicates a potential retracement toward 3,360, a previous BOS + potential FVG area.
This aligns with Smart Money's tendency to rebalance inefficiencies before continuation.
🔺 Volume Analysis (VRVP - Volume Profile):
Notice how high volume nodes align with the support and resistance zones.
Price is currently sitting in a low-volume gap, supporting the idea of a retracement to a more balanced area.
⚡ Momentum Shift Signal:
The steep angle of the last move up suggests possible liquidity grab above resistance.
Expectation: Price may dip to mitigate demand or OB before resuming the uptrend.
✅ Conclusion:
This chart illustrates a textbook SMC scenario:
Bullish BOS confirms structure shift.
Liquidity sweep above resistance may lead to a retracement.
3,360 is a key price point to watch for FVG fills or bullish continuation.
Banana republic fears, gold tests $3,400Traders now price in a 60% chance of a Fed rate cut in September, as political pressure on the central bank intensifies.
Republican Rep. Anna Paulina Luna has officially accused Fed Chair Powell of perjury, while Treasury Secretary Scott Bessent has called for a full inquiry into the institution.
Earlier this month, former Fed Chair Janet Yellen told The New Yorker that these actions “...are the ones one expects from the head of a banana republic that is about to start printing money to fund fiscal deficits.”
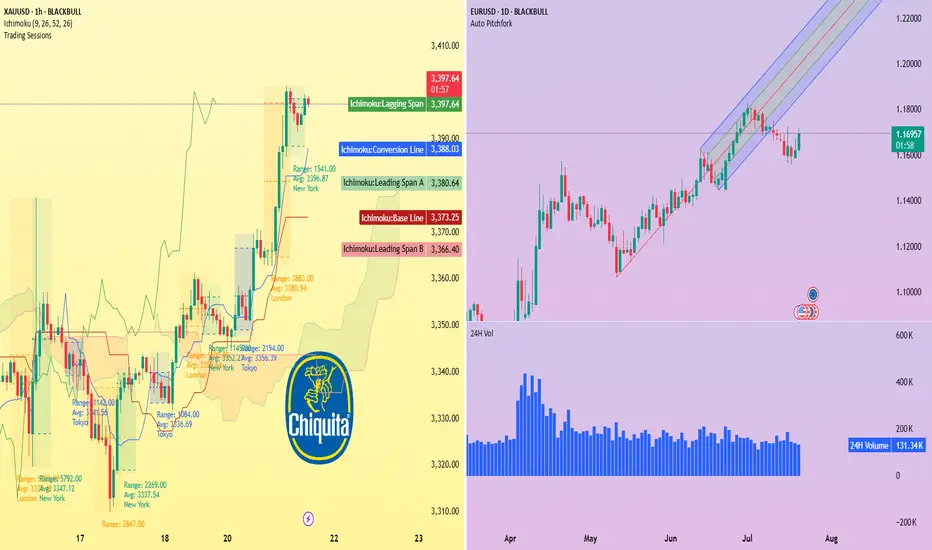
Amid this backdrop, gold surged past $3,390 per ounce. The 1-hour XAU/USD chart shows strong bullish momentum supported by the Ichimoku cloud: price is well above the cloud with a clean breakout and lagging span confirmation. Immediate resistance sits at $3,400, with a potential extension toward $3,440–$3,450 if bullish pressure holds.
Meanwhile, EUR/USD remains in an uptrend on the daily chart, bouncing from pitchfork support. A sustained move above 1.1700 could reopen the path toward 1.1800+.
Buy first when gold falls back, and pay attention to the strengtGold went on a roller coaster ride last week. It rose to around 3377 at the beginning of the week and then fell back under pressure. After stabilizing near 3309 on Thursday, it strengthened again on Friday and came under pressure near 3361. It fell back slightly to around 3344 at the opening in the morning and is currently rising again. In the morning, pay attention to the opportunity to buy first after the pullback, pay attention to the strength of the European session, and pay attention to the pressure near 3378/80 on the upside.
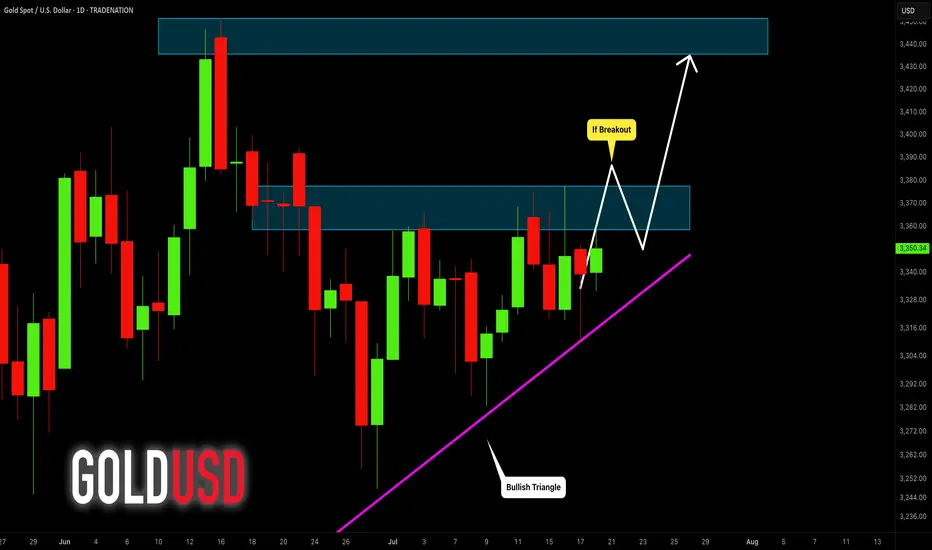
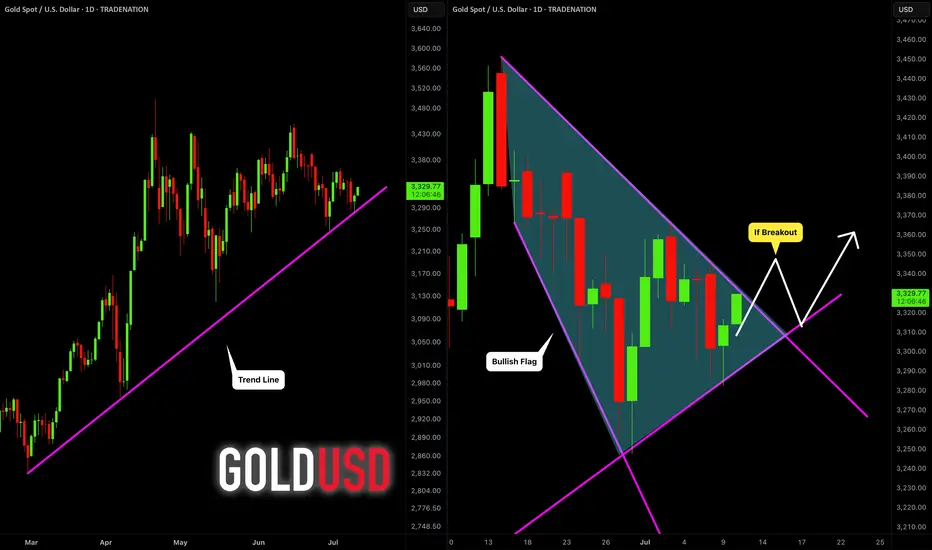
GOLD (XAUUSD): Sticking to the Plan
Update for my last Sunday's post for Gold.
Previously, we spotted a cup & handle pattern on a daily time frame.
It turned into an ascending triangle pattern - another bullish formation this week.
I am sticking to the same plan - our strong bullish signal is a breakout
of a neckline of the pattern and a daily candle close above 3378.
It will confirm a strong up movement.
❤️Please, support my work with like, thank you!❤️
I am part of Trade Nation's Influencer program and receive a monthly fee for using their TradingView charts in my analysis.
Analysis of 7.17 Gold Operation: Buy High and Sell LowYesterday, the trend of gold in the first half was quite regular. The rebound in the Japanese session was under pressure, and the European session continued to fall back to test the 3320 mark. The key here has been repeatedly emphasized yesterday. The gold market in the second half was more exciting. First, the news was released that Trump was ready to draft the dismissal of the Federal Reserve Chairman. Gold directly rose by 50 US dollars and broke through the recent high of 3375. Then he said that he had no intention of dismissing the Federal Reserve Chairman. Gold rushed up and fell back by 40 US dollars. The daily line finally closed with an inverted hammer pattern with a very long upper shadow line.
After the end of this pattern, today's market is still bearish. If the market is extremely weak, it will continue to fall below 3358. Pay attention to the attack and defense of the 3320 mark below. If it falls below, it will open the downward space to test the 3300 mark. During the day, we will temporarily set the small range of 3320-3358 to run, sell high and buy low, and retreat to 3325. One low long, defend yesterday's low, look up to 3335, 3342, 3358, and then reverse high.
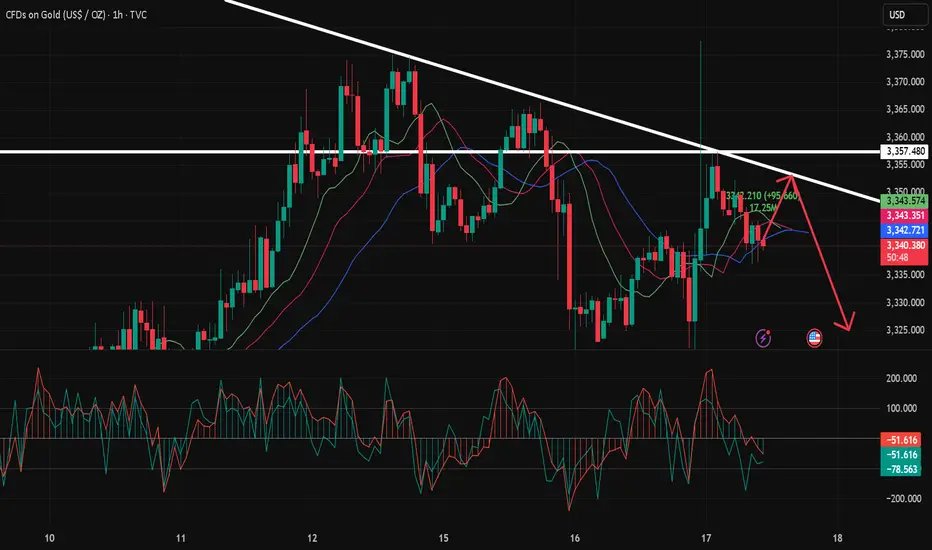
7.17 Gold Short-Term Operation Technical Analysis!!!After a strong rise in the 1-hour gold price, it quickly fell back and closed with a long upper shadow line. The gold bulls did not successfully stabilize the market. This market is actually a venting of the news. The gold bulls are not very confident about rising again. The 1-hour gold moving average is still in a dead cross short pattern. So the gold rebound will continue to be short. The 1-hour gold pattern excludes the influence of the upper shadow line stimulated by yesterday's news. In fact, the whole rhythm is still fluctuating and falling. The upper shadow line is not long, and it is probably just a lure to buy more. After the ups and downs of gold last night, it rebounded again to the 3357 line or continued to fall under pressure. So gold will continue to rebound in the early trading and continue to be short at highs under the pressure of 3357.
7.15 Gold Market Analysis and Operation SuggestionsFrom the 4-hour analysis, the short-term support below focuses on the neckline of the hourly line of last Friday, 3340-45, and focuses on the support of 3325-30. The intraday retracement continues to follow the trend and the main bullish trend remains unchanged. The short-term bullish strong dividing line focuses on the 3325 mark. The daily level stabilizes above this position and continues to follow the trend and bullish rhythm. Before falling below this position, continue to follow the trend and follow the trend. Maintain the main tone of participation.
Gold operation strategy:
1. Go long when gold falls back to 3340-45, and add more when it falls back to 3325-30, stop loss 3317, target 3365-70, and continue to hold if it breaks;
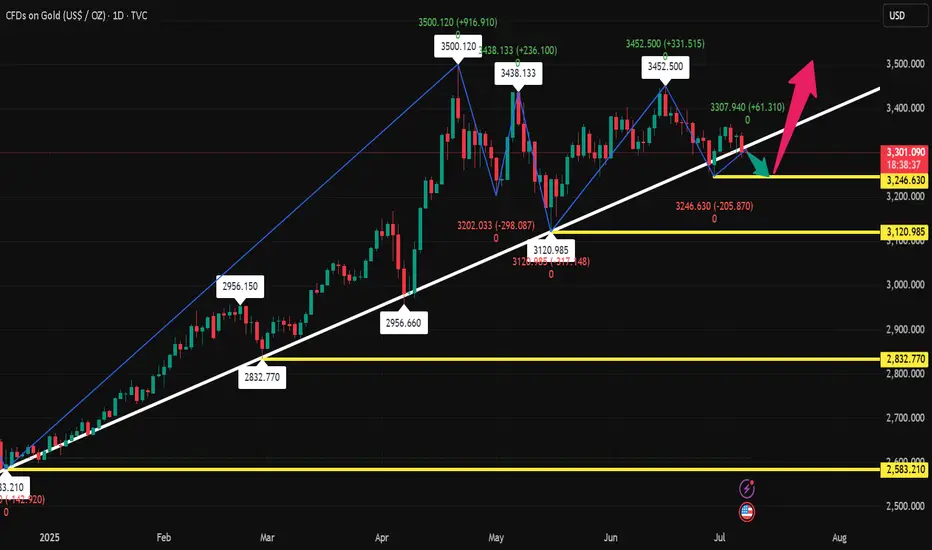
The 3400 mark will be the key for next week!Gold has been up and down this week, and the shock wash has intensified. It bottomed out and rebounded at 3282, and then steadily pulled up. After a slow rise to 3368 on Friday, the retracement was limited, and finally closed at 3355. So can gold be expected to be strong? Is it possible to reach 3400 next week? From the trend point of view, it is too early to say that it will turn strong. 3400 is an insurmountable barrier. Only by breaking through 3400 can we see a stable strong bull. If it is suppressed below 3400, the bulls will not be stable and may fall back at any time. We can only see large range fluctuations. From the overall trend point of view, gold is currently fluctuating widely in the large range of 3250-3400. It is safe to buy below 3300, and it is easy to go up. After all, it is still upward in the long run. Next week, we will focus on the gains and losses of the 3400 mark. It is not recommended to chase the high position directly on Monday. On the one hand, the interruption of the market after the weekend holiday can easily cause discontinuous rise. In addition, after three consecutive positive lines on the daily line, there will either be a negative correction and a fall, or a large positive volume. Combined with the current trend and rhythm of gold, be careful of a high-rise fall, and it is easy to get trapped by chasing long positions at high positions. Don't feel that it will soar as soon as it rises, and the high point of 3500 seems to be within reach; don't feel that it will fall sharply as soon as it falls, and the 3000 mark is not a dream. We should stay away from those who sing long when it rises and sing short when it falls. The direction is not because you see it, so you believe it, but because you believe it, so you see it. There will always be a time when you chase the rise and sell the fall and you will return with nothing.
Moreover, the high point of 3365 has not formed a substantial break and stabilized. On Monday, we still need to focus on the gains and losses of this position, so we need to look at it from two aspects:
1. If it rises directly at the opening, pay attention to the pressure near 3370-3380 and you can go short, and the target is 3350-3340!
2. If the market falls back at the opening, go long around 3340-3330, with the target above the high point of 3360-3368.
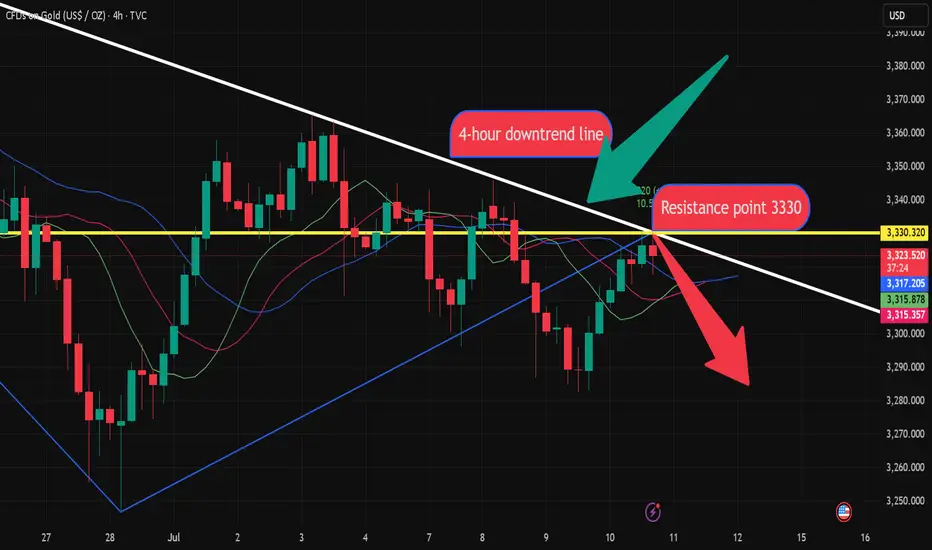
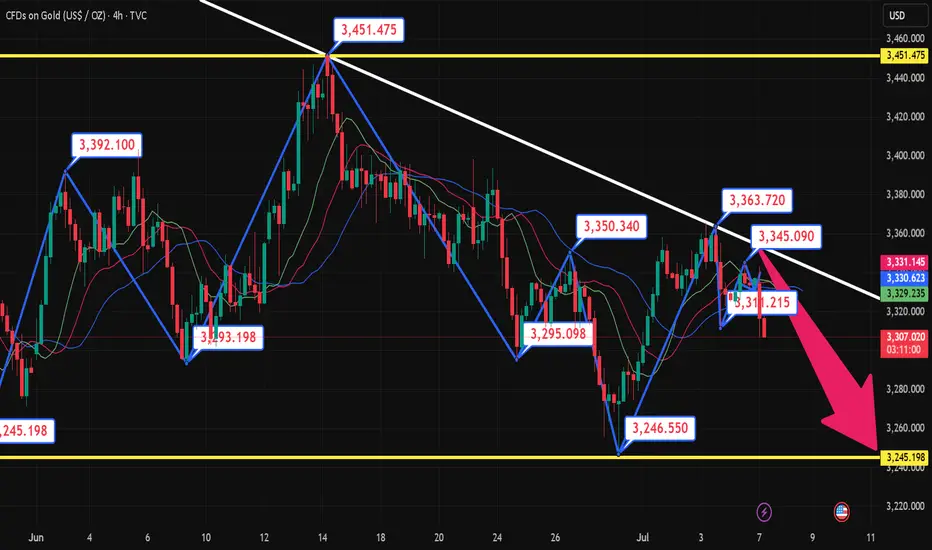
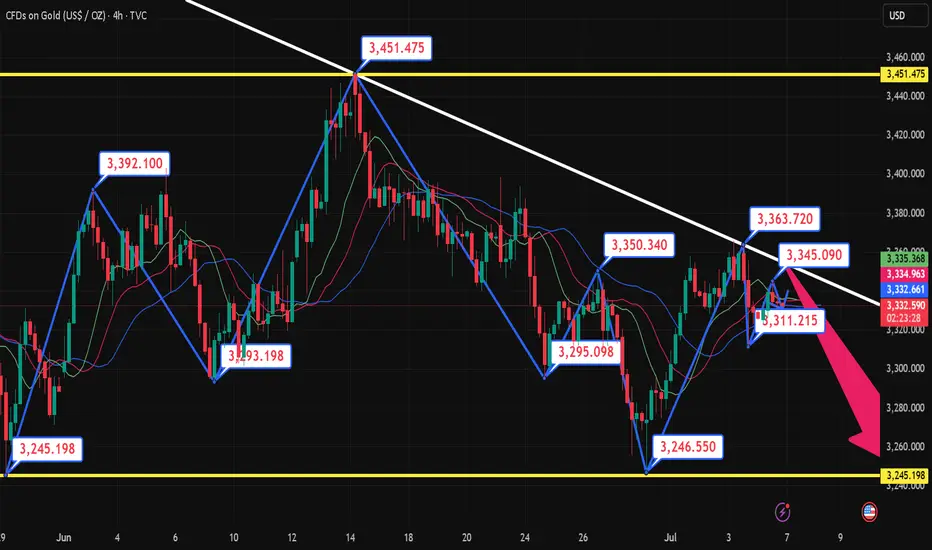
Gold 4-hour resistance point fluctuates, shorts comeOn Thursday (July 10), the 4-hour resistance point of gold price was formed before the US market. The logic of shorting at the resistance point can be considered. Spot gold maintained a strong trend in the European session, trading around $3,330. Although US President Trump's remarks on imposing a new round of tariffs on many countries triggered safe-haven demand, the FOMC meeting minutes showed differences in the path of interest rate cuts within the year, making gold bulls still cautious.
Spot gold continued to retreat after the previous high of $3,499.83, and has been blocked below $3,451.14 recently, forming a relatively obvious box consolidation structure. The current price is running below the middle track of the Bollinger Band at $3,343.69, indicating that the upward momentum of the bulls is weak. Analysts believe that the short-term key support level is at $3,250, which forms a resonance support with the previous low of $3,247.87. If it falls below, it may increase the downside risk.
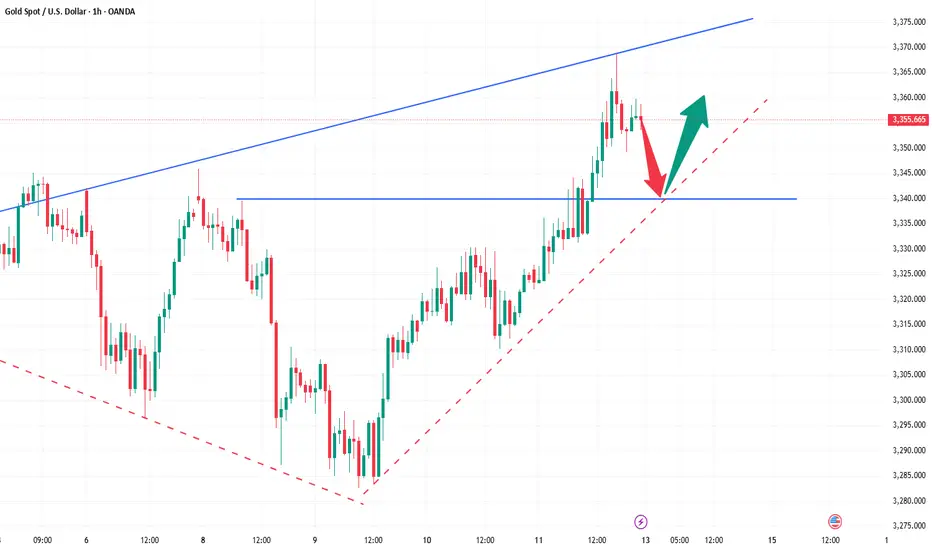
GOLD (XAUUSD): Important Decision Ahead
As I predicted, Gold went up from a trend line yesterday.
The price is now testing another trend line - a falling resistance
of a bullish flag pattern.
The next reliable bullish signal that you can look for is its
bullish breakout and a daily candle close above that.
A bullish move is going to follow then.
❤️Please, support my work with like, thank you!❤️
I am part of Trade Nation's Influencer program and receive a monthly fee for using their TradingView charts in my analysis.
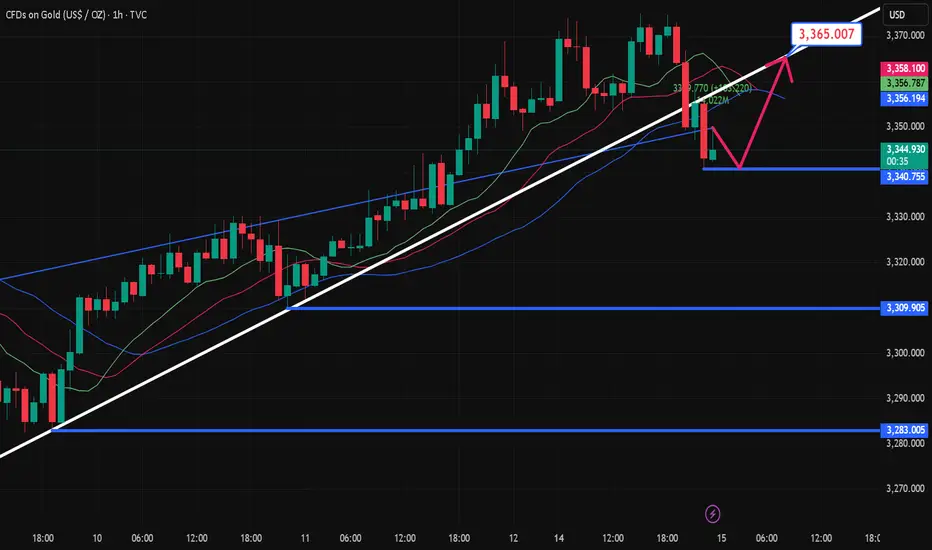
Gold's short-term decline is limited and will continue to riseWith the rise of gold in the US market yesterday, the trend line of the downward trend channel has been supported many times in the short cycle. After the rebound, we still need to pay attention to the suppression of 3328-30. This position is the suppression position of the 4-hour downward trend channel. If it breaks, the overall trend will be a rising flag, which may continue the upward trend. Of course, if it continues to not break through the suppression of 3328-30, it may fluctuate within the range. This requires further observation.
Intraday short-term suggestions: short-term long mainly, pay attention to the support of short-term long near 3307, stop loss 3297, take profit at 3328-30 suppression, break at 3348-50, pay attention to risks.
7.9 Gold long and short switches frequently!From the daily chart, the overall gold price is still in a weak position, the moving average is hooked, and the upper pressure is near the moving average 3319. Only if it breaks through and stands firm at this position during the day, can the bulls start to exert their strength. It happens that the MA10 position of H4 is also near 3319. At present, H4 is in a bearish trend, so the bullish pressure is still very large, but it rose in the early morning, and it bottomed out and rebounded. Combined with the recent non-continuation of the long and short trends, there is a high probability of rebounding during the day, so we can go long in the Asian session first, and go long directly at the current price of 3300, add positions to 3295, defend 3286, and look at 3312-19. The focus is still on the strength of the European session. If the European session is strong, continue to go long before the US session retreats; if the European session is weak, the US session will bottom out and rebound!
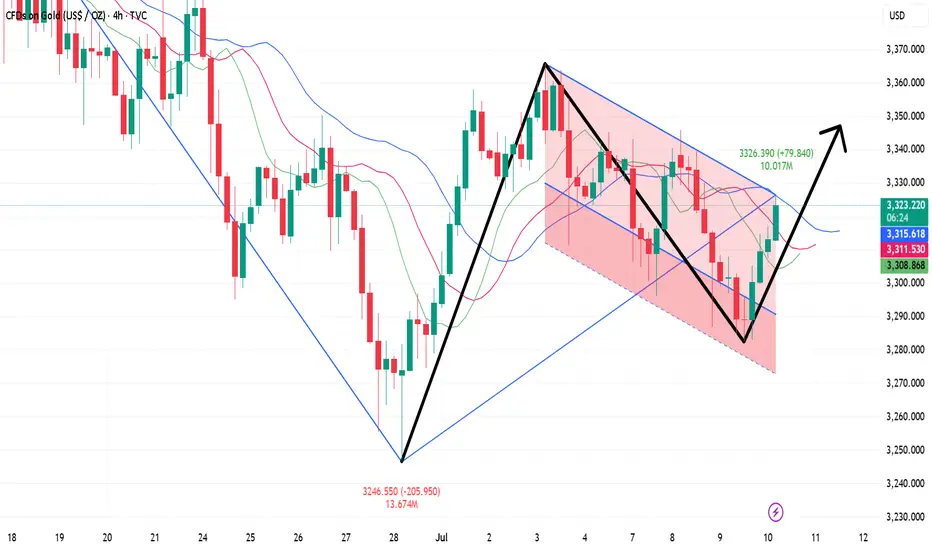
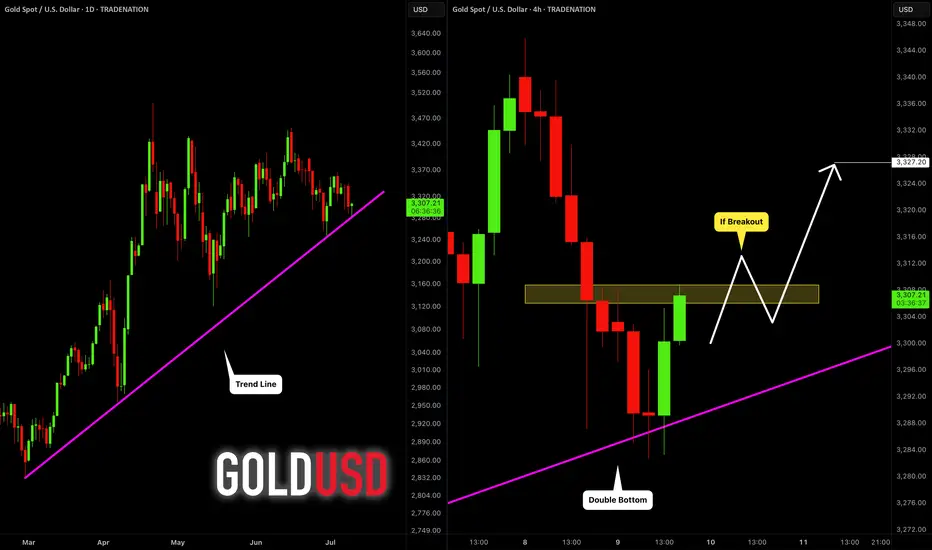
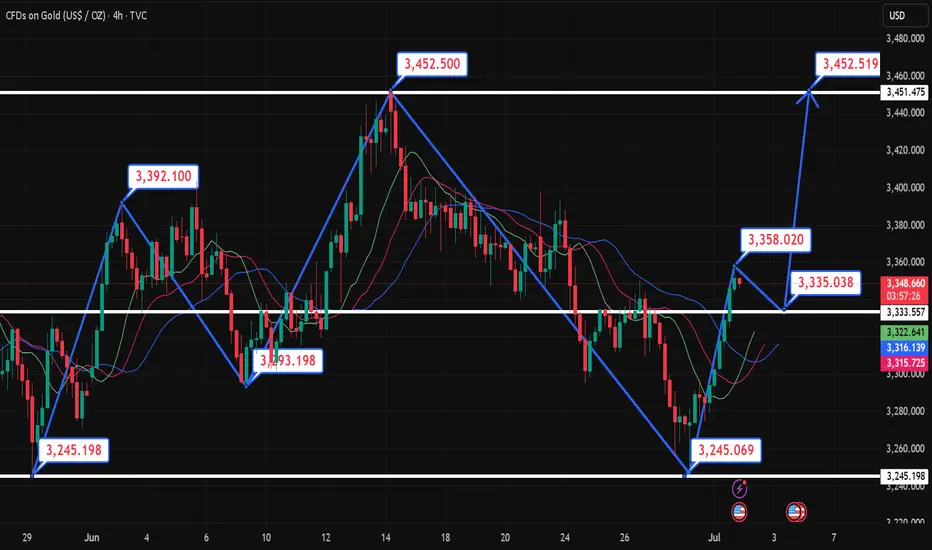
GOLD (XAUUSD): Time to Recover?!
Gold reached an important rising trend line on a daily.
I see 2 nice intraday bullish reactions to that on a 4H time frame
and a double bottom pattern formation.
Its neckline breakout and a 4H candle close above 3309
will confirm a start of a bullish correctional movement.
Goal will be 3327.
Alternatively, a bearish breakout of the trend line will push
the prices lower.
❤️Please, support my work with like, thank you!❤️
I am part of Trade Nation's Influencer program and receive a monthly fee for using their TradingView charts in my analysis.
Weekly range to be continued, gold short and long this weekLast week, gold opened high at 3280.9 at the beginning of the week and then fell back. The weekly low reached 3245.8, and then the market was strongly pulled up by the support of this round of trend line and fundamentals. On Thursday morning, the weekly high touched 3366, and then the market fell strongly under the strong influence of non-agricultural data. On Friday, the market consolidated in the range due to the holiday, and the weekly line finally closed at 3337.2. The weekly line closed with a medium-sized positive line with equal upper and lower shadows. After ending in this pattern, today's market continued to move in the range. In terms of points, the stop loss was still at 3346 after the short position at 3342 last Friday. Today, it first rose to 3342 and the short stop loss was still 3346. The target below is 3330 and 3322. If it falls below, the support of 3310 and 3300-3292 will be targeted.
Gold fluctuates near the resistance point, and the short positioSpot gold rose slightly in the European session on Friday (July 4), currently trading around $3,333/oz, up about 0.37%, and is expected to record a considerable increase of nearly 2% on a weekly basis. Behind this wave of gold price increases is the smooth passage of the massive tax cut and spending bill promoted by US President Trump in Congress, which has caused market concerns about the US fiscal situation. At the same time, the continued weakness of the US dollar index has further helped the rise in gold prices. As a traditional safe-haven asset, gold continues to be supported by bargain hunting.
Despite the continued rise in gold prices, physical gold demand in major Asian markets has been sluggish. Due to high prices, consumer purchasing interest has significantly weakened. In India in particular, the reduction in gold imports has led to a narrowing of the market discount. The weak demand in the Asian market is in sharp contrast to the risk aversion in the global financial market, highlighting the complexity of the current gold market. On the whole, fiscal concerns caused by the US tax cut bill, the weakening of the US dollar and the potential impact of Trump's tariff policy are jointly driving the upward trend of gold prices. The attractiveness of gold as a safe-haven asset is increasing, especially against the backdrop of increasing global economic uncertainty. In the future, as tariff policies are gradually implemented and the Federal Reserve's monetary policy becomes clearer, the gold market may have more opportunities to rise.
.
Why Gold Trading is Not Easy for Beginners - Trading PsychologyGold Doesn’t Just Teach Trading. It Teaches You Discipline.
1. Why Gold? Why Not Everything Else?
Gold is the most honest manipulator in the market.
It respects structure down to key intraday levels—but builds traps around it like a pro.
It fakes direction, sweeps liquidity, teases early entries, then moves beautifully for anyone patient enough to wait.
And it’s daily: one premium buy and one killer sell almost every day—hundreds of pips on the table for eyes that can see.
Other assets feel slow once you lock into Gold’s rhythm.
So what to expect:
2. The Phases Before Profit
• Lucky Dumb Money
Early wins boost your confidence. You increase your risk. It all feels easy—until the market proves otherwise.
• The Slap
Suddenly, things don’t work anymore. Indicators stop making sense. Emotions interfere. Results shift, and frustration creeps in. This is the breaking point for most traders. 6 months to 1 year on XAUUSD and they are out.
• The Awakening
This is when clarity begins. Indicators are dropped. Structure, liquidity, and timing take center stage.
What once looked random now starts to make sense.
Progress begins the moment YOUR EGO gets quiet.
Consistency only follows those who choose patience over panic.
3. Gold Is a Mirror
Gold doesn’t just reflect your trades — it reflects YOU.
Every personal flaw shows up on the chart: impatience, doubt, greed, fear, ego.
It mirrors your decisions, your reactions, your emotional patterns — all of it.
Blaming the market delays growth.
But the moment you turn inward, you begin to see the truth:
your results reflect your level of discipline, clarity, and self-awareness.
Gold forces you to evolve.
Not just as a trader, but as a thinker, a decision-maker, a human.
That’s why it’s not for everyone. Some people are not ready to recognize who they truly are yet.
4. What Leads to Profitability
What actually leads to profitability in Gold?
It’s fast. It’s full of adrenaline.
But you have to get a routine - consistent, structured, and effective — when applied with discipline.
→ One pair only. Mastery on XAUUSD
→ Structure first. Liquidity, imbalance, session timing
→ Fewer trades, cleaner entries
→ Smaller lots, more control = emotions are in check
→ Relentless observation. Learn from each execution and adjust with intention
This is what leads to results.
Not noise. Not hope. Just precision and presence — again and again.
5. You Won’t Win Until You Commit
You don’t need to destroy your schedule or stay up all night.
But you do need to make time for growth.
Signals won’t help if you’re not willing to understand the asset you’re trading.
Gold filters out shortcuts, distractions, and surface-level effort.
But those who take it seriously earn every pip — and they earn it with clarity, not luck.
So stop asking,
“How long until I’m profitable?”
Start asking,
“Am I ready to do what Gold actually demands?”
CONCLUSION:
Most traders don’t fail because Gold is too complicated—
they fail because they try to figure it out alone.
They chase signals, skip the process, and ignore the real path to consistency:
invest in education, proper mentorship, and trading psychology coaching.
The ones who grow fastest are those who seek guidance early—
from people who live and breathe this market, and understand structure, mindset, and pressure.
If you choose to go at it alone, that’s also a good choice.
Just know: it will take longer. It will test your patience and your clarity.
But when the structure clicks… when you stop chasing setups and start executing with confidence…
When you secure 3–4 solid trades a week and avoid unnecessary losses—
everything changes. Trading becomes calm. Focused. Even enjoyable.
Whichever path you take, the outcome depends on the same thing:
Gold won’t just test your trades.
It will develop your discipline.
If this lesson helped you today and brought you more clarity:
Drop a 🚀 and follow us✅ for more published ideas.

7.1 Technical guidance for short-term gold analysis!!!Gold hourly level: From the opening to now, it has been rising slowly with a small negative in the middle. It is all positive. This kind of pull-up pattern must not be tested for shorting. During the European session, it also broke through the upper rail resistance of the 3335 downward channel. There is a second pull-up in the US session; but it has not been able to step back, and even the 10-day moving average does not give a chance. If you want to step back and follow the long position, there is no chance for the time being, and going long directly seems more radical; conservative can wait patiently, be bullish, and don't go short; if it can be confirmed tonight that it is above 3335, you can try to follow the bullish trend, and the upper resistance target is 3374;
7.2 Gold bulls continue to rise, bears come to an end temporarilFrom the 4-hour analysis, the upper focus is on the 3345 line of suppression, the lower short-term support focuses on the 3314-3316 line, and the key support of 3295-3301 line is focused on. The overall support is based on this range to maintain the main tone of low-multiple participation. In the middle position, watch more and do less, be cautious in chasing orders, and wait patiently for key points to enter the market.
Gold operation strategy:
1. Gold 3316-24 line long, retrace to 3295-3303 line to add more positions, stop loss 3293, target 3340-45 line, continue to hold if broken;