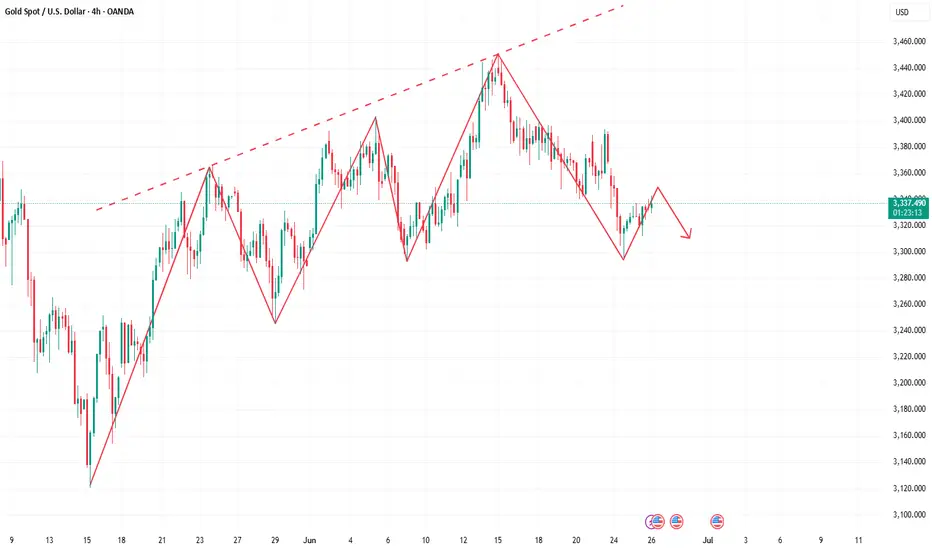
Gold rebound is blocked and high-altitude strategy continuesGold continued its bullish correction yesterday, reaching 3336 in the European session, and continued to retreat in the US session, reaching a low of around 3312 before temporarily stopping, and started a second pullback correction, and finally closed around 3332. Today, it opened at 3333, rebounded to 3340, and then entered a shock consolidation. Currently, the upper side focuses on the suppression of the 3342-3350 area. If the price cannot effectively break through and stand firm in this area, gold still has room for further retracement. In terms of operation, it will continue to rely on this suppression range to maintain a high-altitude thinking during the day, and follow the trend to see a decline. The recent market trends are basically the same, bottoming out and rebounding. In terms of strategy, keep a sense of rhythm and mainly short at highs.For more specific operation points, please pay attention to the notification at the bottom🌐.
Goldtrader
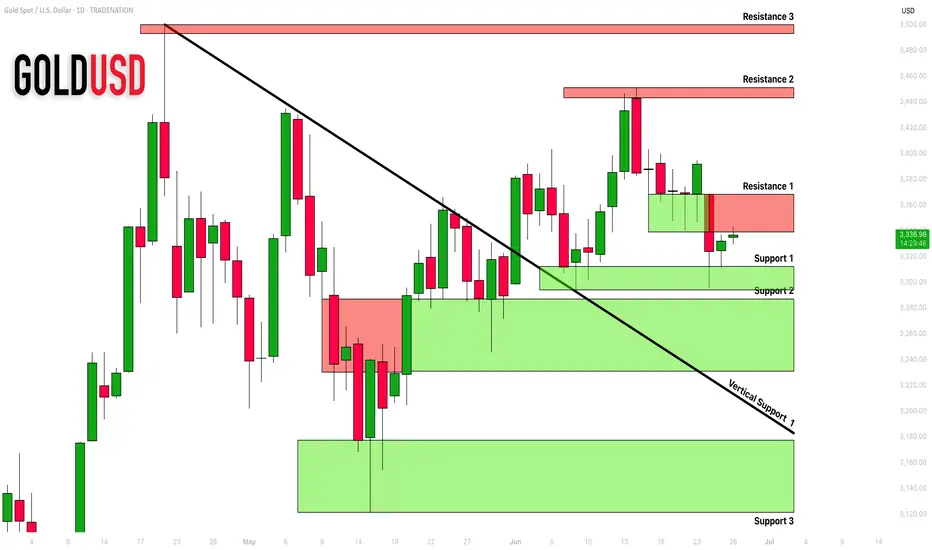
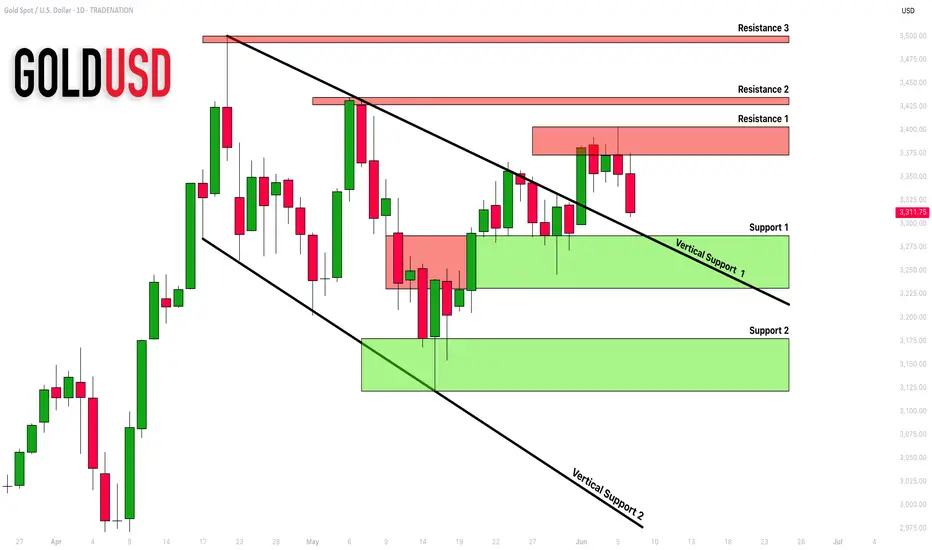
GOLD (XAUUSD): Updated Support & Resistance Analysis
Here is my latest support and resistance analysis for Gold.
Horizontal Structures
Support 1: 3294 - 3312 area
Support 2: 3231 - 3287 area
Support 3: 3121 - 3176 area
Resistance 1: 3338 - 3368 area
Resistance 2: 3441 - 3451 area
Resistance 3: 3493 - 3500 area
Vertical Structures
Vertical Support 1: Falling trend line
Consider these structures for pullback/breakout trading.
❤️Please, support my work with like, thank you!❤️
I am part of Trade Nation's Influencer program and receive a monthly fee for using their TradingView charts in my analysis.
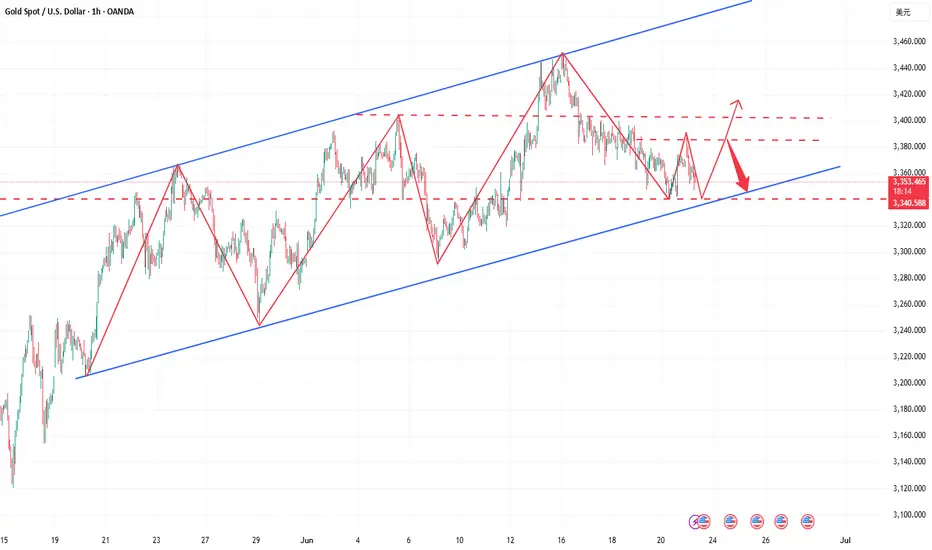
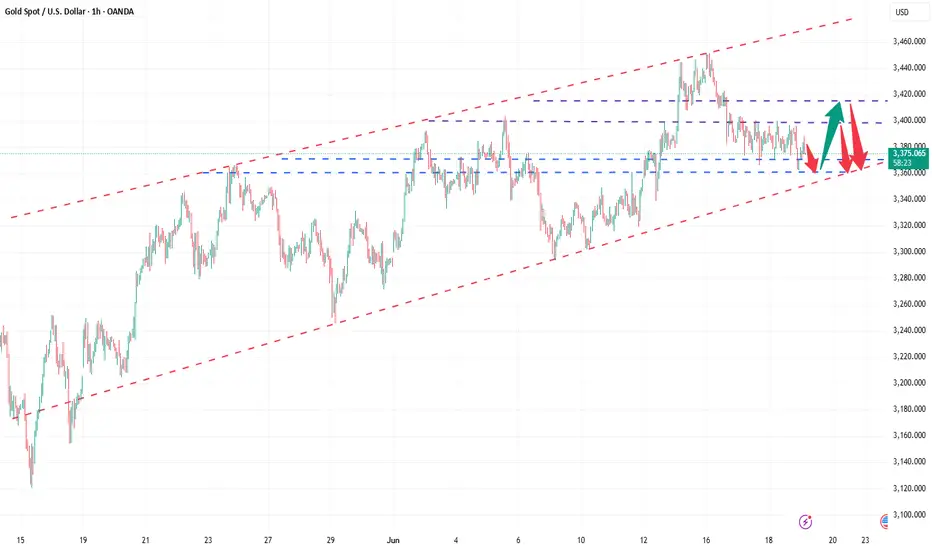
Follow the trend and go short, and buy when the price falls backAffected by the situation in the Middle East, gold opened higher and lower again on Monday, and the trend was exactly the same as last Monday. After the opening, gold fell back to the 3352-3355 line and fluctuated. We planned to arrange long orders near 3350, but gold went up directly and did not give an entry opportunity. During the rebound, gold was blocked and under pressure at the 3366 line, and at the same time, there were signs of stagflation at high levels. Combined with the short-term adjustment needs, the strategy was to arrange short orders near 3364 and successfully stop profit at the target of 3350. Then we went long at the 3348-3350 line, which is also the preset long entry area. The current target continues to focus on the 3370-3380 area. So far, although gold opened high and went low, the overall bullish trend channel has not been broken, and the retracement to long is still the current mainstream direction.The specific points are subject to the bottom 🌐 notification.
From the current trend, the support below focuses on the 3340-3345 area. Combined with the stimulus of the Middle East situation over the weekend, the short-term upper resistance focuses on the 3380-3385 area. The expectation of breakthrough is still there, and the focus is on the suppression performance of the 3400-3415 line. The overall strategy continues to rely on the idea of buying on pullbacks. Watch more and do less in the middle position, chase orders cautiously, and wait patiently for clear signals at key points before intervening.
Gold operation strategy: Gold retracement near the 3340-3350 line to do more, the target is 3370-3380.
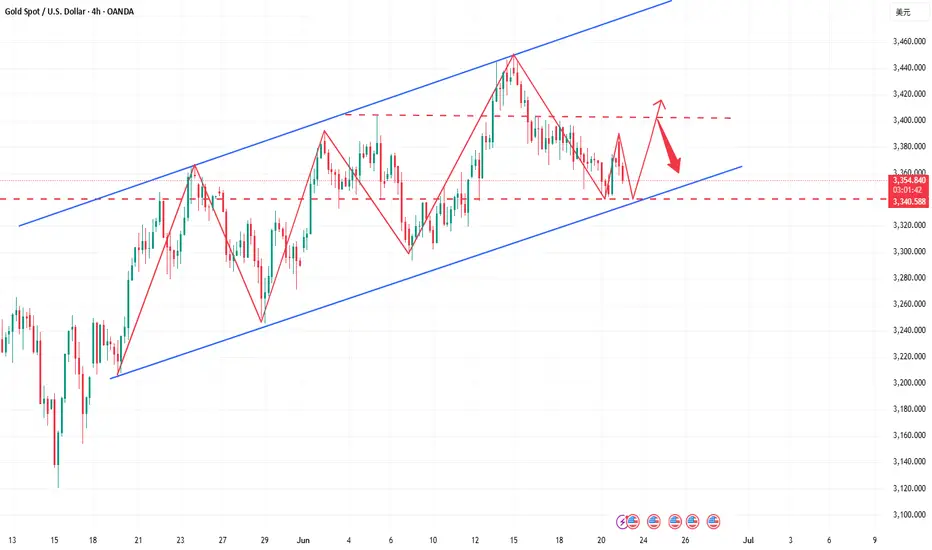
Gold bottomed out and rebounded, continue to go longAffected by the situation in the Middle East, gold opened high and fell again on Monday, just like last Monday. At present, it has fallen back to the 3352-3355 line and fluctuated. Although it is under short-term pressure, the bull channel has not been broken, and the retracement is still a long opportunity. The support below is 3340-3345, and the short-term resistance is 3380-3385. It is only a matter of time before it breaks through. The key suppression is still in the 3400-3415 area. In terms of strategy, continue to arrange long orders around the retracement, be cautious in chasing orders in the middle oscillation zone, and wait patiently for key position signals. The specific points are subject to the bottom 🌐 notification.
Gold suggestion: arrange long orders around 3340-3350, and the target is 3370-3380.
Wait for the key points to be confirmed before taking actionThe trend of gold on Friday is still in line with my analysis. Before the market opened, I suggested that gold would rebound from the bottom. Considering the resistance level, I would arrange short orders with a light position. I clearly emphasized that I should not chase short orders at low levels. The actual market price fluctuated upward after hitting the 3340 line at the lowest point, and maintained a range-bound fluctuation pattern as a whole. We arranged long orders in batches at 3342-3353, successfully stopped profit near 3358, reversed shorting, and stopped profit again at 3342. After that, the market hit the top again and was blocked. Short orders were arranged at 3370-3375. It is not recommended to hold positions over the weekend. I have already left the market with a small profit near 3365. Although there was no significant breakthrough, all ended with profit, but it was quite satisfactory for Friday's market.
News: Gold prices were stable on Friday, but fell 1.8% this week. It closed at 3368. The latest Federal Open Market Committee (FOMC) statement reinforced the Fed's cautious stance, keeping interest rates in the 4.25%-4.50% range. However, the statement also lowered the number of expected rate cuts this year, which put downward pressure on gold prices. In addition, U.S. Treasury yields did not change much but rose slightly, reflecting the stabilization of market risk sentiment. The 10-year Treasury yield rose by more than 2 basis points to 4.421%, and the 30-year Treasury yield rose to 4.924%. Rising yields often put pressure on non-yielding assets such as gold, further suppressing the upward momentum of gold prices. The Fed's failure to immediately launch an easing policy, coupled with a stronger dollar and a reduced urgency of geopolitical risks, have all exacerbated selling pressure. Unless tensions escalate again or the Fed unexpectedly turns, short-term gold price forecasts point to further weakening.
The price of gold has rebounded since it fell from its historical high of 3500 to 3120, After continuous rise, due to the decline of risk aversion in the market, it fell under pressure at 3452. It rebounded to 3340 on Friday. The K-line combination arrangement was bearish. The 4H chart showed a stop-loss signal. It is expected that the market will consolidate below 3400 in the short term. In the medium term, attention should be paid to the geopolitical crisis and the July interest rate decision of the Federal Reserve. It will break through the node after confirming the upper resistance of 3400. In the short-term 4-hour chart, the lower support is around 3340-3345, and the upper short-term resistance is around 3380-3385. Focus on the suppression of the 3400-05 line. The overall idea of retracing back to long positions remains unchanged, and the middle area is mainly kept on the sidelines. Be cautious in chasing orders and wait patiently for the key points to be confirmed before intervening. If the upper resistance is not broken, you can still consider light positions to arrange short orders, and pay attention to the bottom for the specific entry point.
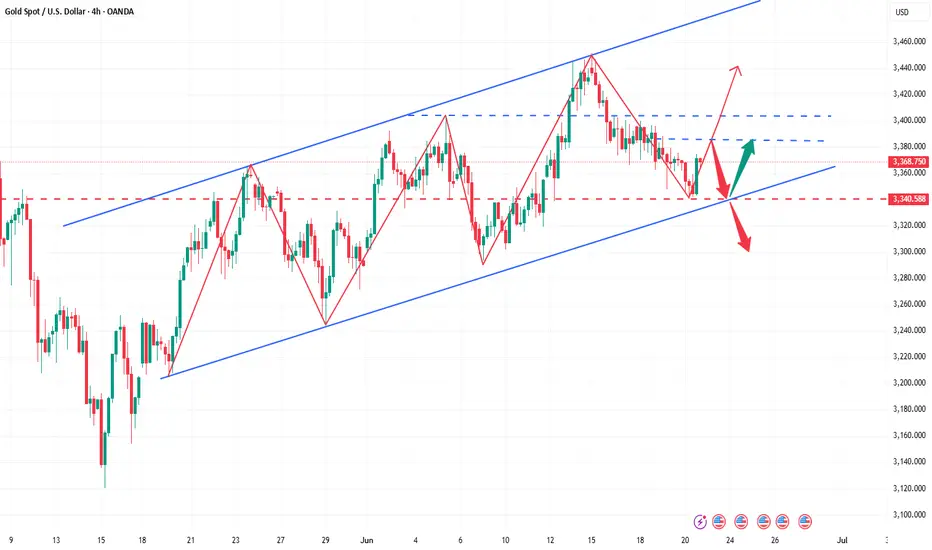
Range oscillation, strategy remains unchanged!The Federal Reserve kept the interest rate unchanged. Gold did not break through the range we gave after all. The important support below is still at 3365-3360. Today, we continue to operate in the range and keep high and low as yesterday. Gold touched the lowest level of 3362 without breaking through, and still rebounded. The long orders of 3372 and 3363 that we arranged have successfully stopped profit at 3380, so we continue to operate in the range.
From the current analysis of gold trend, gold continues to focus on the important support of 3365-3360 below, and focuses on the short-term suppression of 3400-3415 above in the short term. The operation is mainly carried out in the range for the time being, and there is a high probability of continued volatility in the short term.
Gold operation strategy: Go long when gold falls back to 3375-3370, and cover long positions when it falls back to 3365-3360, with the target of 3380-3390-3400.
Adjustments do not change the trend, continue to be bullishToday, gold opened high at 3448, and fell under pressure after reaching 3452. After repeatedly confirming resistance at high levels, it went down. We arranged short orders in the 3445-3450 area, successfully reached the target of 3330, and secured profits. Then the market fell back to around 3409 and stabilized and rebounded. We arranged long orders to stop profit near 3420. The current market is still in a bullish trend after the shock and retracement. Adjustment does not change the trend. Retracement is an opportunity. The key is to find the right entry point.
From a technical perspective, the support below focuses on the 3410-3405 area, and the key support is at 3400-3390. If the daily level stabilizes in the above area, the upward structure will continue, and the short-term is still expected to test the previous high. Short orders need to strictly control risks, and the trend of low and long is still the main theme.
Gold operation strategy: Buy gold when it falls back to around 3410-3405, and consider covering positions when it falls back to 3400-3395, with the target at 3430-3440.
For more real-time strategies, I will remind you at the key points as soon as possible,🌐 remember to pay attention!
If you still lack direction in gold trading, you might as well try to follow my pace. The strategy is open and transparent, and the execution logic is clear and definite, which may bring new breakthroughs to your trading. The real value does not rely on verbal promises, but is verified by the market and time.
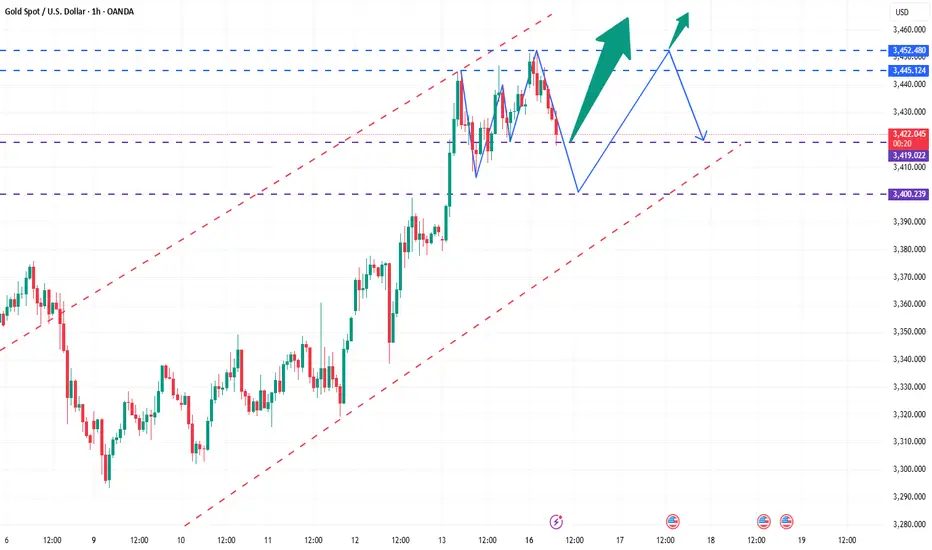
Short positions fall as expected, long opportunities reappearToday, gold maintained high and fluctuated repeatedly after opening, but the upper side has not been effectively broken through. After repeated pressure, the resistance signal was confirmed. We arranged short orders near 3445. The market fell back as expected and accurately hit the target position. The trend was highly consistent with the prediction, which once again confirmed the trading concept of "planning before the market, execution before emotion".
From the current trend structure, gold is still in a bullish trend as a whole, and short-term adjustments are normal. The support below focuses on the 3420-3415 area, which is the first defense position for short-term retracement; and the more critical bullish defense line is still at the 3405-3400 line. If this area stabilizes, it is still our core layout area for low-multiples with the trend.
The daily structure is still intact, and the long arrangement of the moving average system has not been destroyed. Short-term fluctuations do not affect the overall bullish logic. Therefore, the operation is still based on retracement and main longs, and following the trend is the kingly way. Short orders can only be participated in the short term, and stop when you reach the point, and do not hold against the trend. I will remind you of the specific operation strategy at the bottom, and pay attention to it in time. The key next is to pay attention to the stabilization signals below and wait for the market to provide new opportunities for momentum release.
If you still lack direction in gold trading, you might as well try to follow my pace. The strategy is open and transparent, and the execution logic is clear and definite, which may bring new breakthroughs to your trading. The real value does not rely on verbal promises, but is verified by the market and time. 🌐
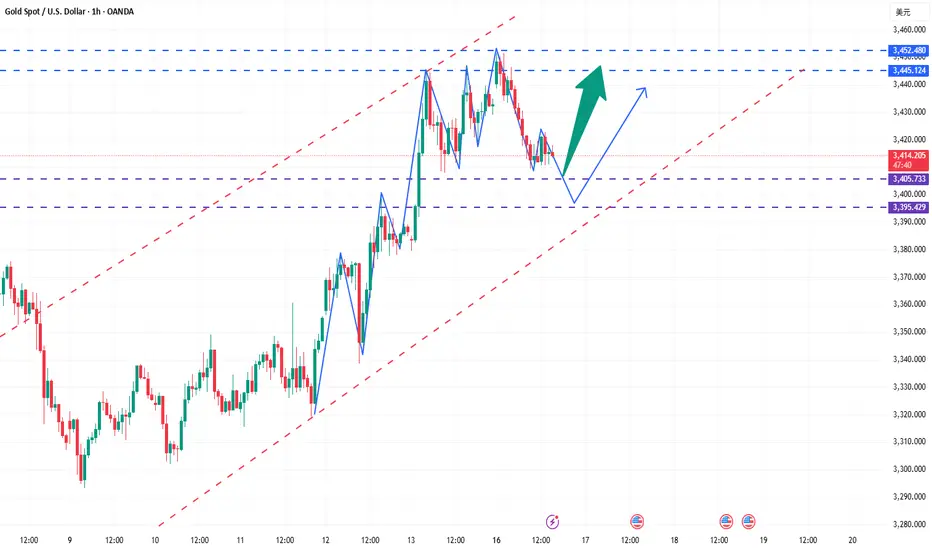
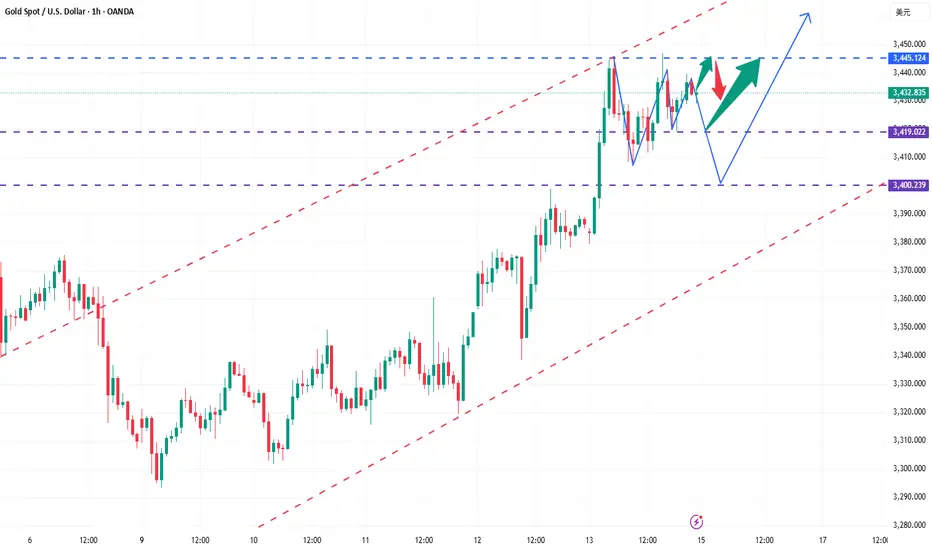
The golden opportunity comes again.This week, gold showed a slow bullish upward pattern, rising repeatedly and circuitously, and finally closed positive on the weekly line. On Friday, it was blocked twice at the high level of 3445, and the closing price remained sideways. The market is expected to continue the upward trend next week. If it breaks through 3445, it is expected to further challenge the 3500 mark or even set a new high. Combined with the recent fundamentals and the continued warming of the geopolitical situation, it provides solid support for bulls. However, the current market shock sweep is still the main rhythm, and it is not advisable to blindly chase highs in operation. It is still recommended to focus on retracement and long positions. The key support of the daily line refers to the top and bottom conversion position of 3403 and the low point of 3419 on Friday. If it falls back to the above area, you can rely on the support to arrange long positions at the right time. The overall trend is still inclined to bulls, and short positions can only be tried with a light position. Remember that strict risk control is required against the trend. I will remind you of the specific operation strategy at the bottom, and pay attention to it in time.
Operation suggestion: Gold is recommended to go long near 3405-3400, with the target looking at 3445 and 3465. If it is strong, rely on the support of 3420-3415 area and choose the opportunity to go long.
If you still lack direction in gold trading, you might as well try to follow my pace. The strategy is open and transparent, and the execution logic is clear and definite, which may bring new breakthroughs to your trading. The real value does not rely on verbal promises, but is verified by the market and time. 🌐
GOLD (XAUUSD): Support & Resistance Analysis For Next Week
Here is my latest structure analysis and
important supports & resistances for GOLD XAUUSD
for next week.
Consider these structures for pullback/breakout trading.
❤️Please, support my work with like, thank you!❤️
I am part of Trade Nation's Influencer program and receive a monthly fee for using their TradingView charts in my analysis.
Hit the target with one strike! Gold perfectly cashed in 3435Gold closed sideways at a high level yesterday, and closed positive again overnight. It opened back to 3379 and pulled up strongly, breaking through the 3400 mark and then increasing in volume. The recent low-multiple bullish ideas have been realized. There is no doubt that it will continue to be bullish and long today. The market has turned from the previous sweeping upward to a strong unilateral trend. The upper side will first look at the previous high pressure of 3435. Continued breakthrough will further open up the upper space, or it will hit 3500 or even a new high again. The lower support focuses on the top and bottom conversion position of 3395-3405, and then pay attention to the 1H cycle support near 3410. The intraday operation is mainly long on the decline.
Operation suggestion: Go long on gold when it falls back to 3395-3345, and look at 3434 and 3450. If it is strong, continue to go long with the support of 3415-3410.
When operating, be sure to strictly set stop loss, strictly control risks, and respond to market fluctuations steadily.
Accurately capture golden trading opportunitiesBased on the current trend, it is recommended to focus on low-long operations, but be wary of the market repeating the pattern of the previous few days of high-rush, wash-out and fall. From the perspective of key points, 3360 has been converted from a previous resistance level to a support level. At the same time, the hourly line forms an important support near 3358. If there is a stabilization signal at this position, it can be regarded as a good opportunity to go long. However, if the market falls below the 3356 line, it is not ruled out that the price will further fall to around 3345. This position is the key long-short watershed during the day. Once it is lost, the short-selling force may increase; in extreme cases, if there is a deep wash-out, the gold price may even pull back to 3325. For the upper resistance, pay attention to 3395-3405 first. If it can break strongly, it can further look to 3414.
Based on the above analysis, the trading strategy is as follows:
If gold falls back to the area near 3345-3355 and does not break, you can consider arranging long orders;
When the price rises to the area near 3395-3405 and does not break, you can try to arrange short orders.
When operating, be sure to strictly set stop losses and control risks.
Today's market trend is completely in line with the predicted rhythm, with a clear shock structure and flexible response around key points. With precise layout based on two-way thinking, we can achieve a double kill of long and short positions and a steady harvest. If your current gold operation is not ideal, and we hope to help you avoid detours in your investment, please feel free to communicate with us!
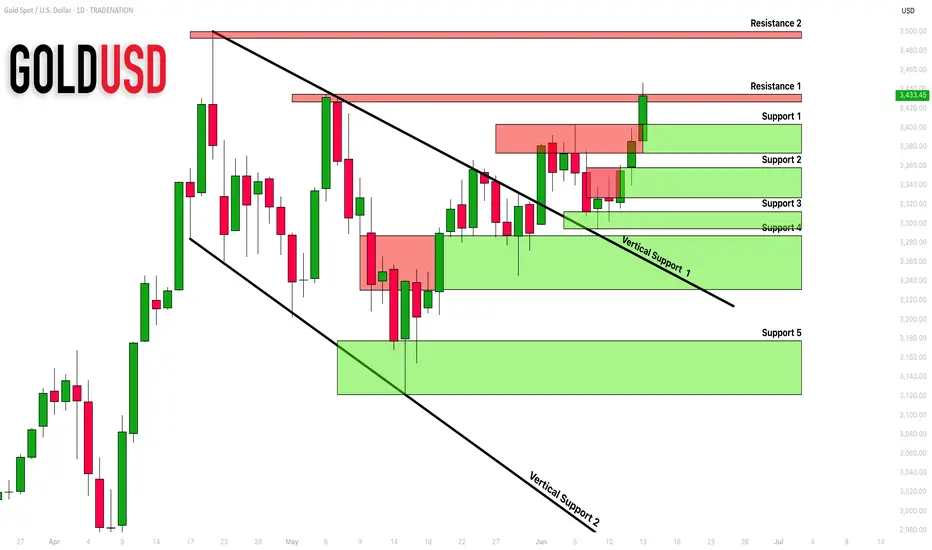
GOLD (XAUUSD): Important Supports & Resistances for Next Week
Here is my latest structure analysis for Gold.
Vertical Structures
Vertical Support 1: Falling trend line
Vertical Support 2: Falling trend line
Horizontal Structures
Horizontal Support 1: 3231 - 3286 area
Horizontal Support 2: 3121 - 3177 area
Horizontal Resistance 1: 3372 - 3404 area
Horizontal Resistance 2: 3427 - 3423 area
Horizontal Resistance 3: 3492 - 3500 area
Consider these structures for pullback/breakout trading.
❤️Please, support my work with like, thank you!❤️
I am part of Trade Nation's Influencer program and receive a monthly fee for using their TradingView charts in my analysis.
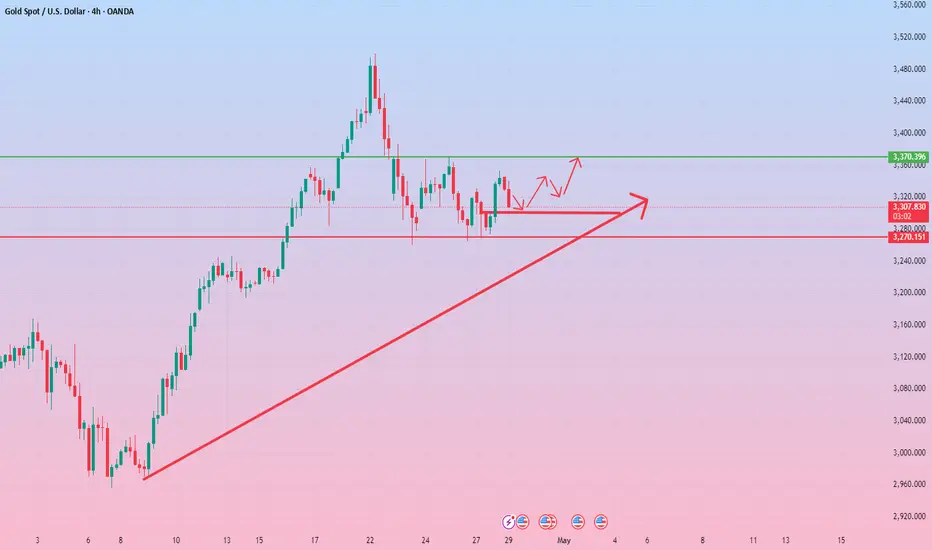
Ascending triangle on gold: $3,280 or $3,560 next? Gold has climbed following softer-than-expected US economic data, which has strengthened speculation for at least two Federal Reserve rate cuts this year. ADP employment figures showed just 37K new jobs, well below the 111K forecast.
President Donald Trump, posting on Truth Social, called on “too slow” Fed Chair Jerome Powell to cut rates immediately.
The repeated tests of the $3,400 level suggest that selling pressure at this zone could be weakening. Lower interest rates tend to support gold prices, as the metal offers no yield. However, a daily close below the recent swing low of $3,280 would undermine the pattern.

GOLD (XAUUSD): Detailed Daily Time Frame Analysis
Gold is officially in correction now.
Analysing a price action on a daily time frame,
we can see a valid bullish flag pattern.
A minor trend that we see within the boundaries of the flag
reflects a global overbought state of the market.
The upper boundary of the flag is a strong vertical resistance
that concentrates a selling interest.
An accurate signal of a resumption of a bullish trend will be
a breakout and a candle close above that.
A bullish wave will be expected at least to 3420 then.
Remember that we can not predict how long the market will
keep trading within the flag. Also, the market may easily
drop lower within that, updating the low.
If a correction continues below the low of a flag pole,
that may signify a global bearish reversal.
Of course, from a current geopolitical and economic perspective
it is a low-probability scenario.
❤️Please, support my work with like, thank you!❤️

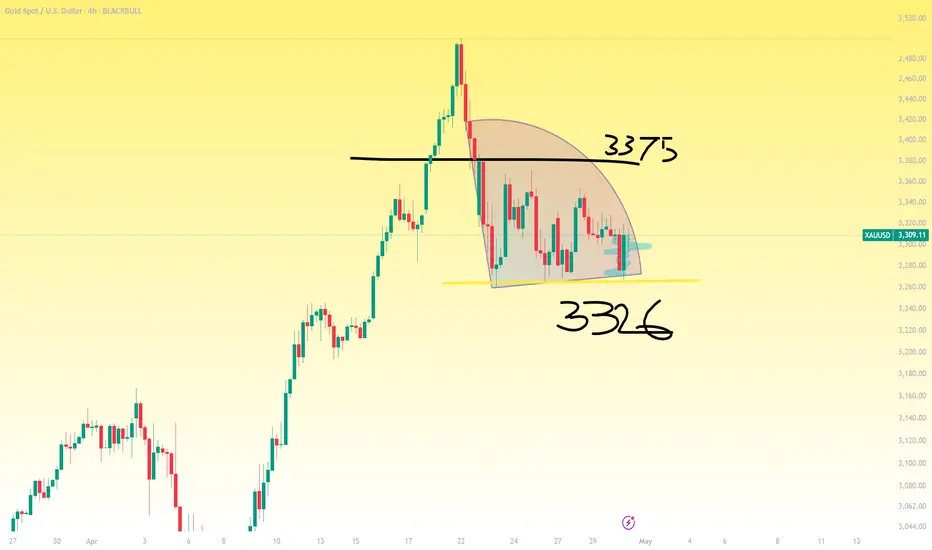
Gold at $3,260: Buy the Fourth Dip?Gold prices have stabilized today after experiencing an earlier decline that represents the fourth dip down to the $3260 level over the past few sessions. The repeated defense of this support level could indicate strong buyer interest at these prices.
Recent reports suggest an easing of trade tensions which might be weakening demand for gold. But have tensions really eased to any great extent? Commerce Sectary Howard Lutnick announced yesterday the U.S. is close to 1 trade agreement with 1 mystery trade partner (rumored to be India? But why not brag about that if true) isn't the kind of progress that consoles me.
But is it time to buy?
The consistent support at $3,260 coupled with a potential move above $3,375 could provide the technical confirmation needed for renewed confidence in this kind of trade.
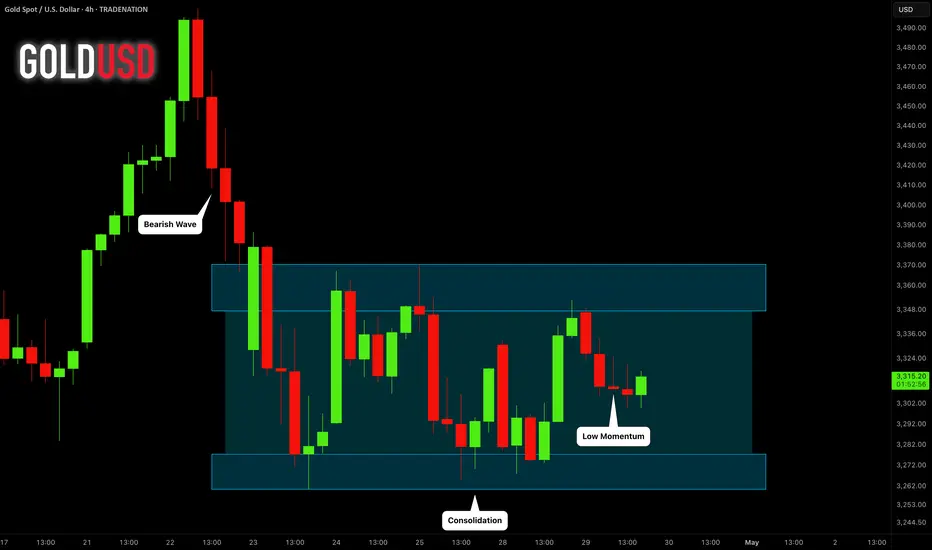
GOLD (XAUUSD): Market Outlook & Short Update
Regarding Gold.
I received multiple requests to provide the update after
the price bounced to a target level, as I predicted earlier on Sunday.
At the moment, we see a perfect example of a consolidation.
The price is trading within a horizontal parallel channel - range.
As always, the market will most likely continue staying within that till the release
of important high impact news.
The closest ones we can find in the economic calendar.
Tomorrow we are expecting US GDP and Personal Spending Data.
For now, probabilities will be high that a consolidation will continue.
Consider looking for trading opportunities from the boundaries of the range.
After a news release, a breakout of the range will provide a strong confirmation
and accurately indicate the future direction of the market.
❤️Please, support my work with like, thank you!❤️
I am part of Trade Nation's Influencer program and receive a monthly fee for using their TradingView charts in my analysis.
Doubletop suppressionVS multi-bottom support Entry at key pointsGold rose sharply in the U.S. market yesterday, and the daily line finally closed the Yang cross star, approaching the end of the monthly line. Recently, it has been a yin-yang cycle sweep pattern. Therefore, today we need to be careful to prevent the market from falling back and then closing in the negative range. The wide sweeping range remains at 3370-3270. If the position is broken, look at the unilateral direction. In the 4H cycle, the continuous positive pattern breaks through the mid-track, and the short-term trend is stronger. , but Bollinger has not opened his mouth, and is not optimistic about the breakthrough range. The short-term support is around 3315, which is also yesterday's low point. If it falls below, it will go to 3302. Therefore, today's operation will continue to grasp the key positions. The upper pressure will focus on 3354 and 3370, and the lower support will focus on 3315 and 3300. Go high and low in the range! Do high-altitude and low-multiple in the range!
Operation suggestion: Buy gold near 3305-3300, look at 3320 and 3345!
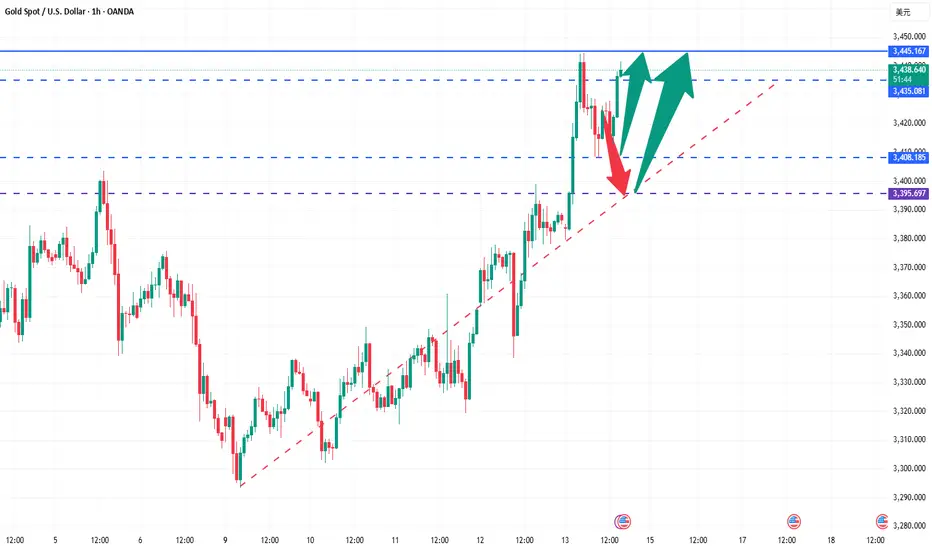
GOLD (XAUUSD): Very Bullish Setup
Gold closed on Friday in a strong bullish mood.
The price started to rise after a test of the underlined blue
support cluster.
A breakout of a resistance line of a falling channel on an hourly
provides a strong intraday confirmation.
I expect a rise at least to 3439
❤️Please, support my work with like, thank you!❤️
I am part of Trade Nation's Influencer program and receive a monthly fee for using their TradingView charts in my analysis.
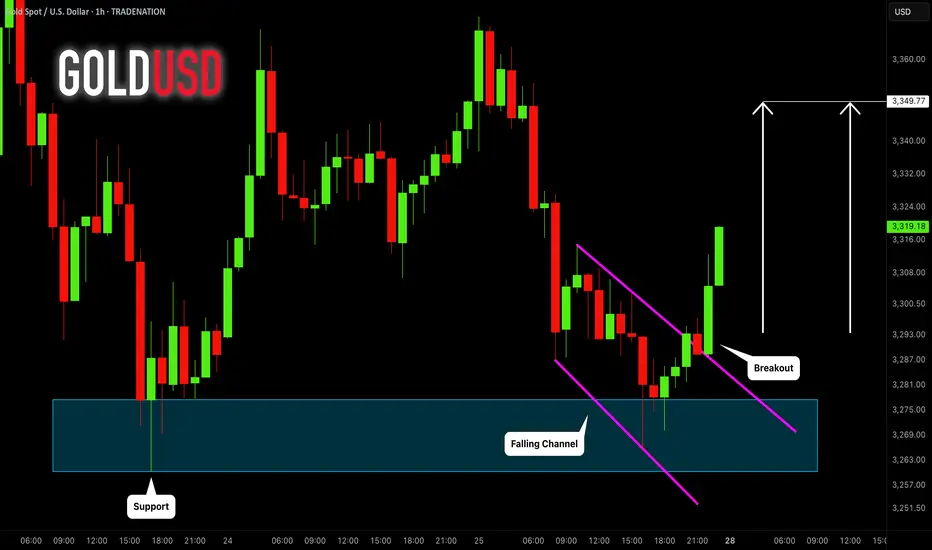
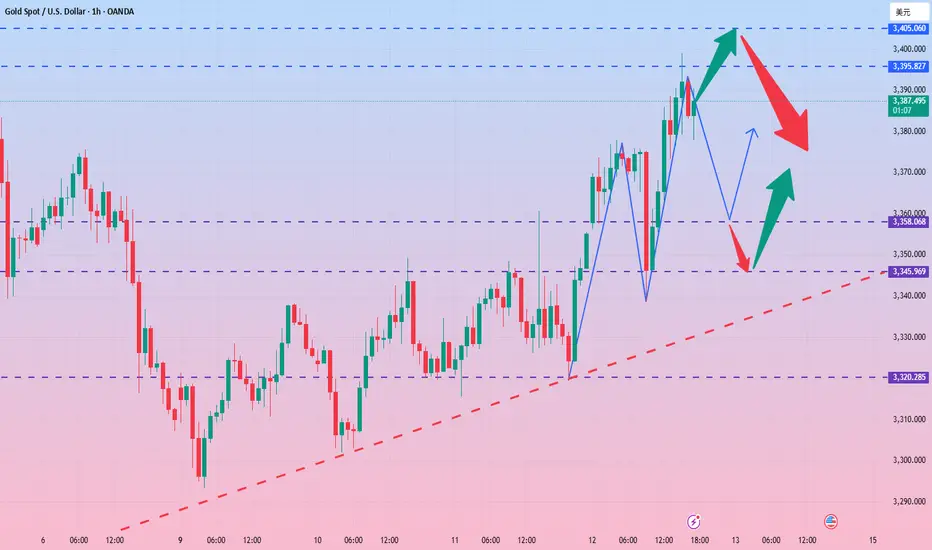
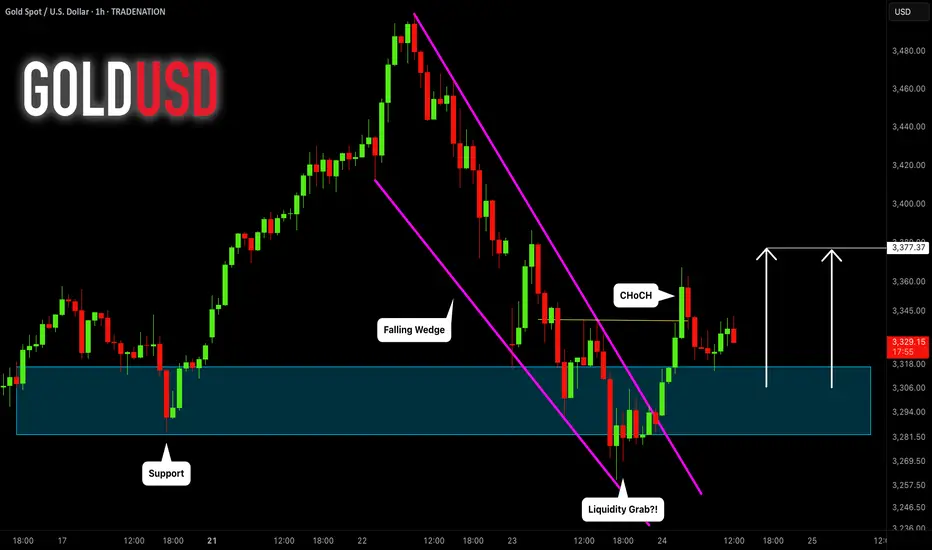
GOLD (XAUUSD): Strong Bullish Signs?!
Gold strongly corrected from 3500 psychological level.
After a test of the underlined intraday support cluster,
the market started to leave strong bullish clues.
After a false violation of the support, the price accumulated a bit
and broke a resistance line of a falling wedge pattern on an hourly time frame.
With that move, Gold also managed to confirm a local Change of Character CHoCH.
All these bullish signals indicate a highly probable continuation of a growth.
The price may move up at least to 3377 level easily.
❤️Please, support my work with like, thank you!❤️
I am part of Trade Nation's Influencer program and receive a monthly fee for using their TradingView charts in my analysis.
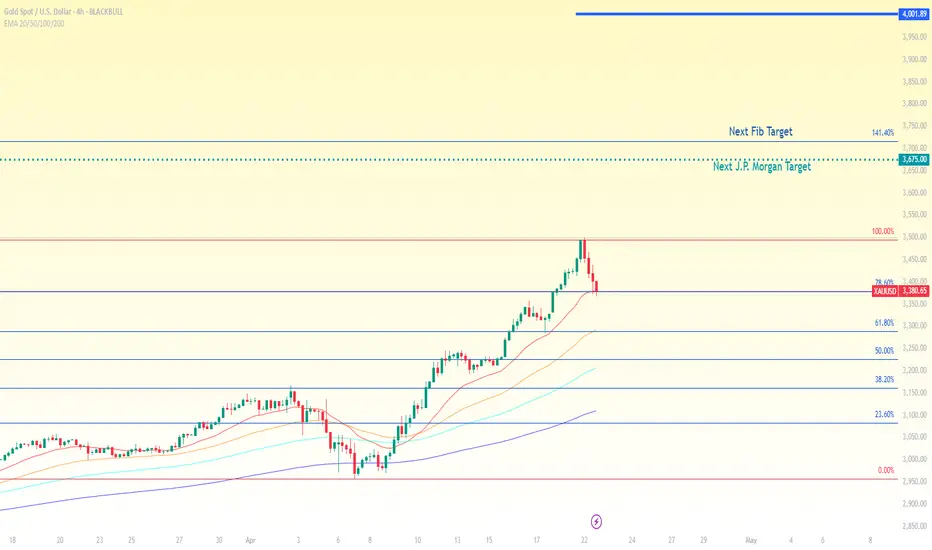
J.P. Morgan joins the $4K gold clubJ.P. Morgan now forecasts gold to average $3,675 per ounce by year-end and joins Goldman Sachs in projecting a move beyond $4,000 next year.
Spot gold has gained 29% year-to-date, setting 28 record highs and briefly surpassing $3,500 for the first time yesterday.
According to the bank, the main downside risk remains a sudden decline in central bank demand. Key support has potentially shifted higher, with $3,286 now seen as a potential pivot—aligned with both the 50-day moving average and the 61.8% Fibonacci retracement.
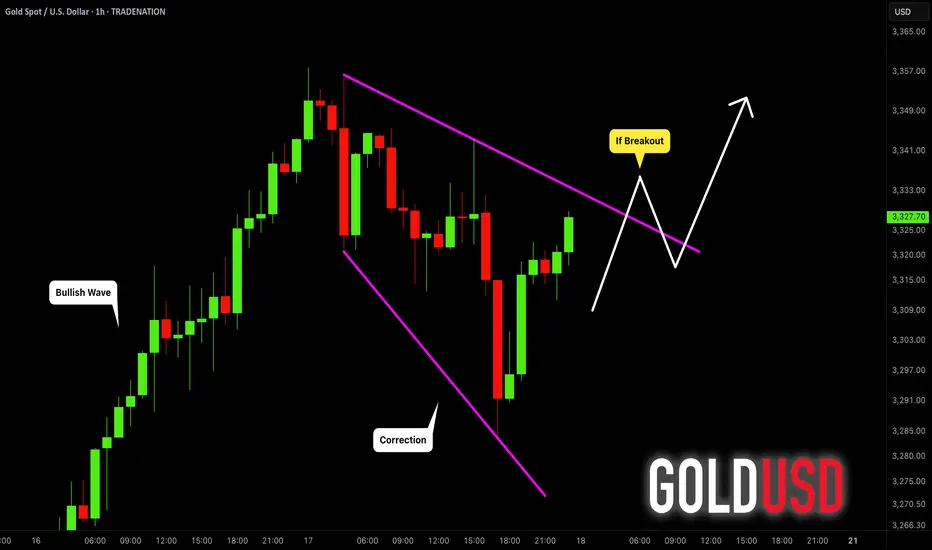
GOLD (XAUUSD): Classic Trend-Following Pattern
Gold closed on Thursday, forming a bullish flag pattern
on an hourly time frame.
The flag reflects a correction that the market started after a completion
of a strong bullish wave.
A breakout of its resistance line and a candle close above will signify
a highly probable resumption of the trend.
With a high probability, the price will move up at least to a current ATH.
(Remember that the price may respect a trend line one or several times more
and a correction can be more extended, that is why we rely on a breakout of a reliable trigger).
❤️Please, support my work with like, thank you!❤️
I am part of Trade Nation's Influencer program and receive a monthly fee for using their TradingView charts in my analysis.
Gold hits record as Polymarket flips Fed callFederal Reserve Chair Jerome Powell has warned that President Donald Trump’s tariff policy is likely to fuel higher inflation and slow economic growth.
Speaking at the Economic Club of Chicago on Wednesday, Powell said, “Markets are struggling with a lot of uncertainty, and that means volatility.” His comments were quickly reflected in the markets, with the Dow shedding 1.7%, the S&P 500 falling 2.3%, and the Nasdaq tumbling 3.4%. Meanwhile, gold extended its rally to a new record high of $3,337.
What may not be uncertain is the Fed’s next rate decision. According to Polymarket data, there's now an 89% chance the Federal Reserve will hold rates steady at its May meeting—up from 69% just a month ago.
Polymarket is also pricing the odds of Powell being replaced by Trump with a more servile director this year at 17% (which could likely send the odds of a rate cut in May shooting up).
