GOLD ROUTE MAP UPDATEHey Everyone,
Another great day on the Markets today, with our analysis playing out perfectly completing our 1h chart idea.
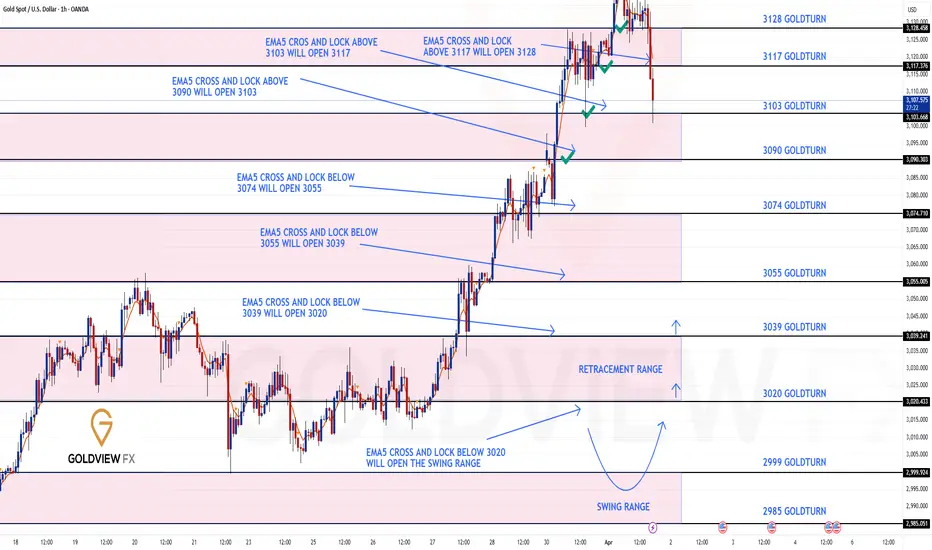
After completing 3090, 3103 and 3117, we stated that the lock above opened 3128 and just fell short and we were looking to buy dips to complete this target. This played out perfectly hitting this target and completing the chart idea.
We will update a new 1h chart idea later this week and in the mean time, please refer to our multi time frame chart ideas (weekly), that we shared Sunday, which are still in play.
BULLISH TARGET
3090 - DONE
EMA5 CROSS AND LOCK ABOVE 3090 WILL OPEN THE FOLLOWING BULLISH TARGET
3103 - DONE
EMA5 CROSS AND LOCK ABOVE 3103 WILL OPEN THE FOLLOWING BULLISH TARGET
3117 - DONE
EMA5 CROSS AND LOCK ABOVE 3117 WILL OPEN THE FOLLOWING BULLISH TARGET
3128 - DONE
As always, we will keep you all updated with regular updates throughout the week and how we manage the active ideas and setups. Thank you all for your likes, comments and follows, we really appreciate it!
Mr Gold
GoldViewFX
Goldtrading
XAUUS SHORTStubborn XAUUSD, played with my TP1 a few times, almost hitting it but never really reached and instead it went the other way and touched my SL. However Im still on a strong sell in this. Opening at 3078 and still maintaining my previous TP 3005 because I know that's the direction that it will head to, if this reaches, it will cover 3days loss, and setting my SL on a much further rate. Personally, I dont use SL's but for Tradingview Im opting to put one as a good practice
Day12of100
L:4
W:1
Such a shame that my L days are way more than my W's but still believing in my trade and I know this will pick up. let's see how this new trade rolls. XAUUSD is already in it's all time high, so I believe soon enough my much awaited correction will happen, Il be patient :)
Another Good Trade for GOLD (XAUUSD) Today
My overall forecast for this week is that Gold will do classic expansion week where monday will go up then tuesday will most likely go up to sweep mondays high then do the reversal so that wednesday and thursday will be expansion going down and target the daily imbalances below. For today i was expecting a bullish push upwards for GOLD before it will reverse so i followed my steps by combining my multi timeframe analysis. From daily for the overall bias to 1H for that confirmation and alignment then 5m for my entry timeframe. Once i saw those 3 timeframes align with combination confirmation that i saw with the price action then i entered the trade. My original target was 1:3R but then i saw the weakness after price came to my 1:2R level so i manually pulled out with a 1:2R gain for today....
Happy New Month: -1-APRIL-2025Good morning Traders! Happy New Month! Improve your trading strategy with our Gold zones. Understand market dynamics and make informed decisions.

GOLD 1H CHART ROUTE MAP & TRADING PLAN FOR THE WEEKHey Everyone,
Please see our updated 1h chart levels and targets for the coming week.
We are seeing price play between two weighted levels with a gap above at 3090 and a gap below at 3074. We will need to see ema5 cross and lock on either weighted level to determine the next range.
We will see levels tested side by side until one of the weighted levels break and lock to confirm direction for the next range.
We will keep the above in mind when taking buys from dips. Our updated levels and weighted levels will allow us to track the movement down and then catch bounces up.
We will continue to buy dips using our support levels taking 30 to 40 pips. As stated before each of our level structures give 20 to 40 pip bounces, which is enough for a nice entry and exit. If you back test the levels we shared every week for the past 24 months, you can see how effectively they were used to trade with or against short/mid term swings and trends.
BULLISH TARGET
3090
EMA5 CROSS AND LOCK ABOVE 3090 WILL OPEN THE FOLLOWING BULLISH TARGET
3103
EMA5 CROSS AND LOCK ABOVE 3103 WILL OPEN THE FOLLOWING BULLISH TARGET
3117
EMA5 CROSS AND LOCK ABOVE 3117 WILL OPEN THE FOLLOWING BULLISH TARGET
3128
BEARISH TARGETS
3074
EMA5 CROSS AND LOCK BELOW 3074 WILL OPEN THE FOLLOWING BEARISH TARGET
3055
EMA5 CROSS AND LOCK BELOW 3055 WILL OPEN THE FOLLOWING BEARISH TARGET
3039
EMA5 CROSS AND LOCK BELOW 3039 WILL OPEN THE FOLLOWING BEARISH TARGET
3020
EMA5 CROSS AND LOCK BELOW 3020 WILL OPEN THE SWING RANGE
SWING RANGE
2999 - 2985
As always, we will keep you all updated with regular updates throughout the week and how we manage the active ideas and setups. Thank you all for your likes, comments and follows, we really appreciate it!
Mr Gold
GoldViewFX

GOLD 4H CHART ROUTE MAP UPDATE & TRADING PLAN FOR THE WEEKHey Everyone,
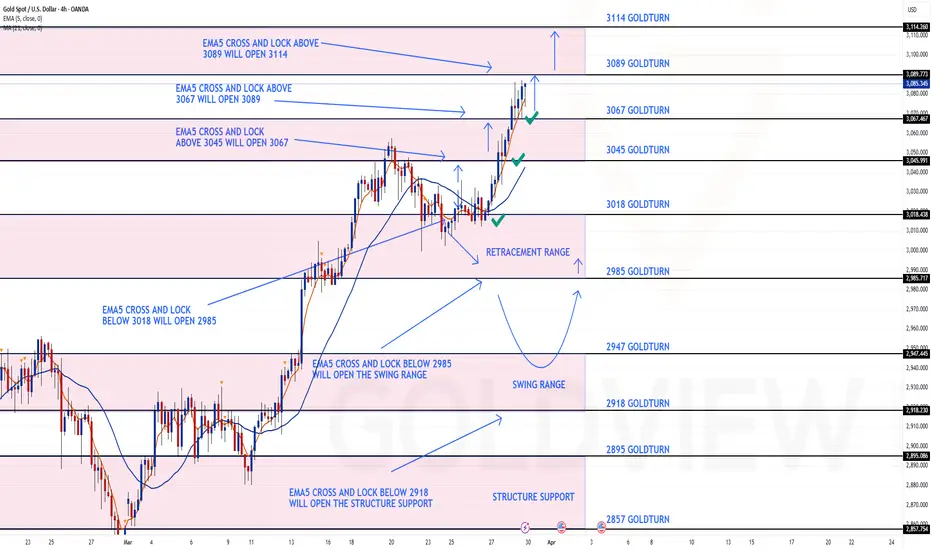
This is a continuation update from last week, which is playing out perfectly clearing first our Bearish target followed with all our Bullish targets with ema5 lock confirmations.
We are now seeing a gap left open at 3089 and will need ema5 to cross and lock above this level for a continuation into the next level. Failure to lock will see price reject into the lower Goldturns for bounces or further cross and locks below the levels to open the levels below.
We will see levels tested side by side until one of the weighted levels break and lock to confirm direction for the next range.
We will keep the above in mind when taking buys from dips. Our updated levels and weighted levels will allow us to track the movement down and then catch bounces up.
We will continue to buy dips using our support levels taking 30 to 40 pips. As stated before each of our level structures give 20 to 40 pip bounces, which is enough for a nice entry and exit. If you back test the levels we shared every week for the past 24 months, you can see how effectively they were used to trade with or against short/mid term swings and trends.
BULLISH TARGET
3045 - DONE
EMA5 CROSS AND LOCK ABOVE 3045 WILL OPEN THE FOLLOWING BULLISH TARGET
3067 - DONE
EMA5 CROSS AND LOCK ABOVE 3067 WILL OPEN THE FOLLOWING BULLISH TARGET
3089
EMA5 CROSS AND LOCK ABOVE 3089 WILL OPEN THE FOLLOWING BULLISH TARGET
3114
BEARISH TARGETS
3018
EMA5 CROSS AND LOCK BELOW 3018 WILL OPEN THE FOLLOWING BEARISH TARGET
2985
EMA5 CROSS AND LOCK BELOW 2985 WILL OPEN THE SWING RANGE
SWING RANGE
2947 - 2918
As always, we will keep you all updated with regular updates throughout the week and how we manage the active ideas and setups. Thank you all for your likes, comments and follows, we really appreciate it!
Mr Gold
GoldViewFX
GOLD DAILY CHART MID/LONG TERM UPDATEHey Everyone,
This is an update on our daily chart idea that we are now tracking for a while now. If you have only started following us, please read the updates below at the bottom from previous weeks to see how effectively we have been tracking this.
Now after completing the target to the channel top we stated that if we see ema5 lock outside the channel then we will look for support outside the channel on the channel top for a continuation, which played out perfectly, as the channel top after the breakout provided support for a continuation.
We then stated and expected price to play between 3052 and 3007 until we see a break to confirm our next range. We got the test on 3007 with no body close or ema5 lock, which confirmed the rejection and the bounce perfectly into 3052, which then followed with the body close above 3052 opening the range above, giving a nice clean run of over 300 pips. Gap remains open and ema5 lock will only further confirm this but we are happy with the run already and will now continue to buy from dops only.
This is the beauty of our Goldturn channels, which we draw in our unique way, using averages rather than price. This enables us to identify fake-outs and breakouts clearly, as minimal noise in the way our channels are drawn.
We will use our smaller timeframe analysis on the 1H and 4H chart to buy dips from the weighted Goldturns for 30 to 40 pips clean. Ranging markets are perfectly suited for this type of trading, instead of trying to hold longer positions and getting chopped up in the swings up and down in the range.
We will keep the above in mind when taking buys from dips. Our updated levels and weighted levels will allow us to track the movement down and then catch bounces up using our smaller timeframe ideas.
Our long term bias is Bullish and therefore we look forward to drops from rejections, which allows us to continue to use our smaller timeframes to buy dips using our levels and setups.
Buying dips allows us to safely manage any swings rather then chasing the bull from the top.
Thank you all for your likes, comments and follows, we really appreciate it!
Mr Gold
GoldViewFX
OLD UPDATES ON THIS CHART IDEA
MARCH 23RD WEEK UPDATE
The half line of our unique channel gave the perfect bounce into the next axis target at 2904, inline with our plans to buy dips just like we stated. We now have a body close once again with ema5 cross and lock above 2904 leaving the range above open. We will continue to look for support at the ascending half-line of the channel, as we climb into the range.
PREVIOUS WEEKS UPDATE
After completing our Bullish targets we stated that the channel top will act as resistance confirmed with ema5 rejection. A break of the channel top with ema5 would confirm a continuation and failure would confirm rejection. This allowed us to identify true breakouts against fake outs.
We also stated that we need to keep in mind the channel half line below to establish floor to provide support for the range, should we continue to track further up. A break below the half line will open the lower part of the channel to establish floor on the channel bottom. The safest way to track this movement is by buying dips.
- Once again this played out perfectly as we got the rejection on the channel top followed with the channel half line test, which gave the perfect bounce like we stated. We will now either look for a continuation from this bounce or a cross and lock below the half line for a break into the lower channel floor.

GOLD (XAUUSD): 3100 soon?!
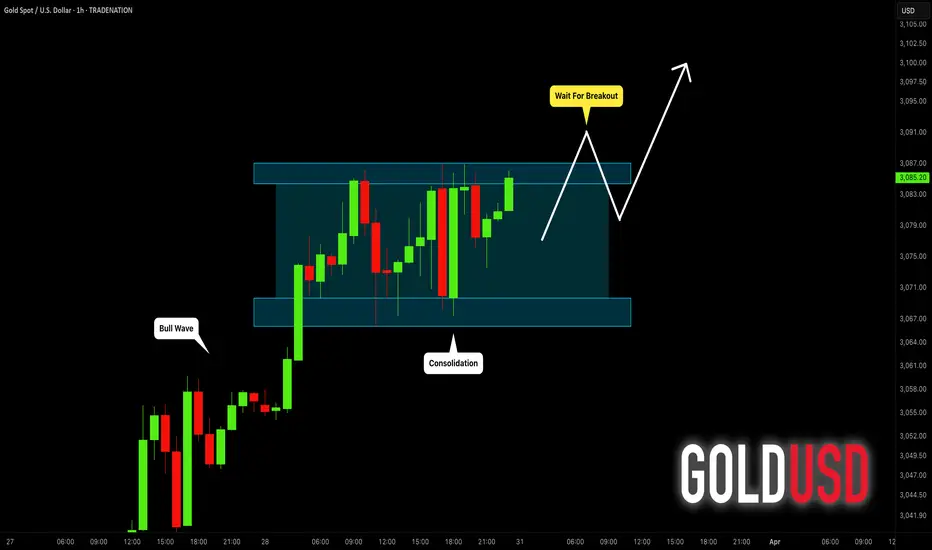
Gold closed on Friday, consolidating within the intraday range.
Probabilities are high that growth will resume next week.
Your signal to buy will be a breakout of the underlined resistance on the hourly time frame.
1H candle close above 3087 will confirm the violation.
A bullish continuation will be expected to 3100 level then.
❤️Please, support my work with like, thank you!❤️
I am part of Trade Nation's Influencer program and receive a monthly fee for using their TradingView charts in my analysis.
Expected Gold Price ScenarioWaiting for gold to drop to the designated levels without breaking them, while monitoring the 5-minute timeframe for a trend reversal from bearish to bullish before entering the trade.
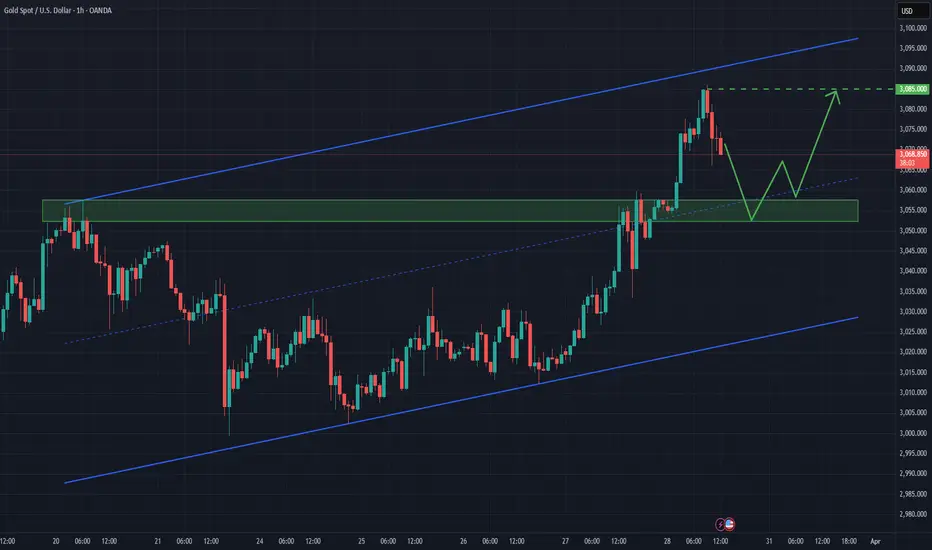
XAU/USD: Pullback Likely After Breakout Above Key ResistanceThe XAU/USD market has broken above last week’s high and is now testing the 3080 resistance level. Following this strong move, a pullback appears likely before any further advance. With bullish momentum still dominant, the market may continue higher or enter a sideways phase into next week.
If a pullback occurs, the previous resistance zone, now acting as support, could offer a buying opportunity—particularly near the 3050 level. With high-impact news on the horizon, the market may either range or retrace before resuming its upward trend. The next key target is the resistance zone around 3085
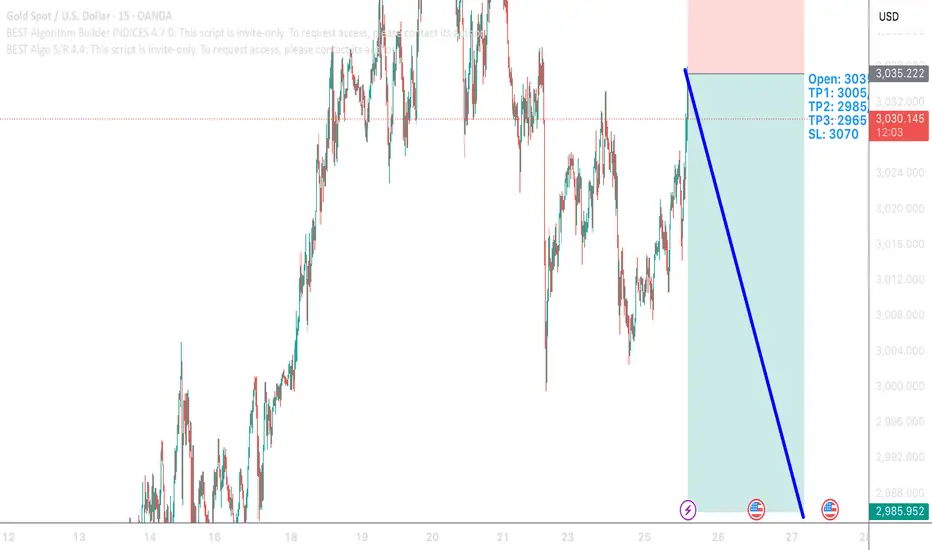
XAUUSD ShortKeeping my entry short. Trying to catch this position
Open: 3035
TP1: 3005//
TP2: 2985//
TP3: 2965
SL: 3070
Let's see how this day rolls
Day10of100
L:3
W:1
GOLD ROUTE MAP UPDATEHey Everyone,
A Piptastic day on the markets today with the breakout finally taking off, perfectly inline with our plans to buy dips and then into our Bullish targets.
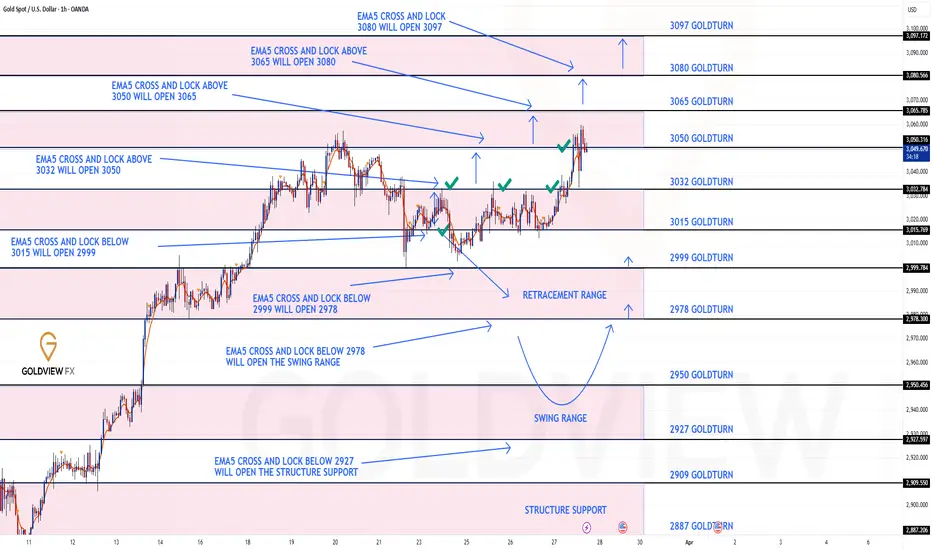
We had 3 tests on our Bullish target at 3032 this week and then finally a cross and lock opening 3050, which was hit perfectly. We will now need a cross and lock above 3050 for a continuation into the next Goldturn or failure to lock will see rejections into the lower Goldturns for the bounces inline with our plans to buy dips.
We will keep the above in mind when taking buys from dips. Our updated levels and weighted levels will allow us to track the movement down and then catch bounces up.
We will continue to buy dips using our support levels taking 30 to 40 pips. As stated before each of our level structures give 20 to 40 pip bounces, which is enough for a nice entry and exit. If you back test the levels we shared every week for the past 24 months, you can see how effectively they were used to trade with or against short/mid term swings and trends.
BULLISH TARGET
3032 - DONE
EMA5 CROSS AND LOCK ABOVE 3032 WILL OPEN THE FOLLOWING BULLISH TARGET
3050 - DONE
EMA5 CROSS AND LOCK ABOVE 3050 WILL OPEN THE FOLLOWING BULLISH TARGET
3065
EMA5 CROSS AND LOCK ABOVE 3065 WILL OPEN THE FOLLOWING BULLISH TARGET
3080
EMA5 CROSS AND LOCK ABOVE 3080 WILL OPEN THE FOLLOWING BULLISH TARGET
3097
BEARISH TARGETS
3015 - DONE
EMA5 CROSS AND LOCK BELOW 3015 WILL OPEN THE FOLLOWING BEARISH TARGET
2999
EMA5 CROSS AND LOCK BELOW 2999 WILL OPEN THE FOLLOWING BEARISH TARGET
2978
EMA5 CROSS AND LOCK BELOW 2978 WILL OPEN THE SWING RANGE
SWING RANGE
2950 - 2927
As always, we will keep you all updated with regular updates throughout the week and how we manage the active ideas and setups. Thank you all for your likes, comments and follows, we really appreciate it!
Mr Gold
GoldViewFX
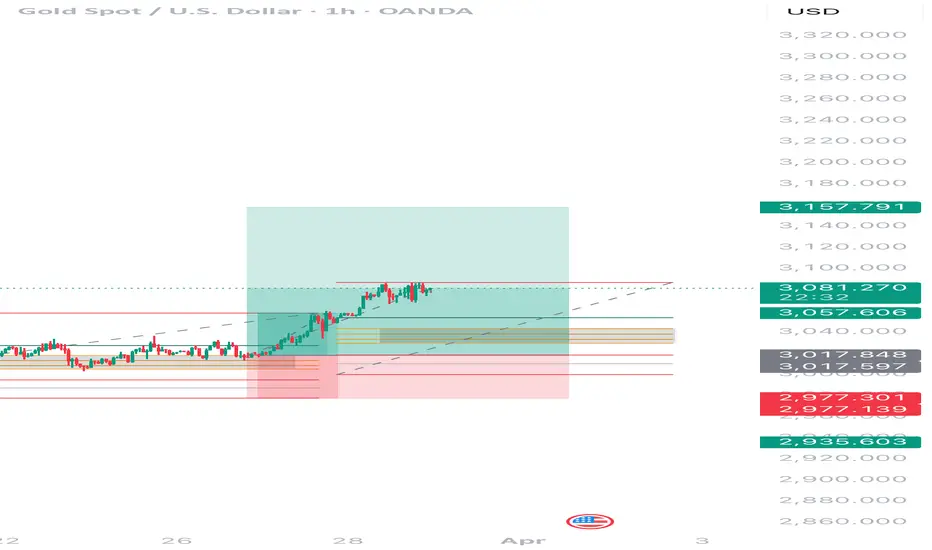
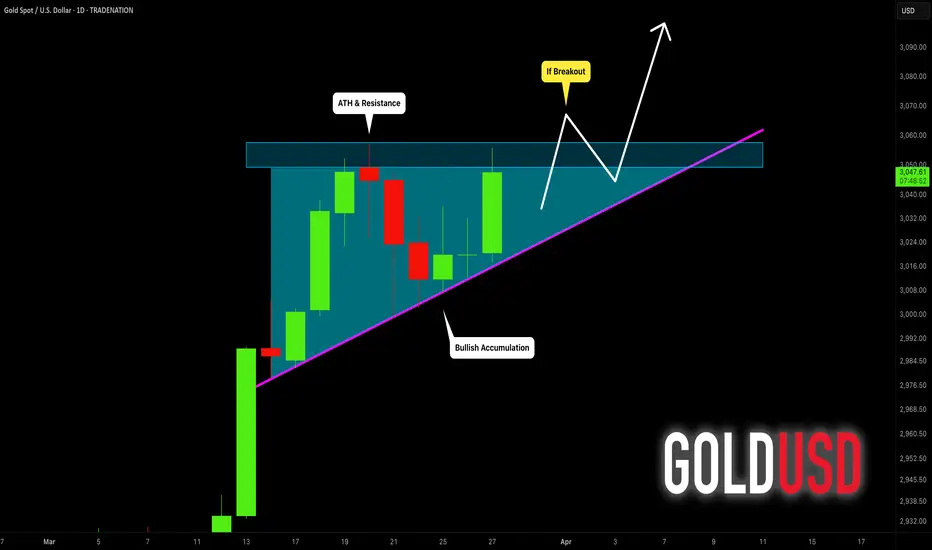
GOLD (XAUUSD): New ATH Soon?!
I see a bullish accumulation pattern - the ascending triangle formation
on Gold on a daily.
In a strong uptrend, such a pattern usually indicates a highly probable
bullish continuation.
The main focus now is on the underlined blue resistance based on a current ATH.
Its breakout and a daily candle close will open a potential for much more growth.
Next resistance will be 3100.
❤️Please, support my work with like, thank you!❤️
I am part of Trade Nation's Influencer program and receive a monthly fee for using their TradingView charts in my analysis.
Gold analysis: 27-MAR-2025Good morning, traders! Today's Gold analysis will help you achieve your trading goals. Let's work together towards success.

GOLD ROUTE MAP UPDATEHey Everyone,
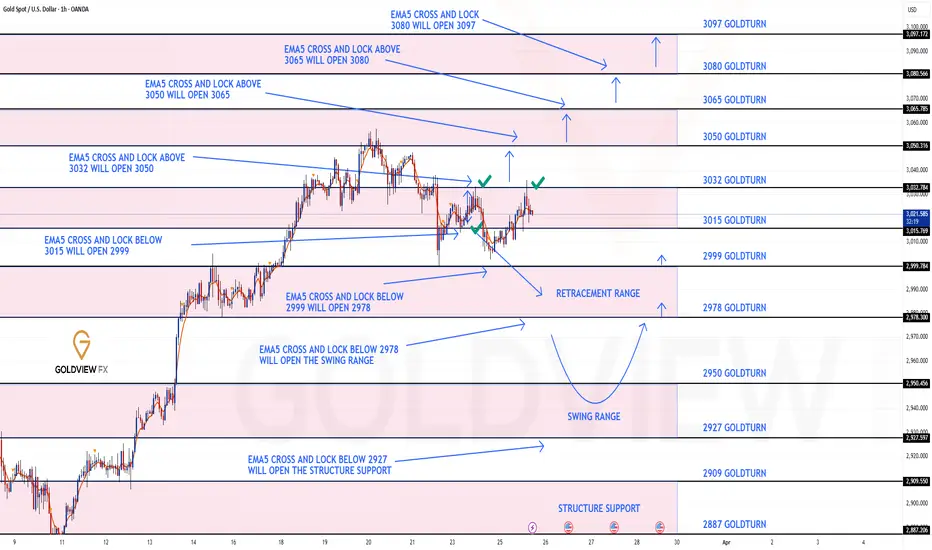
Another great day on the markets today, allowing us to bounce between the Goldturns, inline with our plans to buy dips. Not much to report as we are seeing Gold range sideways consolidating ready for a breakout.
We still have the gap left open at 2999, which fell short by a few pips. We will continue to use the lower Goldturns to buy dips until we see the weighted levels cross and lock to confirm the next range. Failure to break 3032 will keep seeing rejections into the lower Goldturns for the bounces.
We will keep the above in mind when taking buys from dips. Our updated levels and weighted levels will allow us to track the movement down and then catch bounces up.
We will continue to buy dips using our support levels taking 30 to 40 pips. As stated before each of our level structures give 20 to 40 pip bounces, which is enough for a nice entry and exit. If you back test the levels we shared every week for the past 24 months, you can see how effectively they were used to trade with or against short/mid term swings and trends.
BULLISH TARGET
3032 - DONE
EMA5 CROSS AND LOCK ABOVE 3032 WILL OPEN THE FOLLOWING BULLISH TARGET
3050
EMA5 CROSS AND LOCK ABOVE 3050 WILL OPEN THE FOLLOWING BULLISH TARGET
3065
EMA5 CROSS AND LOCK ABOVE 3065 WILL OPEN THE FOLLOWING BULLISH TARGET
3080
EMA5 CROSS AND LOCK ABOVE 3080 WILL OPEN THE FOLLOWING BULLISH TARGET
3097
BEARISH TARGETS
3015 - DONE
EMA5 CROSS AND LOCK BELOW 3015 WILL OPEN THE FOLLOWING BEARISH TARGET
2999
EMA5 CROSS AND LOCK BELOW 2999 WILL OPEN THE FOLLOWING BEARISH TARGET
2978
EMA5 CROSS AND LOCK BELOW 2978 WILL OPEN THE SWING RANGE
SWING RANGE
2950 - 2927
As always, we will keep you all updated with regular updates throughout the week and how we manage the active ideas and setups. Thank you all for your likes, comments and follows, we really appreciate it!
Mr Gold
GoldViewFX

XAU/USD 26 March 2025 Intraday AnalysisH4 Analysis:
-> Swing: Bullish.
-> Internal: Bullish.
Bias and analysis remains the same as analysis dated 23 March 2025.
Price has printed a bearish CHoCH following printing further all time highs.
Price is now trading within an established internal range. I will however continue to monitor price.
Intraday Expectation:
Price to trade down to either discount of internal 50% EQ, or nested Daily and H4 demand levels before targeting weak internal high priced at 3,057.590.
Note:
With the Federal Reserve's dovish stance and persisting geopolitical uncertainties, heightened volatility in Gold is expected to continue. Traders should proceed with caution and adjust risk management strategies in this high-volatility environment.
Price could also be driven by President Trump's policies, geopolitical moves and economic decisions which are sparking uncertainty.
H4 Chart:
M15 Analysis:
-> Swing: Bullish.
-> Internal: Bearish.
Analysis and bias remains the same as analysis dated 24 March 2025.
As per analysis dated 19 March 2025 whereby I mentioned as an alternative scenario that internal range has significantly narrowed. All HTF's require a pullback, therefore, it would be completely viable if price printed a bearish iBOS.
This is how price printed, by printing a bearish iBOS.
Price has yet to print a bullish CHoCH to indicate bullish pullback phase initiation, however, price has traded into premium of 50% internal EQ, therefore, I am happy to confirm internal range.
Intraday Expectation:
Price has traded in to premium of 50% EQ and has mitigated M15 supply zone.
Technically, price to target weak internal low priced at 2,999.465.
Note:
With the Federal Reserve maintaining a dovish stance and ongoing geopolitical tensions, volatility in Gold prices is expected to remain elevated. Traders should exercise caution, adjust risk management strategies, and stay prepared for potential price whipsaws in this high-volatility environment.
M15 Chart:

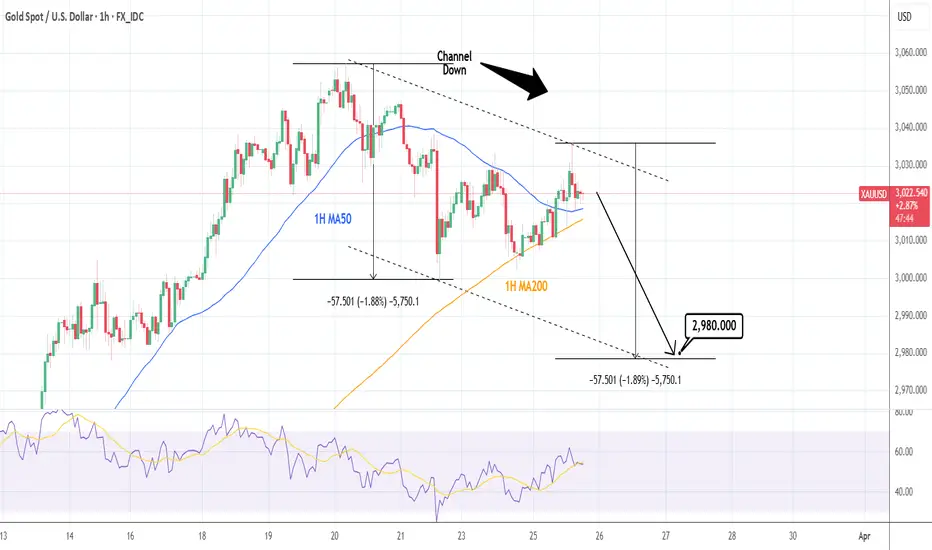
XAUUSD: Channel Down about to start the new bearish wave.Gold is neutral on its 1H technical outlook (RSI = 52.608, MACD = 1.710, ADX = 25.254) which, as the price test the top of the Channel Down, indicates that it is about to start the new bearish wave. The trigger for that sell trade would be a break under the 1H MA200. Aim for a -1.88% decline (TP = 2,980).
## If you like our free content follow our profile to get more daily ideas. ##
## Comments and likes are greatly appreciated. ##
GOLD ROUTE MAP UPDATEHey Everyone,
Another great day on the markets today with out plans to buy dips playing out perfectly. We had the gap left open at 2999 yesterday, which had the move down but just fell short of the full gap. We were able to use the dip to ride back up to our bullish target 3032 once again.
No further lock above 3032 confirmed the rejection again. We are looking for this level to break to confirm a continuation. Failure to break this level will keep seeing rejections into the lower Goldturns for the bounces. We also need to keep in mind the full gap at 2999, inline with our plans to buy dips.
We will keep the above in mind when taking buys from dips. Our updated levels and weighted levels will allow us to track the movement down and then catch bounces up.
We will continue to buy dips using our support levels taking 30 to 40 pips. As stated before each of our level structures give 20 to 40 pip bounces, which is enough for a nice entry and exit. If you back test the levels we shared every week for the past 24 months, you can see how effectively they were used to trade with or against short/mid term swings and trends.
BULLISH TARGET
3032 - DONE
EMA5 CROSS AND LOCK ABOVE 3032 WILL OPEN THE FOLLOWING BULLISH TARGET
3050
EMA5 CROSS AND LOCK ABOVE 3050 WILL OPEN THE FOLLOWING BULLISH TARGET
3065
EMA5 CROSS AND LOCK ABOVE 3065 WILL OPEN THE FOLLOWING BULLISH TARGET
3080
EMA5 CROSS AND LOCK ABOVE 3080 WILL OPEN THE FOLLOWING BULLISH TARGET
3097
BEARISH TARGETS
3015 - DONE
EMA5 CROSS AND LOCK BELOW 3015 WILL OPEN THE FOLLOWING BEARISH TARGET
2999
EMA5 CROSS AND LOCK BELOW 2999 WILL OPEN THE FOLLOWING BEARISH TARGET
2978
EMA5 CROSS AND LOCK BELOW 2978 WILL OPEN THE SWING RANGE
SWING RANGE
2950 - 2927
As always, we will keep you all updated with regular updates throughout the week and how we manage the active ideas and setups. Thank you all for your likes, comments and follows, we really appreciate it!
Mr Gold
GoldViewFX
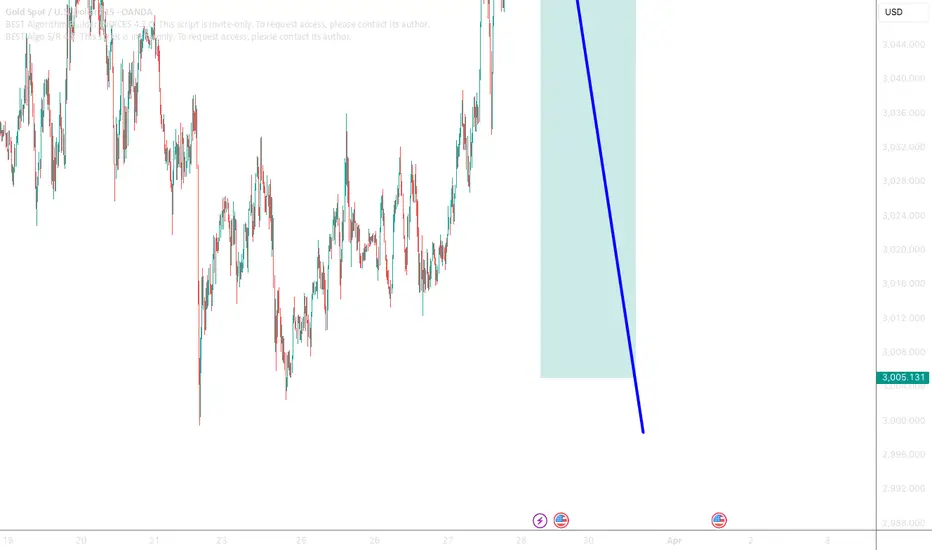
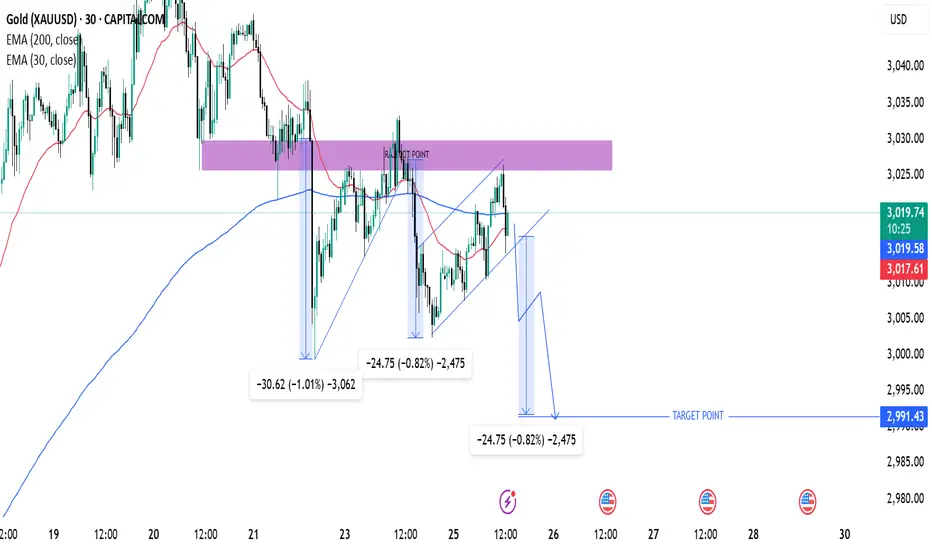
Gold (XAU/USD) Bearish Setup – Potential Drop to $2,991This is a trading setup for Gold (XAU/USD) on the 30-minute timeframe, showing a potential bearish move.
Analysis:
Key Indicators:
200 EMA (blue line) at 3,019.55: Acting as a resistance level.
30 EMA (red line) at 3,017.45: Providing short-term trend guidance.
Price Action & Structure:
The price previously rejected from a resistance zone (purple area) and started forming lower highs.
Repeated bearish patterns suggest another potential drop.
The chart highlights measured moves of previous declines (-30.62, -24.75), indicating a possible repeat of the pattern.
Trade Setup:
Bearish Outlook: Price is expected to drop towards the target point at 2,991.43.
Entry: Near the break of the lower trendline in the ascending wedge.
Target: 2,991.43 (marked as "TARGET POINT").
Risk Management: Ensure proper stop-loss placement above recent highs.
Conclusion:
If price respects the pattern, a downward move is likely.
A confirmed break below support could accelerate the drop.
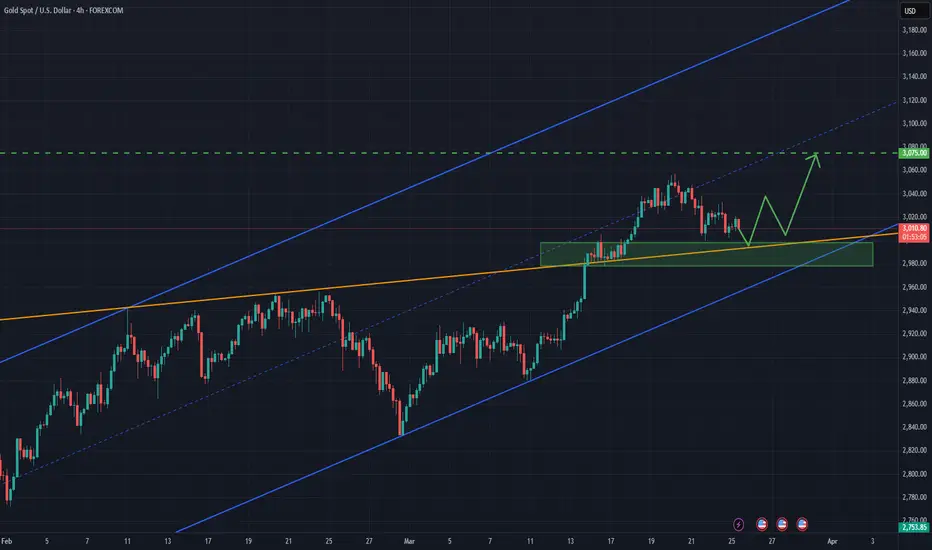
XAU/USD: Bullish Momentum Holds with Breakout PotentialXAU/USD closed its third straight bullish week, with price testing Tuesday’s low before rebounding and closing near the 50% mark of the weekly range. Despite a brief dip, the candle closed above last week’s high, showing continued strength. A breakout above the 3,000 level raises the potential for further gains, especially if the market opens with a gap up.
On the daily timeframe, Friday's candle recovered after early weakness, resembling a previous pullback seen earlier this month. With a 1.90% retracement, the structure suggests possible upward continuation. The market is currently moving sideways within Friday’s range, hovering around the 3,030 key level.
While high-impact news could cause volatility, any pullback toward the 3,000 support zone—aligned with the trendline and previous week’s high—may offer buying opportunities. A breakout from the inside bar pattern forming on the daily chart could target the 3075 resistance zone
GOLD ROUTE MAP UPDATEHey Everyone,
Great start to the week with our chart idea playing out as analysed.
We got our Bullish target hit at 3032 with no cross and lock above confirming the rejection after the hit. We also got our Bearish target hit at 3015 now also following with a cross and lock leaving 2999 Goldturn open.
We will keep the above in mind when taking buys from dips. Our updated levels and weighted levels will allow us to track the movement down and then catch bounces up.
We will continue to buy dips using our support levels taking 30 to 40 pips. As stated before each of our level structures give 20 to 40 pip bounces, which is enough for a nice entry and exit. If you back test the levels we shared every week for the past 24 months, you can see how effectively they were used to trade with or against short/mid term swings and trends.
BULLISH TARGET
3032 - DONE
EMA5 CROSS AND LOCK ABOVE 3032 WILL OPEN THE FOLLOWING BULLISH TARGET
3050
EMA5 CROSS AND LOCK ABOVE 3050 WILL OPEN THE FOLLOWING BULLISH TARGET
3065
EMA5 CROSS AND LOCK ABOVE 3065 WILL OPEN THE FOLLOWING BULLISH TARGET
3080
EMA5 CROSS AND LOCK ABOVE 3080 WILL OPEN THE FOLLOWING BULLISH TARGET
3097
BEARISH TARGETS
3015 - DONE
EMA5 CROSS AND LOCK BELOW 3015 WILL OPEN THE FOLLOWING BEARISH TARGET
2999
EMA5 CROSS AND LOCK BELOW 2999 WILL OPEN THE FOLLOWING BEARISH TARGET
2978
EMA5 CROSS AND LOCK BELOW 2978 WILL OPEN THE SWING RANGE
SWING RANGE
2950 - 2927
As always, we will keep you all updated with regular updates throughout the week and how we manage the active ideas and setups. Thank you all for your likes, comments and follows, we really appreciate it!
Mr Gold
GoldViewFX
XAUUSD Top-down analysis Hello traders, this is a complete multiple timeframe analysis of this pair. We see could find significant trading opportunities as per analysis upon price action confirmation we may take this trade. Smash the like button if you find value in this analysis and drop a comment if you have any questions or let me know which pair to cover in my next analysis.

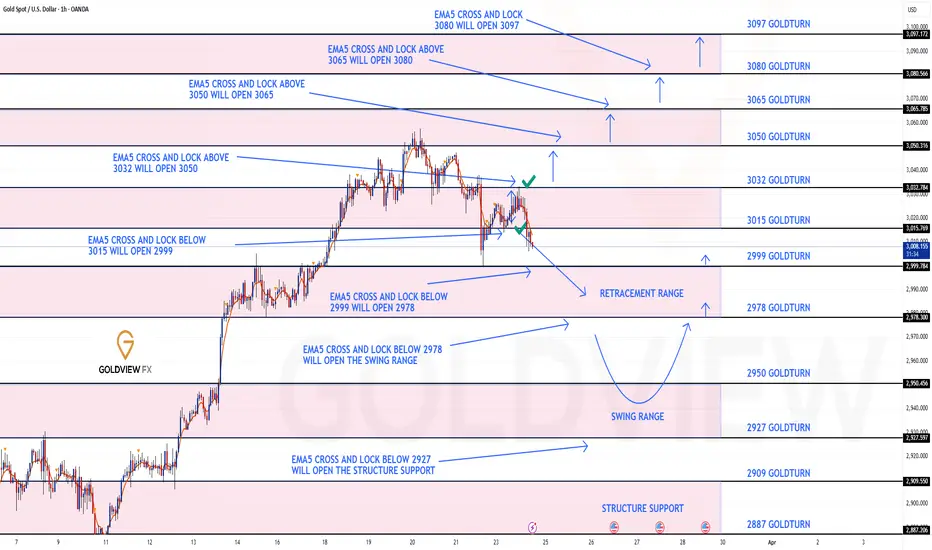
GOLD 1H CHART ROUTE MAP & TRADING PLAN FOR THE WEEKHey Everyone,
Please see our updated 1h chart levels and targets for the coming week.
We are seeing price play between two weighted levels with a gap above at 3032 and a gap below at 3015. We will need to see ema5 cross and lock on either weighted level to determine the next range.
We will see levels tested side by side until one of the weighted levels break and lock to confirm direction for the next range.
We will keep the above in mind when taking buys from dips. Our updated levels and weighted levels will allow us to track the movement down and then catch bounces up.
We will continue to buy dips using our support levels taking 30 to 40 pips. As stated before each of our level structures give 20 to 40 pip bounces, which is enough for a nice entry and exit. If you back test the levels we shared every week for the past 24 months, you can see how effectively they were used to trade with or against short/mid term swings and trends.
BULLISH TARGET
3032
EMA5 CROSS AND LOCK ABOVE 3032 WILL OPEN THE FOLLOWING BULLISH TARGET
3050
EMA5 CROSS AND LOCK ABOVE 3050 WILL OPEN THE FOLLOWING BULLISH TARGET
3065
EMA5 CROSS AND LOCK ABOVE 3065 WILL OPEN THE FOLLOWING BULLISH TARGET
3080
EMA5 CROSS AND LOCK ABOVE 3080 WILL OPEN THE FOLLOWING BULLISH TARGET
3097
BEARISH TARGETS
3015
EMA5 CROSS AND LOCK BELOW 3015 WILL OPEN THE FOLLOWING BEARISH TARGET
2999
EMA5 CROSS AND LOCK BELOW 2999 WILL OPEN THE FOLLOWING BEARISH TARGET
2978
EMA5 CROSS AND LOCK BELOW 2978 WILL OPEN THE SWING RANGE
SWING RANGE
2950 - 2927
As always, we will keep you all updated with regular updates throughout the week and how we manage the active ideas and setups. Thank you all for your likes, comments and follows, we really appreciate it!
Mr Gold
GoldViewFX
