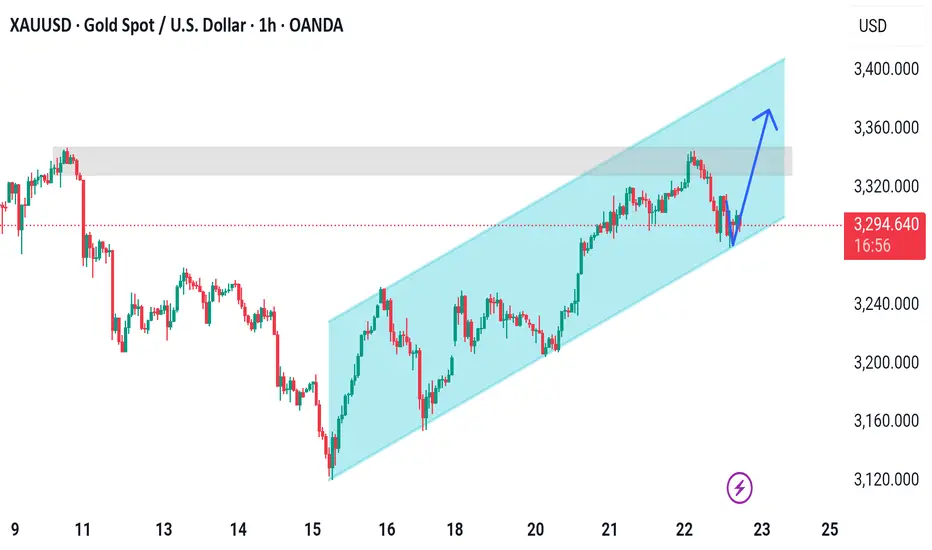
Xauusd Parallel Channel AheadTrend: The asset is in a clear short-term uptrend, staying within a rising channel.
Support Zone: Price is currently testing the lower channel support, a common place for bullish reversals if the channel remains intact.
Resistance Zone: There is a horizontal resistance area marked in gray around the $3,340–$3,360 range, which aligns with prior price reactions.
Potential Setup: If the price respects the trendline, a long position with a target near the upper channel line (around $3,370–$3,400) could be considered. A stop loss might be placed just below the channel to manage risk.
Goldtrading
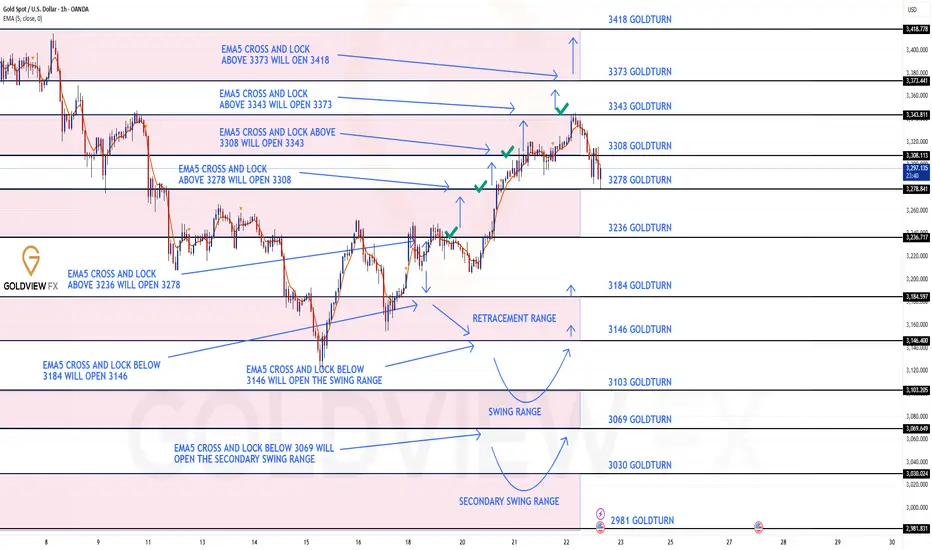
GOLD ROUTE MAP UPDATEHey Everyone,
Another strong day in the markets!
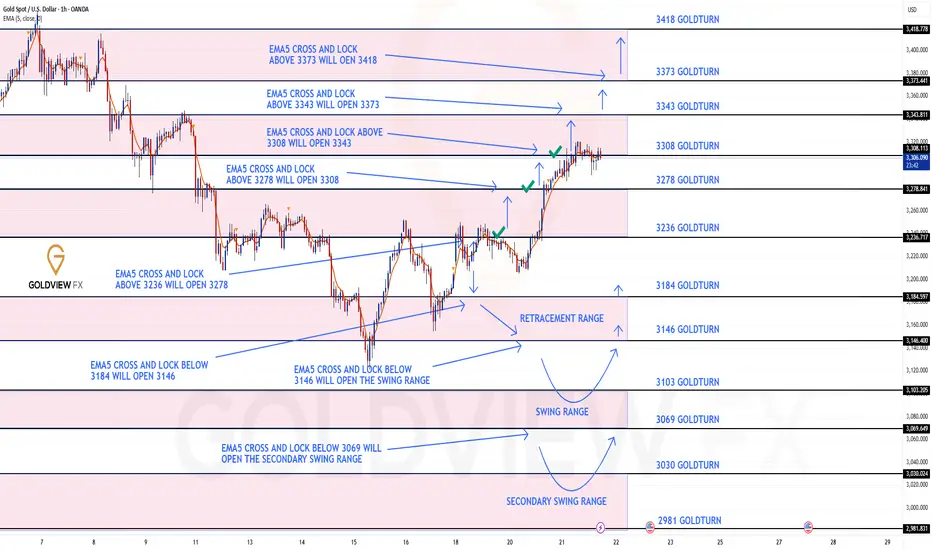
After hitting our bullish targets at 3236, 3278, and 3308 earlier this week, yesterday we identified and stated that we have EMA5 cross and lock above 3308, opening the move to 3343.
- 3343 target was reached with precision, completing the move as planned.
However, with no further lock above 3343, we saw the rejection, driving price back into the lower Goldturn zones for support and clean bounces just like we stated.
We’ll continue tracking price level by level, guided by EMA5 confirmations and buying the dips, inline with our plans.
We will keep the above in mind when taking buys from dips. Our updated levels and weighted levels will allow us to track the movement down and then catch bounces up.
We will continue to buy dips using our support levels taking 20 to 40 pips. As stated before each of our level structures give 20 to 40 pip bounces, which is enough for a nice entry and exit. If you back test the levels we shared every week for the past 24 months, you can see how effectively they were used to trade with or against short/mid term swings and trends.
The swing range give bigger bounces then our weighted levels that's the difference between weighted levels and swing ranges.
BULLISH TARGET
3236 - DONE
EMA5 CROSS AND LOCK ABOVE 3236 WILL OPEN THE FOLLOWING BULLISH TARGETS
3278 - DONE
EMA5 CROSS AND LOCK ABOVE 3278 WILL OPEN THE FOLLOWING BULLISH TARGET
3308 - DONE
EMA5 CROSS AND LOCK ABOVE 3308 WILL OPEN THE FOLLOWING BULLISH TARGET
3343 - DONE
EMA5 CROSS AND LOCK ABOVE 3343 WILL OPEN THE FOLLOWING BULLISH TARGETS
3373
EMA5 CROSS AND LOCK ABOVE 3373 WILL OPEN THE FOLLOWING BULLISH TARGETS
3418
BEARISH TARGETS
3184
EMA5 CROSS AND LOCK BELOW 3184 WILL OPEN THE FOLLOWING BEARISH TARGET
3146
EMA5 CROSS AND LOCK BELOW 3146 WILL OPEN THE SWING RANGE
3103
3069
EMA5 CROSS AND LOCK BELOW 3069 WILL OPEN THE SECONDARY SWING RANGE
3030
2981
As always, we will keep you all updated with regular updates throughout the week and how we manage the active ideas and setups. Thank you all for your likes, comments and follows, we really appreciate it!
Mr Gold
GoldViewFX
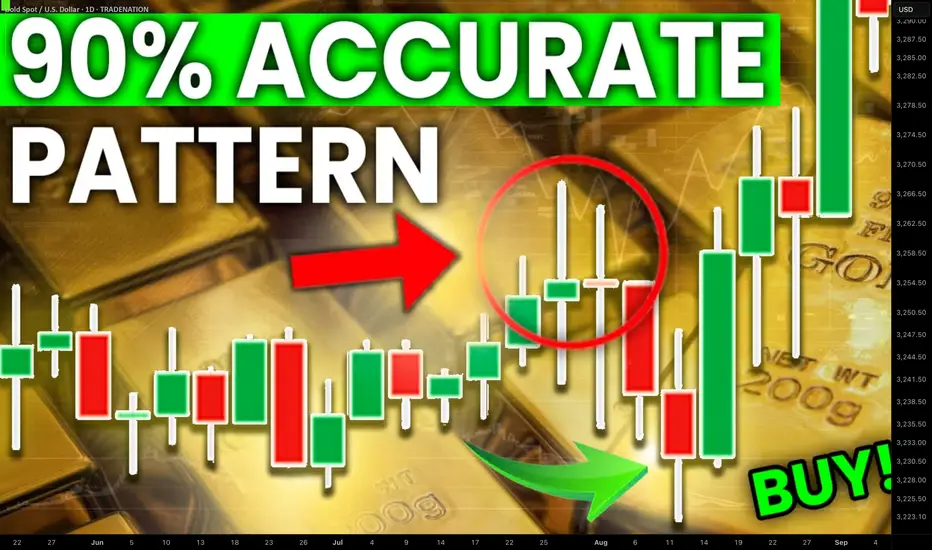
Learn Best Candlestick Pattern For Trend Trading Gold XAUUSD
This secret pattern will change the way you trade Gold XAUUSD.
If you study technical analysis in Gold trading, there is one unique candlestick pattern that you absolutely need to know.
In this article, you will learn the structure and the meaning of one of the most accurate candlesticks in Gold trading.
I will teach you how to recognize this pattern and how to trade it for maximum profits.
Let's start with some theory and let me show you how this candlestick pattern looks.
This candlestick pattern is called inside bar.
It is based on a combination of at least 3 candles.
The first candlestick in a sequence should be a strong bullish or bearish candle. The consequent candles should strictly close within its range.
If at least 2 candles close within the range of the first candle with its bodies, that will be a valid inside bar.
The first candle will always be called the mother's bar , while the following candles will be called the inside bars.
That's a perfect example of the inside bar pattern on Gold XAUUSD chart on a daily.
This pattern is based on 2 important elements that you should always pay close attention to.
The upper boundary of the range of the mother's bar will compose a significant resistance that will provide a safe place to sell.
While the lower boundary of the range of the mother's bar will be a strong support to buy Gold from.
Look how nicely Gold price respected the resistance of the range, dropped to its support and started to grow then.
Once you identified the inside bar, you can easily trade it within the range.
However, I strictly recommend waiting for a confirmation signal before you place a trade.
One of the proven confirmations is a price action signal on lower time frames.
In the example above, Gold formed a bullish chart pattern - double bottom after a test of a support and a bearish pattern - head and shoulders after a test of a resistance.
Remember that the market can not stay within the range of the inside bar candlestick pattern forever.
Bullish violation and a candle close above the range will be a strong signal to buy Gold.
While, a bearish breakout of its range will provide a strong bearish confirmation.
That's how a breakout of the underlined resistance triggered a strong rally on Gold.
Inside bar is the essential pattern both for the gold swing traders and day traders.
This pattern provides a lot of profitable trading opportunities, being very simple to recognize.
❤️Please, support my work with like, thank you!❤️
I am part of Trade Nation's Influencer program and receive a monthly fee for using their TradingView charts in my analysis.
GOLD 1H CHART ROUTE MAP UPDATEHey everyone,
Please see update on our 1h chart idea.
After completing our Bullish targets yesterday, at 3236 and 3278; we stated that we would look for ema5 to lock above 3278 to open 3308.
- We got the lock above 3278, confirming 3308, which was hit perfectly today. We now have a ema5 cross and lock above 3308, opening the range above. Any rejections in this zone and we may see a retest of lower Goldturns for the usual weighted level bounces, inline with our plans to buy dips.
We will keep the above in mind when taking buys from dips. Our updated levels and weighted levels will allow us to track the movement down and then catch bounces up.
We will continue to buy dips using our support levels taking 20 to 40 pips. As stated before each of our level structures give 20 to 40 pip bounces, which is enough for a nice entry and exit. If you back test the levels we shared every week for the past 24 months, you can see how effectively they were used to trade with or against short/mid term swings and trends.
The swing range give bigger bounces then our weighted levels that's the difference between weighted levels and swing ranges.
BULLISH TARGET
3236 - DONE
EMA5 CROSS AND LOCK ABOVE 3236 WILL OPEN THE FOLLOWING BULLISH TARGETS
3278 - DONE
EMA5 CROSS AND LOCK ABOVE 3278 WILL OPEN THE FOLLOWING BULLISH TARGET
3308 - DONE
EMA5 CROSS AND LOCK ABOVE 3308 WILL OPEN THE FOLLOWING BULLISH TARGET
3343
EMA5 CROSS AND LOCK ABOVE 3343 WILL OPEN THE FOLLOWING BULLISH TARGETS
3373
EMA5 CROSS AND LOCK ABOVE 3373 WILL OPEN THE FOLLOWING BULLISH TARGETS
3418
BEARISH TARGETS
3184
EMA5 CROSS AND LOCK BELOW 3184 WILL OPEN THE FOLLOWING BEARISH TARGET
3146
EMA5 CROSS AND LOCK BELOW 3146 WILL OPEN THE SWING RANGE
3103
3069
EMA5 CROSS AND LOCK BELOW 3069 WILL OPEN THE SECONDARY SWING RANGE
3030
2981
As always, we will keep you all updated with regular updates throughout the week and how we manage the active ideas and setups. Thank you all for your likes, comments and follows, we really appreciate it!
Mr Gold
GoldViewFX
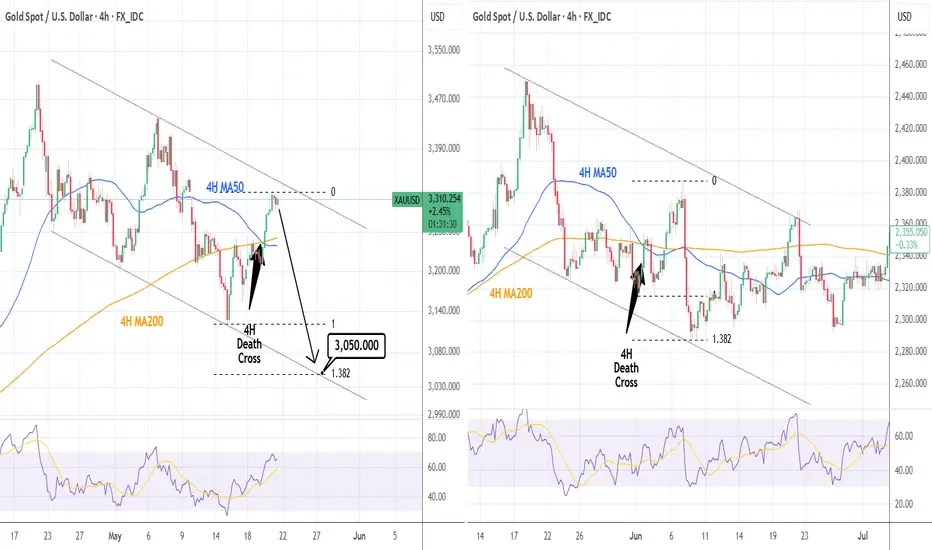
XAUUSD: Channel Down top with Death Cross. Best sell enty.Gold marginally turned bullish on its 1D technical outlook (RSI = 55.472, MACD = 17.780, ADX = 34.620) as the price has been rising since last Thursday. Technically however, it is on the most efficient sell entry as it is just under the LH top of the 1 month Channel Down. The big difference now is that it formed a 4H Death Cross and last time we had one inside a Channel Down was almost 1 year ago (June 3rd 2024) and set in motion one last bearish wave to the 1.382 Fibonacci extension. We are therefore short with TP = 3,050.
## If you like our free content follow our profile to get more daily ideas. ##
## Comments and likes are greatly appreciated. ##
Analysis of gold market trend in European sessionAlthough tariffs have been reduced, they are still at a high level. The risk of economic recession seems to be reduced, but the risk of rising interest rates is increasing, which will undoubtedly further suppress the US dollar and benefit gold. After the gold bulls successfully broke through the box shock range, they started a strong upward mode and advanced all the way. At present, there is a need for a callback on the 1-hour chart. Although the moving average is golden cross upward and the bulls are arranged and divergent, the bulls are strong. In the afternoon, gold rebounded quickly when it fell back to around 3298, and this position formed a strong support. Such a substantial breakthrough in the market has strong trend continuity, but the strength is obviously insufficient. At present, the upper resistance is 3317-3322, and the lower support is 3300-3295. It is recommended to rebound and short.
It is recommended to short at the rebound of 3315-3320, with a stop loss of 3325, and the target is 3300-3280.

XAUUSD Analysis todayHello traders, this is a complete multiple timeframe analysis of this pair. We see could find significant trading opportunities as per analysis upon price action confirmation we may take this trade. Smash the like button if you find value in this analysis and drop a comment if you have any questions or let me know which pair to cover in my next analysis.

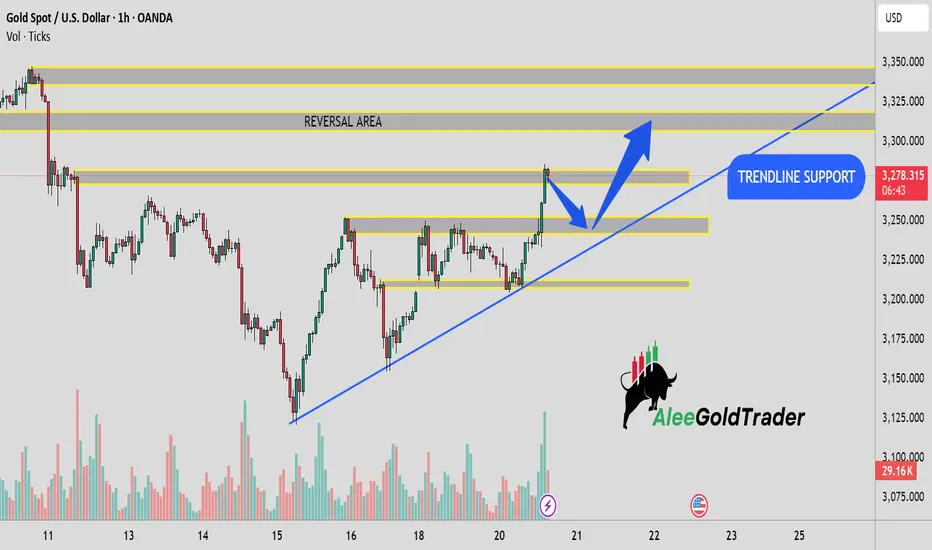
Gold Price Analysis – Bullish Trendline Support...This 1-hour chart of Gold Spot (XAU/USD) shows a strong bullish trend supported by an ascending trendline. Price has recently broken above a key resistance level and is now approaching a marked Reversal Area. A pullback towards the highlighted trendline support and horizontal zone (~3,250) is anticipated before a potential continuation upwards. The chart suggests bullish momentum remains intact as long as the price holds above trendline support. Watch for price action confirmation near the support zone for potential long opportunities.
Gold strongly breaks through the pressure level!Gold broke through 3250 and then rose rapidly. The main reason was the influence of geopolitics. Israel was preparing to launch a strike on Iran’s nuclear facilities, and the relationship between the two sides was tense. At the same time, the conflict between Russia and Ukraine continued to be deadlocked. The EU and the UK also announced a new round of sanctions against Russia. These have led to a surge in risk aversion in the market. Another point is that the expectation of a rate cut by the Federal Reserve has further increased. The above fundamentals have led to a further increase in gold prices!
Investment strategy: Gold 3290 long, stop loss 3280, target 3320

GOLD 1H CHART ROUTE MAP UPDATEHey everyone,
It’s been another piptastic day in the markets with our 1H chart setup playing out beautifully.
We began with our bullish target at 3236, which was successfully hit. This was followed by EMA5 cross and lock that opened 3278, also reached perfectly. The entire range played out smoothly, giving ample time after confirmation for entries.
Looking ahead, we’ll be watching for an EMA5 cross and lock above 3278, which could open the path to 3308. A further lock above 3308 would open the potential for extended upside.
However, if price fails to lock above these key levels, we may see a retest of lower Goldturns for a potential bounce.
We will keep the above in mind when taking buys from dips. Our updated levels and weighted levels will allow us to track the movement down and then catch bounces up.
We will continue to buy dips using our support levels taking 20 to 40 pips. As stated before each of our level structures give 20 to 40 pip bounces, which is enough for a nice entry and exit. If you back test the levels we shared every week for the past 24 months, you can see how effectively they were used to trade with or against short/mid term swings and trends.
The swing range give bigger bounces then our weighted levels that's the difference between weighted levels and swing ranges.
BULLISH TARGET
3236 - DONE
EMA5 CROSS AND LOCK ABOVE 3236 WILL OPEN THE FOLLOWING BULLISH TARGETS
3278 - DONE
EMA5 CROSS AND LOCK ABOVE 3278 WILL OPEN THE FOLLOWING BULLISH TARGET
3308
EMA5 CROSS AND LOCK ABOVE 3308 WILL OPEN THE FOLLOWING BULLISH TARGET
3343
EMA5 CROSS AND LOCK ABOVE 3343 WILL OPEN THE FOLLOWING BULLISH TARGETS
3373
EMA5 CROSS AND LOCK ABOVE 3373 WILL OPEN THE FOLLOWING BULLISH TARGETS
3418
BEARISH TARGETS
3184
EMA5 CROSS AND LOCK BELOW 3184 WILL OPEN THE FOLLOWING BEARISH TARGET
3146
EMA5 CROSS AND LOCK BELOW 3146 WILL OPEN THE SWING RANGE
3103
3069
EMA5 CROSS AND LOCK BELOW 3069 WILL OPEN THE SECONDARY SWING RANGE
3030
2981
As always, we will keep you all updated with regular updates throughout the week and how we manage the active ideas and setups. Thank you all for your likes, comments and follows, we really appreciate it!
Mr Gold
GoldViewFX

Will gold surge or plummet today?Gold technicals: Gold closed with a long shadow and a medium-sized negative line last week. Today, it opened higher and returned to the opening point of 3252 last Friday and fell again. In the short term, it entered a period of repeated shocks and saws, and the 3200 integer mark was lost and regained. The daily line just stood firm on the 60-day moving average and went higher. The previous weakness has now turned into strength, which just closed the Bollinger Bands. Based on this, this week is expected to rise in strength or stand firm above the middle track of the Bollinger Bands.

The gold bull trend emerges!Gold, intraday, one by one fell to 3204 and then rebounded. The evening analysis emphasized that the 4H chart structure was strong, and the US market continued to be bullish, with a target of 3264-3274; it has now reached 3264, in line with expectations; the 4H chart closed at 22:00 is still a bullish structure, and there will be continued energy release on Wednesday;
Short-term support 3252-3250, strong support 3244-3240; short-term resistance 3270-3274, strong resistance near the upper track of the daily chart 3300;

GOLD (XAUUSD): 2 Strong Bullish Patterns
As I warned you earlier, Gold is resuming a growth.
After completing a bullish accumulation, the price
is currently breaking both a neckline of an ascending triangle
and an inverted head and shoulders formation on a 4H.
I think that the price will rise more and reach 3320 resistance soon.
❤️Please, support my work with like, thank you!❤️
I am part of Trade Nation's Influencer program and receive a monthly fee for using their TradingView charts in my analysis.

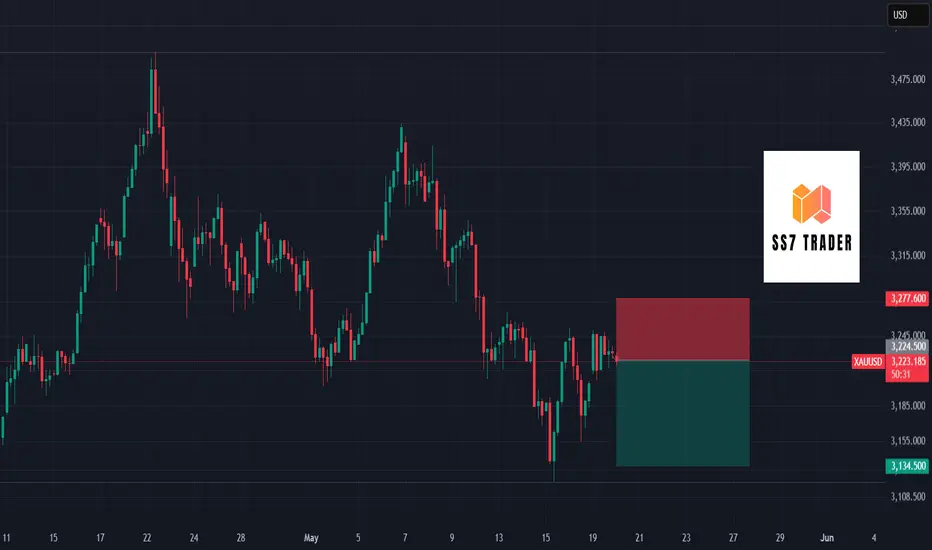
XAUUSD Deep Analysis Using Neural Networks Technology #xauusdThis analysis by ss7trader neural networks technology. this will higher chance to hit the take profit target and if you need any help or question then you can ask me on tradingview @ss7trader mostly i am available or you can also comment in the idea. also must like share the idea to getting these type of market analysis daily basis.
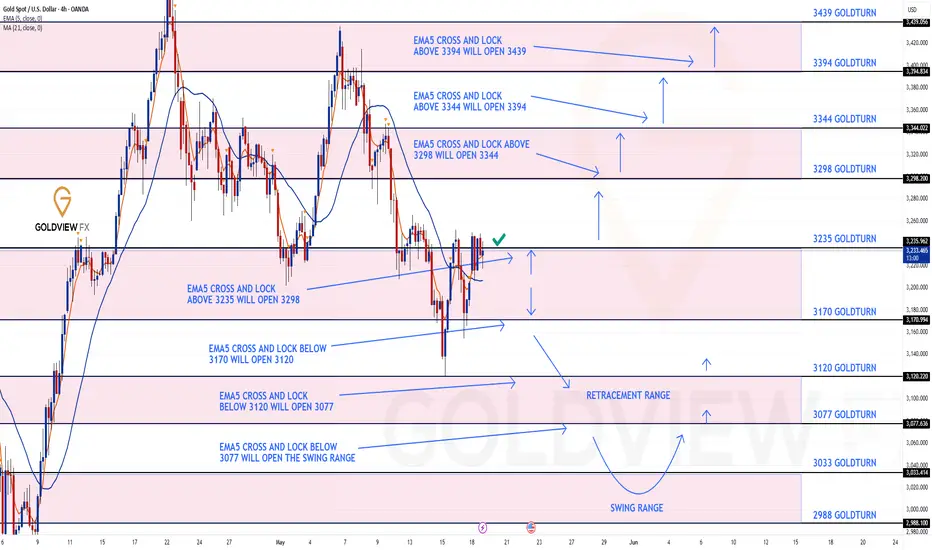
GOLD 4H CHART ROUTE MAP UPDATEHey Everyone,
Great start tot he week with all our chart ideas playing out as analysed. This is an update on our 4H chart idea.
We began the week hitting our bullish target at 3235. Moving forward, we will monitor for a confirmed EMA5 cross and lock above 3235 to validate a potential move toward the next target at 3298.
If price fails to hold above 3235, we anticipate a retest of lower Goldturn support levels. These levels will serve as potential zones to identify bullish reversal opportunities.
We will keep the above in mind when taking buys from dips. Our updated levels and weighted levels will allow us to track the movement down and then catch bounces up.
We will continue to buy dips using our support levels taking 20 to 40 pips. As stated before each of our level structures give 20 to 40 pip bounces, which is enough for a nice entry and exit. If you back test the levels we shared every week for the past 24 months, you can see how effectively they were used to trade with or against short/mid term swings and trends.
The swing range give bigger bounces then our weighted levels that's the difference between weighted levels and swing ranges.
BULLISH TARGET
3235 - DONE
EMA5 CROSS AND LOCK ABOVE 3235 WILL OPEN THE FOLLOWING BULLISH TARGET
3298
EMA5 CROSS AND LOCK ABOVE 3298 WILL OPEN THE FOLLOWING BULLISH TARGET
3344
EMA5 CROSS AND LOCK ABOVE 3344 WILL OPEN THE FOLLOWING BULLISH TARGET
3394
EMA5 CROSS AND LOCK ABOVE 3394 WILL OPEN THE FOLLOWING BULLISH TARGET
3439
BEARISH TARGETS
3170
EMA5 CROSS AND LOCK BELOW 3170 WILL OPEN THE FOLLOWING BEARISH TARGET TARGET
3120
EMA5 CROSS AND LOCK BELOW 3120 WILL OPEN THE FOLLOWING BEARISH TARGET TARGET
3077
EMA5 CROSS AND LOCK BELOW 3077 WILL OPEN THE SWING RANGE
SWING RANGE
3236 - 3176
EMA5 CROSS AND LOCK BELOW 3176 WILL OPEN THE SECONDARY SWING RANGE
SWING RANGE
3033 - 2988
As always, we will keep you all updated with regular updates throughout the week and how we manage the active ideas and setups. Thank you all for your likes, comments and follows, we really appreciate it!
Mr Gold
GoldViewFX
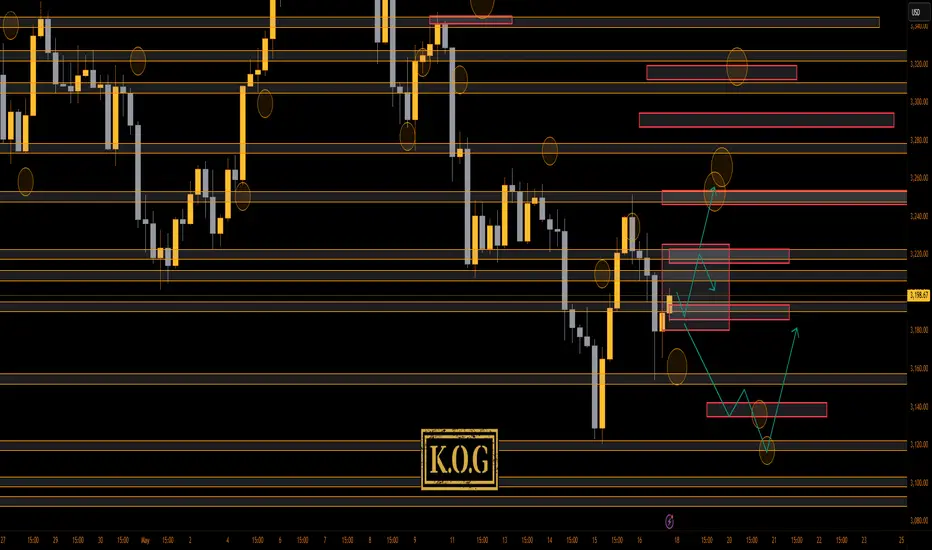
THE KOG REPORTTHE KOG REPORT:
In last week’s KOG Report we said we would be looking for the price to attempt the higher resistance level shown on the chart which was slightly higher than the red box. We wanted this level to reject price and give us the move down into the level which was shown on the chart. As you can see this move worked from the open, respecting the red box active level instead and completing all the bias level bearish targets in one swoop after the break.
We then updated the KOG Report with the move we wanted in order to then long into immediate resistance to again test the short trade, which again worked while we suggested traders look for the lower red box levels to attempt the long trades.
There was slight stretch again downside, but those red boxes played their part giving us the move on confirmation for the longs towards the end of the week, ending the week on a high.
It was a difficult week to trade with aggressive movement across the markets, however, the levels are reacting well and although there is a stretch on price, we’re getting the movement we want.
So, what can we expect in the week ahead?
We have key level now on the daily also aligning with the EMA50 at 3162 on the daily chart, while that 4H shows us a possible reversal on the flip. For this reason we have given the immediate red box levels of 3225-30 resistance and 3190-85 support. We have also plotted the potential range of play for the early part of the week, where we feel price may stabilise until a further move.
We’re looking for two possible moves here, one in order to continue to short and then look for the longer trade lower down, or, a break of the red box and bias level into higher resistance upon which we’ll trade level to level and then look higher for a potential short again. The bias level for this week has a huge extension of the move so it will be tradeable both directions. We have applied filters to the algo which is under test so we’ll also want to see if that works in our favour.
So, for now, support below can give us the move into the 3225-30 region which is the level to watch for the break, if rejected there may be an opportunity to short but that short must break below the 3185 level to continue and complete the move downside into the 3150-55 and below that 3130 levels. That’s where we feel the opportunity to long for the swing may come from but please remember, it’s changed structure until we break and hold above the 3265 level. That will be this week’s key level.
KOG’s bias of the week:
Bearish below 3235 with targets below 3196, 3185, 3177, 3165 and 3155
Bullish on break of 3230 with targets above 3242, 3250, 3255 and 3262
RED BOXES:
Break above 3210 for 3118, 3220, 3225, 3230, 3235 and 3247 in extension of the move
Break below 3195 for 3187, 3179, 3165, 3155, 3150 and 3137 in extension of the move
Please do support us by hitting the like button, leaving a comment, and giving us a follow. We’ve been doing this for a long time now providing traders with in-depth free analysis on Gold, so your likes and comments are very much appreciated.
As always, trade safe.
KOG
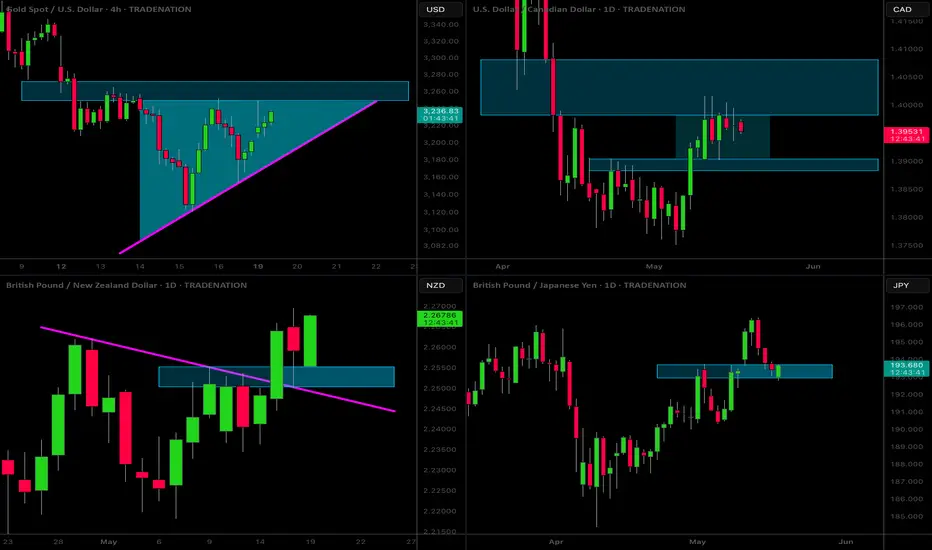
MarketBreakdown | GOLD, USDCAD, GBPNZD, GBPJPY
Here are the updates & outlook for multiple instruments in my watch list.
1️⃣ #GOLD #XAUUSD 4H time frame 🥇
I see some clear signs of bullish accumulation on intraday time frames.
The price formed an ascending triangle pattern.
Its neckline represents a significant resistance.
Its violation and a 4H candle close above will provide
a strong bullish confirmation signal.
A growth to higher structures will be expected then.
2️⃣ #USDCAD daily time frame 🇺🇸🇨🇦
Do not forget that today is the official banking holiday in Canada.
For that reason, CAD pairs might be slow.
USDCAD is currently consolidating within a narrow range on a daily.
I believe that for now, a consolidation is likely to continue.
3️⃣ #GBPNZD daily time frame 🇬🇧🇳🇿
The price successfully violated a falling trend line - a
strong vertical resistance last week.
We see a strong bullish reaction to that after its retest.
I believe that the pair will continue growing, it will likely
test a current high first and violate that, setting a new one then.
4️⃣ #GBPJPY daily time frame 🇬🇧🇯🇵
The pair is trading in a strong bullish trend on a daily.
The price is texting a significant support cluster at the moment,
probabilities will be high that a growth will resume from that.
Do you agree with my market breakdown?
❤️Please, support my work with like, thank you!❤️
I am part of Trade Nation's Influencer program and receive a monthly fee for using their TradingView charts in my analysis.
XAUUSD Analysis todayHello traders, this is a complete multiple timeframe analysis of this pair. We see could find significant trading opportunities as per analysis upon price action confirmation we may take this trade. Smash the like button if you find value in this analysis and drop a comment if you have any questions or let me know which pair to cover in my next analysis.

GOLD set for another drop?As expected in our previous analysis XAUUSD bounced to daily resistance and started to get rejected with a strong momentum in the major direction of the trend. As we see series of lower high formation XAUUSD may continue to drop to daily support level following the long term trend.

GOLD 4H CHART ROUTE MAP UPDATE & TRADING PLAN FOR THE WEEKHey Everyone,
Please see our updated 4h chart levels and targets for the coming week.
We are seeing price play between two weighted levels with a gap above at 3215 and a gap below at 3170. We will need to see ema5 cross and lock on either weighted level to determine the next range. We have a bigger range in play then usual.
We will see levels tested side by side until one of the weighted levels break and lock to confirm direction for the next range.
We will keep the above in mind when taking buys from dips. Our updated levels and weighted levels will allow us to track the movement down and then catch bounces up.
We will continue to buy dips using our support levels taking 20 to 40 pips. As stated before each of our level structures give 20 to 40 pip bounces, which is enough for a nice entry and exit. If you back test the levels we shared every week for the past 24 months, you can see how effectively they were used to trade with or against short/mid term swings and trends.
The swing range give bigger bounces then our weighted levels that's the difference between weighted levels and swing ranges.
BULLISH TARGET
3215
EMA5 CROSS AND LOCK ABOVE 3215 WILL OPEN THE FOLLOWING BULLISH TARGET
3298
EMA5 CROSS AND LOCK ABOVE 3298 WILL OPEN THE FOLLOWING BULLISH TARGET
3344
EMA5 CROSS AND LOCK ABOVE 3344 WILL OPEN THE FOLLOWING BULLISH TARGET
3394
EMA5 CROSS AND LOCK ABOVE 3394 WILL OPEN THE FOLLOWING BULLISH TARGET
3439
BEARISH TARGETS
3170
EMA5 CROSS AND LOCK BELOW 3170 WILL OPEN THE FOLLOWING BEARISH TARGET TARGET
3120
EMA5 CROSS AND LOCK BELOW 3120 WILL OPEN THE FOLLOWING BEARISH TARGET TARGET
3077
EMA5 CROSS AND LOCK BELOW 3077 WILL OPEN THE SWING RANGE
SWING RANGE
3236 - 3176
EMA5 CROSS AND LOCK BELOW 3176 WILL OPEN THE SECONDARY SWING RANGE
SWING RANGE
3033 - 2988
As always, we will keep you all updated with regular updates throughout the week and how we manage the active ideas and setups. Thank you all for your likes, comments and follows, we really appreciate it!
Mr Gold
GoldViewFX

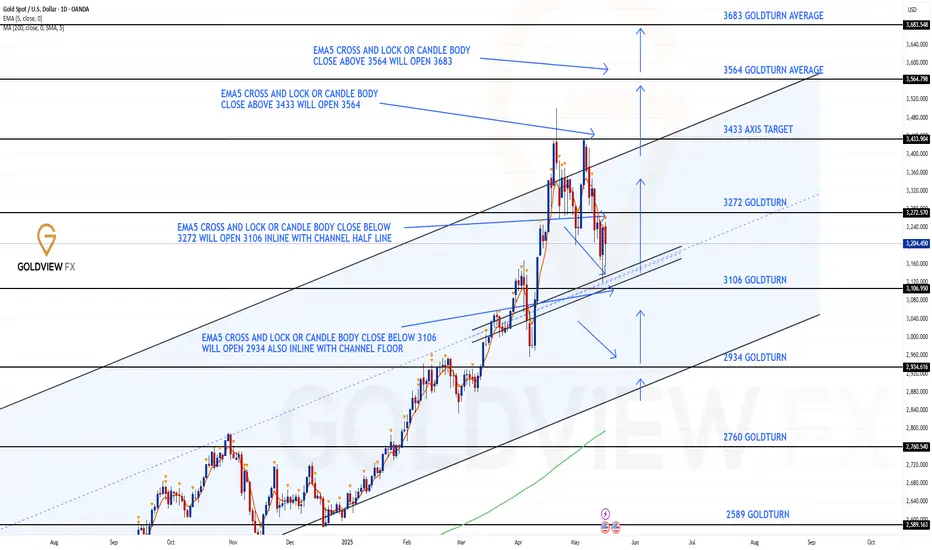
GOLD DAILY CHART ROUTE MAP Hey Everyone,
Please see the daily chart update. As shown, the Goldturn channel is still being respected by price action. After a failed breakout attempt above the channel alongside the EMA5, we saw a rejection back toward the channels half line, a level we've identified as a potential support zone.
This support held, resulting in a bounce that aligns with our strategy of buying dips. As long as price continues to hold above this level and the EMA5 remains supportive, we could see a gradual move back toward higher levels. However, if the midline is retested and fails, and the EMA5 crosses below the half line, this could signal a potential move toward the lower boundary of the channel.
This is the beauty of our Goldturn channels, drawn using weighted averages instead of pure price action. This unique approach helps us clearly identify fake-outs and real breakouts, cutting out much of the noise that usually confuses traders.
Moving forward, we’ll focus on smaller timeframes (1H and 4H) to buy dips off the weighted Goldturns, aiming for clean 30–40 pip moves. Ranging markets are perfect for this style, allowing us to capitalize on quick moves without getting caught in the chop of larger swings.
Thank you all again for your continued likes, comments, and follows, we truly appreciate your support!
Mr Gold
GoldViewFX
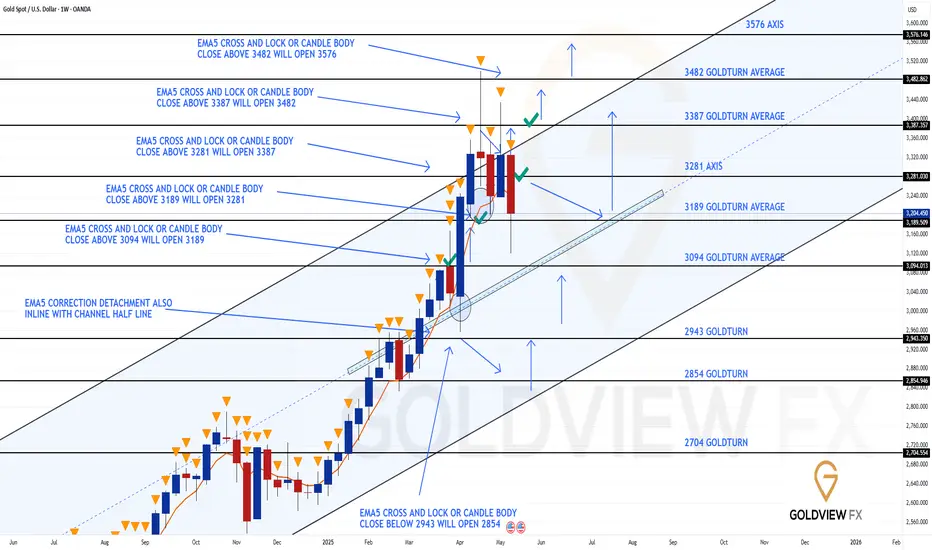
GOLD WEEKLY CHART MID/LONG TERM ROUTE MAPHey Everyone,
Here’s our weekly chart update. Once again, the Goldturn channel is proving reliable, with price action unfolding as expected. Over the past few weeks, we saw multiple attempts to break above the top of the channel, but each was rejected , confirmed by the EMA5 failing to break through.
Following this, price dropped to as low as 3189 and nearly reached 3094, aligning closely with the channels half line, a key support level we've been monitoring. We caught an early bounce there and capitalized on it using confluence from our lower time frame analysis, also shared with you all, on our 1h and 4h chart ideas.
As long as price holds above the channels half line, we’ll continue to look for bounce opportunities using levels from our smaller time frame setups. However, if price crosses and holds below the half line, it may open the door for a move toward the lower boundary of the channel.
As always, patience and precision are key. We'll continue using the 1H and 4H timeframes to buy dips on retracements into these support zones, targeting clean 20–40 pip moves. These levels and pullbacks offer ideal opportunities, especially in ranging conditions where our Goldturn method truly shines.
This is exactly why we rely on our Goldturn Channels, our proprietary system built on weighted averages. It filters the noise, helps us spot real breakouts vs. fake-outs, and gives us the confidence to act with clarity and discipline.
Thanks again for all the support, your likes, comments and follows.
MR GOLD
GOLDVIEWFX
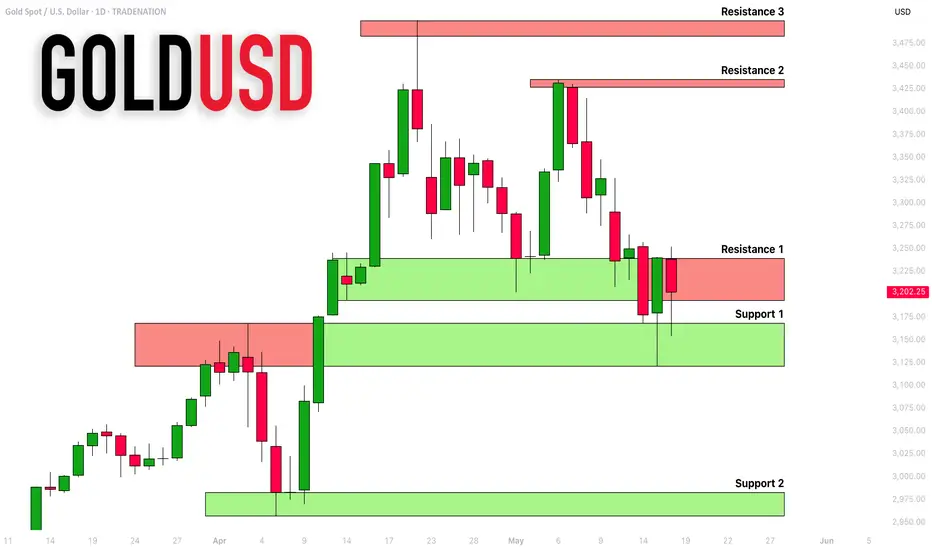
GOLD (XAUUSD): Support & Resistance Analysis For Next Week
Here is my latest structure analysis and
important supports & resistances for Gold for next week.
Support 1: 3120 - 3167 area
Support 2: 2957 - 2982 area
Resistance 1: 3193 - 3238 area
Resistance 2: 3427 - 3425 area
Resistance 3: 3483 - 3501 area
Consider these structures for pullback/breakout trading.
❤️Please, support my work with like, thank you!❤️
I am part of Trade Nation's Influencer program and receive a monthly fee for using their TradingView charts in my analysis.