GOLD DAILY CHART ROUTE MAPHey Everyone,
Quick update on our Daily chart Goldturn channel setup.
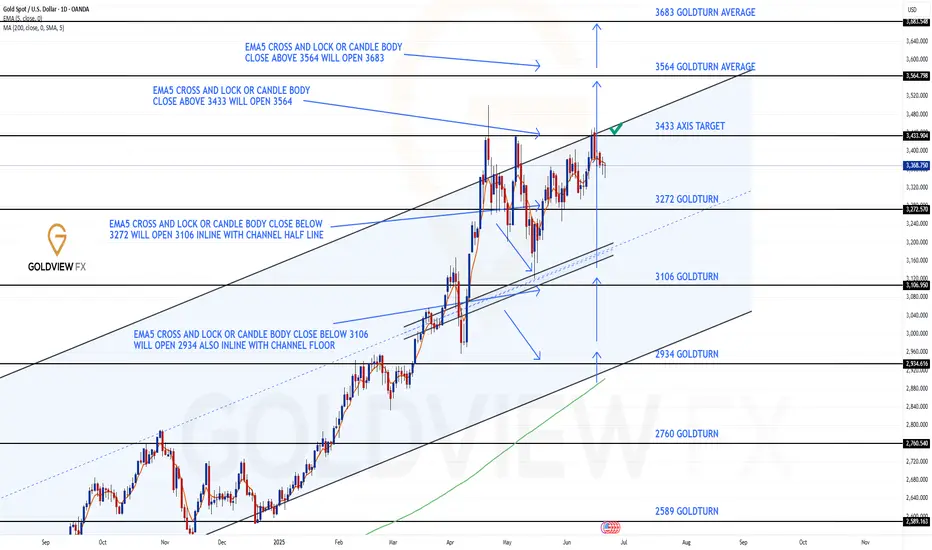
Since our last post, price action has continued to play out within the structure as anticipated but with a new development: we’ve now had the challenge and rejection at the channel top. Price challenged the 3433 axis again but failed to lock above, confirming the resistance remains firm at this level.
To confirm a continuation higher into 3564, we’ll now need to see either a blue candle body close or the EMA5 cross and lock cleanly outside the channel. Without that confirmation, we treat any move to the top as a potential fade opportunity, not a breakout.
On the downside, daily support at 3272 remains intact and continues to anchor our range structure. As long as price holds above this level, we maintain our strategy of buying dips, especially when supported by our weighted Goldturn zones on lower timeframes (1H, 4H).
This rejection further validates the precision of our Goldturn channel. The structure continues to guide us effectively filtering the noise and keeping us on the right side of the setup.
Stay disciplined. The range is still in play until we get a clear break and hold above the top.
Watch 3272 and 3433 closely. The next move will hinge on whether bulls can finally break the ceiling or if sellers continue to defend this range top.
Let the market show its hand.
Mr Gold
GoldViewFX
Goldtradingsetup
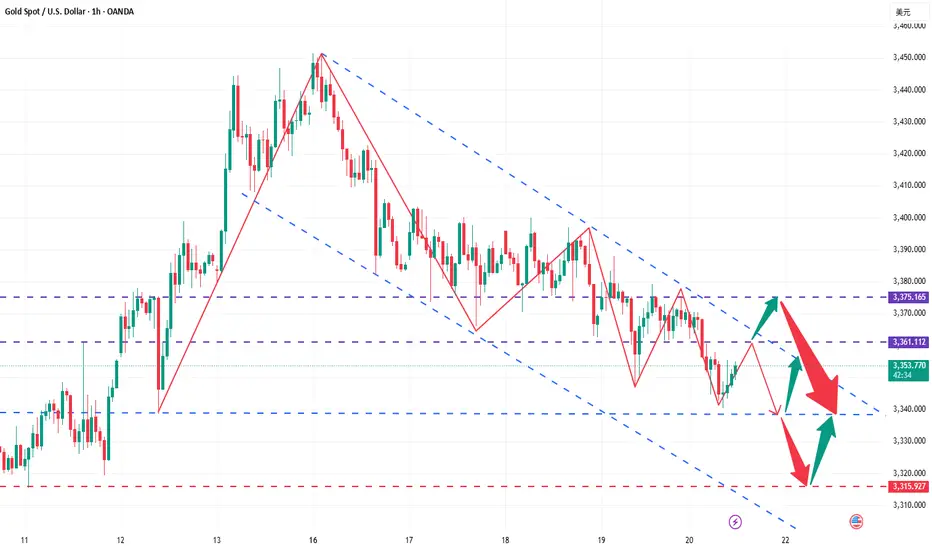
Hold on to the high point and go short decisively!Gold closed the weekly line today, maintaining the idea of oscillating downward. The 4H consecutive negatives tested the support of the lower Bollinger track. Although it was roundabout and saw-sawed, every decline would be accompanied by a new low. Therefore, hold the high point to see the bottom break and accelerate. The lower side will gradually look to 3338 and 3315. Among them, 3315 is a strong support for the weekly line. If it is not broken, you can consider going long; the upper rebound pressure is 3361 and 3375. In terms of operation, short according to the rebound strength, and the specific points are subject to the bottom 🌐 notification.
Operation suggestion: Short gold in batches near 3361-3375, with a target of 3350-3340.
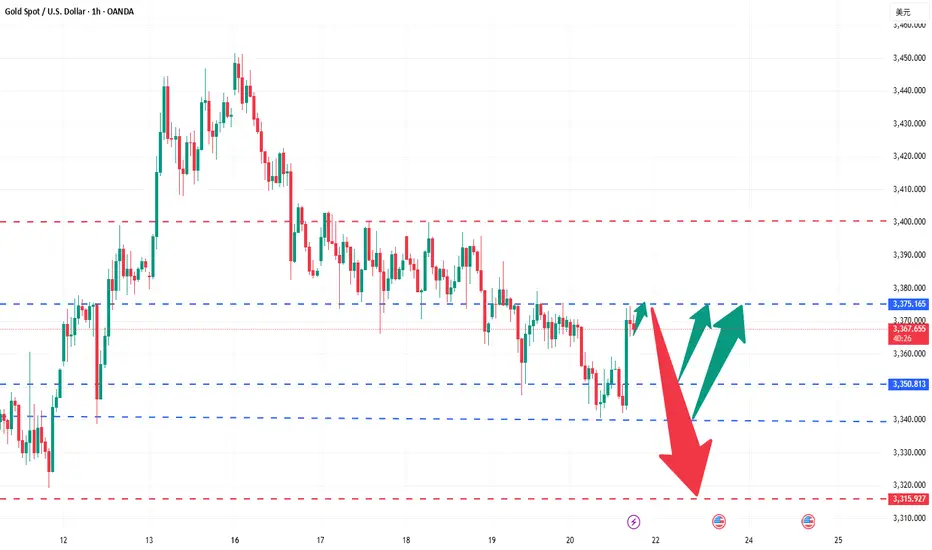
Precise short orders in 3370-3375 area are launched!Gold has been volatile recently, with intraday fluctuations ranging from 1 to 200 US dollars, which greatly increases the difficulty of operation for retail investors. On the surface, there are many opportunities, but there are only a few real big market opportunities. If you miss the rhythm, you can only watch your funds shrink. Remember that risk management is crucial.
From the 4-hour analysis of gold, there are repeated resistances from bulls before the downward break; once it breaks down, the market will go further down, and the focus below is 3340. The upper short-term is 3370-3380, and the important resistance is 3400. Only by breaking through the bulls can the rebound continue. In terms of operation, sell high and buy low, and pay attention to the breakthrough!
There are too many long orders accumulated at the current high level of gold, and the market will not rise sharply easily. The current international situation is so tense, and gold is still slowly declining. In this situation, it is difficult to rebound sharply.
Operational suggestions: For short orders above, focus on the layout of the 3370-3375 area, strictly set a stop loss, target more than 20 points, control risks, and follow the trend.
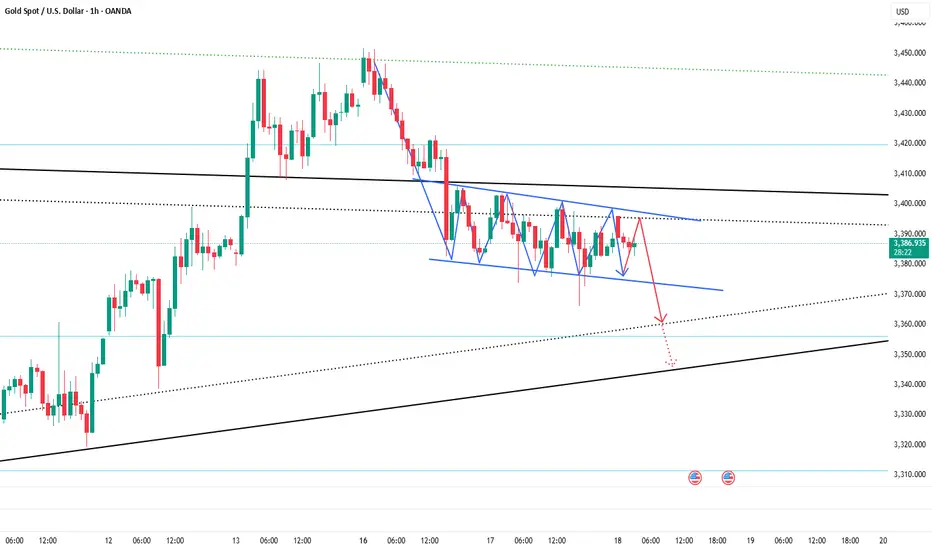
Gold breaks down, short-term bears dominate the rhythmThe Fed's June resolution kept interest rates unchanged, but Powell's remarks (expected to slow down the pace of future rate cuts) suppressed gold prices, causing gold prices to fall from around $3,396 to $3,362; the rebound of the US dollar index put short-term pressure on gold, but gold rebounded slightly when the US dollar pulled back; the conflict between Iran and Israel continued to ferment, and the safe-haven demand partially supported the gold price, limiting the decline. After several days of volatility, gold opened slightly higher today and then fell sharply to $3,347.56 per ounce, breaking the unilateral decline in the volatile trend. The 4-hour moving average is in a short position, the Bollinger band is narrowing, and the gold price is running near the lower Bollinger band. Therefore, today's operation is to rebound and short.
Operational suggestions: Arrange short positions in batches in the 3370-3385 range, follow the trend, and control risks. Target 3350-3340.

Range oscillation, strategy remains unchanged!The Federal Reserve kept the interest rate unchanged. Gold did not break through the range we gave after all. The important support below is still at 3365-3360. Today, we continue to operate in the range and keep high and low as yesterday. Gold touched the lowest level of 3362 without breaking through, and still rebounded. The long orders of 3372 and 3363 that we arranged have successfully stopped profit at 3380, so we continue to operate in the range.
From the current analysis of gold trend, gold continues to focus on the important support of 3365-3360 below, and focuses on the short-term suppression of 3400-3415 above in the short term. The operation is mainly carried out in the range for the time being, and there is a high probability of continued volatility in the short term.
Gold operation strategy: Go long when gold falls back to 3375-3370, and cover long positions when it falls back to 3365-3360, with the target of 3380-3390-3400.
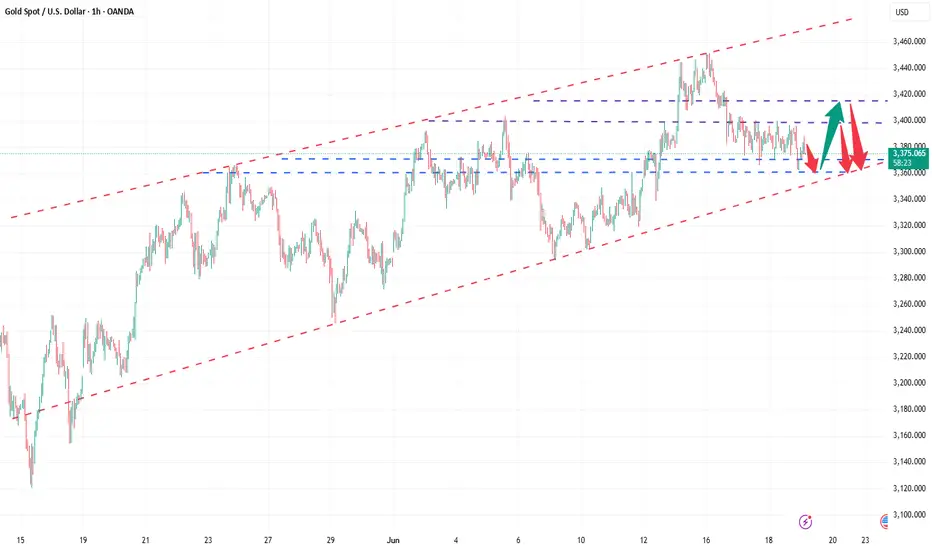
Tend to short gold, it may still retrace to 3360-3350 areaAt present, gold as a whole is still fluctuating in the 3395-3365 area. In the short term, both long and short sides are not willing to break through. They may be waiting for the guidance of the Fed's interest rate decision and Powell's monetary policy press conference. However, from the current oscillation structure, because the high point of gold rebound and the low point of retracement are gradually moving downward, the center of gravity of the candlestick chart is shifting downward, and the weight of gold shorts is slightly higher.
From the current structure, 3395-3405 has become a new round of pressure area. Gold has been unable to break through for a long time, and has tried to accelerate downward many times during the retracement process. Although it can stabilize above 3375-3365, it may be easier to break through below after several tests. Once the 3375-3365 area is broken, gold may even continue to move to the 3360-3350 area.
Therefore, within the 3395-3365 oscillation range, we can temporarily maintain the trading rhythm of selling high and buying low in the short term, while we must pay attention to the breakthrough of gold. Once gold breaks through, the trend may be continued, and we need to follow the trend to execute transactions!
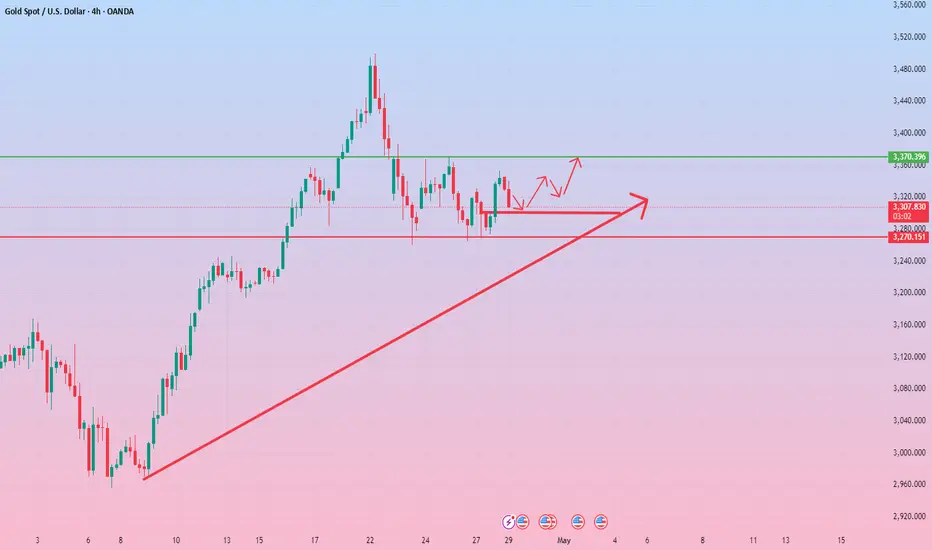
Doubletop suppressionVS multi-bottom support Entry at key pointsGold rose sharply in the U.S. market yesterday, and the daily line finally closed the Yang cross star, approaching the end of the monthly line. Recently, it has been a yin-yang cycle sweep pattern. Therefore, today we need to be careful to prevent the market from falling back and then closing in the negative range. The wide sweeping range remains at 3370-3270. If the position is broken, look at the unilateral direction. In the 4H cycle, the continuous positive pattern breaks through the mid-track, and the short-term trend is stronger. , but Bollinger has not opened his mouth, and is not optimistic about the breakthrough range. The short-term support is around 3315, which is also yesterday's low point. If it falls below, it will go to 3302. Therefore, today's operation will continue to grasp the key positions. The upper pressure will focus on 3354 and 3370, and the lower support will focus on 3315 and 3300. Go high and low in the range! Do high-altitude and low-multiple in the range!
Operation suggestion: Buy gold near 3305-3300, look at 3320 and 3345!
Gold Ideas for 14th of April📊 Market Structure Overview
Trend Analysis: Price has reached premium levels, suggesting a potential for short-term pullbacks within the broader bullish trend.
Key Levels: Monitoring for breaks below 3025 to signal a shift in macro bias.
🔑 Key Technical Zones & Confluences
Premium Sell Zone: 3248–3268, characterized by unmitigated order blocks and potential liquidity traps.
Internal Demand Zone: Around 3180, aligning with trendline support and Fibonacci retracement levels.
Strong FVG & Order Block: 3137–3145, indicating a significant area of interest for potential reversals.
📝 Plan of Action
🔻 Sell Scenario 1
Entry: 3242 – 3248
Stop Loss: 3255
Take Profits: TP1: 3215 | TP2: 3188 | TP3: 3160
Rationale: Anticipating rejection from fresh M15 order block with liquidity sweep above 3242. RSI divergence noted as additional confluence; confirmation required on M5.
🔻 Sell Scenario 2
Entry: 3260 – 3268
Stop Loss: 3275
Take Profits: TP1: 3235 | TP2: 3200 | TP3: 3165
Rationale: Targeting final premium order block with unmitigated H1 zone and imbalance. Ideal for NY session traps; look for bearish engulfing patterns.
🟢 Buy Scenario 1
Entry: 3180 – 3172
Stop Loss: 3165
Take Profits: TP1: 3205 | TP2: 3230 | TP3: 3250
Rationale: Confluence of trendline and M30 order block with internal structure support. Requires bullish price action and CHoCH on M5 for confirmation.
🟢 Buy Scenario 2
Entry: 3137 – 3142
Stop Loss: 3129
Take Profits: TP1: 3180 | TP2: 3205 | TP3: 3240
Rationale: Major imbalance and H1 order block with RSI confluence. Look for bullish engulfing or aggressive CHoCH on lower time frames.
📌 Key Zones Recap
Premium Sell Zone: 3248–3268
Internal Demand Zone: 3180
Strong FVG & OB: 3137–3145
Critical Support: 3025 (break indicates macro bias shift)
📌 Important Notice!!!
The above analysis is for educational purposes only and does not constitute financial advice. Always compare with your plan and wait for confirmation before taking action.
📣 If this strategy sparked clarity, hit that like button and follow our community for more in-depth ideas. 💛

Gold ideas/scenarios for Tuesday April 8th
📉 Intraday Bias: Bearish below 2980–3000 supply
🔻 SELL SCENARIOS
🟥 SETUP 2: Liquidity Spike Short
📍 Entry: 3010–3015
🧠 Why: Liquidity hunt above 3000 + bearish FVG
🎯 TP1: 2975
🎯 TP2: 2940
🛑 SL: 3019
🟥 SETUP 3: EMA Fade Shot
📍 Entry: 3035–3040
🧠 Why: EMA50 touch + trendline confluence on H1
🎯 TP1: 2990
🎯 TP2: 2950
🛑 SL: 3046
🟩 BUY SCENARIOS
🟩 SETUP 1: Discount OB Bounce
📍 Entry: 2945–2955
🧠 Why: M30 OB + FVG + golden fib (0.618)
🎯 TP1: 2990
🎯 TP2: 3030
🛑 SL: 2938
🟩 SETUP 2: Demand Retest Play
📍 Entry: 2905–2915
🧠 Why: H4 OB + prior bounce structure
🎯 TP1: 2960
🎯 TP2: 3000
🛑 SL: 2895
🟩 SETUP 3: Deep Demand Sweep
📍 Entry: 2885–2895
🧠 Why: HTF demand zone + imbalance + psych level 2900
🎯 TP1: 2950
🎯 TP2: 2980
🛑 SL: 2878
⚔️ Key Levels to Watch
🔸 2980–3000 → OB resistance
🔸 2960–2950 → Reaction zone
🔸 2915 / 2890 → Liquidity pools
🔸 3045 → Bearish bias invalidation
🔸 2880 → Final boss demand
🧠 Execution Tips
Let price come to you — snipers don’t chase.
Watch M1–M5 for CHoCH or clean PA shift.
Trade the setup, not your FOMO.
💬 Gold might throw tantrums, but your plan doesn’t have to.
📌 Important Notice!!!
The above analysis is for educational purposes only and does not constitute financial advice. Always compare with your plan and wait for confirmation before taking action.
📣 If this strategy sparked clarity, hit that like button and follow.
Let’s build a community that doesn’t gamble — we execute.
No panic. No rush. Just structure, strategy, and savage entries. 💛
Gold (XAUUSD) 30-Min Analysis – Key Levels & Trade SetupPrice Levels:
Current price: 3,126.01
Resistance: 3,136.82 (stop-loss level for short trades)
Support: 3,105.97 (target level for short trades)
Another resistance at 3,155.07 (target level for long trades)
Moving Averages:
EMA 200 (blue line): 3,095.57 – Long-term trend indicator; price is above, indicating a bullish bias.
EMA 30 (red line): 3,123.69 – Short-term trend indicator; price is currently near this level.
Trading Strategy:
The chart appears to be showing a possible short trade setup if price rejects resistance at 3,129.62 - 3,136.82.
If price moves below 3,123.69, it could indicate downside momentum toward 3,105.97.
Alternatively, a breakout above 3,136.82 could trigger a move toward 3,155.07.
Risk/Reward Analysis:
Short setup: Entry near 3,129.62, stop-loss around 3,136.82, target 3,105.97.
Long setup: Entry above 3,136.82, stop-loss below 3,129.62, target 3,155.07.
Conclusion:
Bullish Scenario: If price breaks 3,136.82, a move toward 3,155.07 is likely.
Bearish Scenario: If price stays below 3,129.62, it could drop toward 3,105.97.
EMA 30 as dynamic support/resistance: Watch for price reaction around 3,123.69.

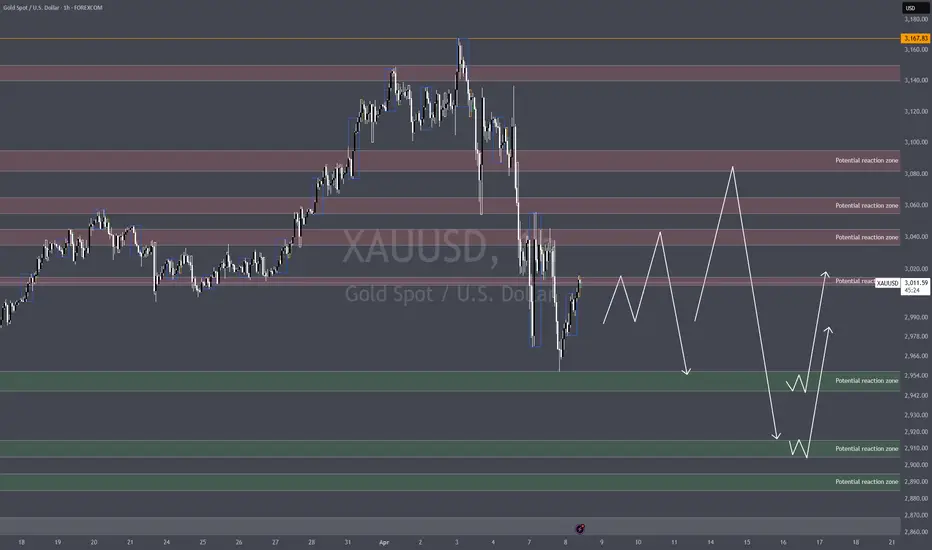
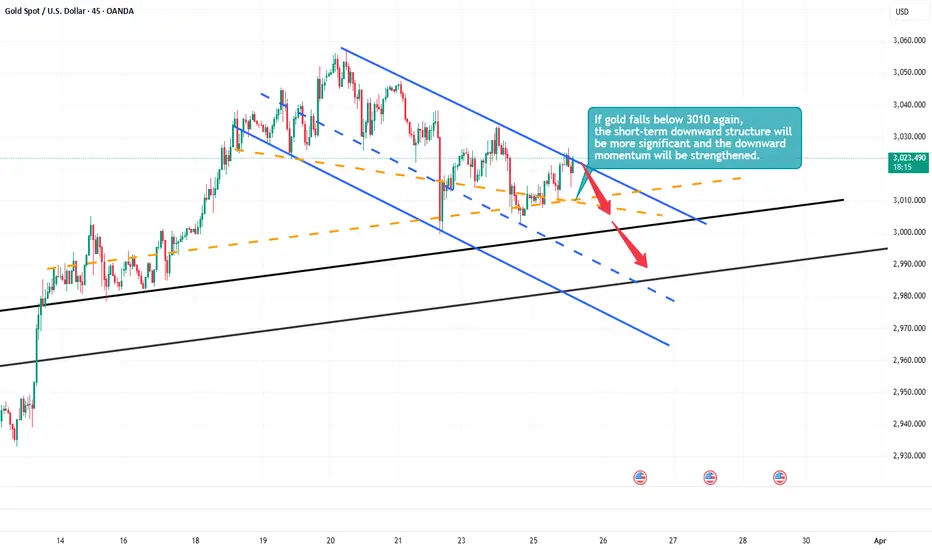
Gold Likely to Extend Decline Toward the 2995-2985 ZoneGold encountered resistance and pulled back after reaching around 3026 during the rebound, failing to break the descending channel effectively. In the short term, bearish momentum remains dominant. On the daily chart, gold has closed with three consecutive bearish candlesticks, it weakens rebound expectations and suggests further downside remains possible.
The key short-term level to watch is around 3010. If gold breaks below this level during the pullback, the downtrend structure will become more pronounced. This would likely lead to another test of the 3000 level, with further downside potential extending toward the 2995-2985 range.
I remain committed to shorting gold on rebounds. My primary plan is to enter short positions within the 3020-3030 range. I will make more detailed trading plans and trading signals every day according to the real-time market situation, which is also the testimony of every successful transaction and profit of mine; the article has a certain lag, if you want to copy the trading signals to make a profit, or master independent trading skills and thinking, you can choose to join the channel at the bottom of the article
Seize the callback opportunity to go long goldBros, after hitting a high near 3057, gold fell back as expected. It has now fallen back to around 3030.
📍Although the fall in gold was expected, the strength of the fall was less than expected. According to the current strength of the fall, gold may not be able to form an effective downward force. It is more likely to attract friends who missed the entry ticket in the early stage to enter the market again to buy gold;
📍After the breakthrough, there are many supports below. It may be difficult to break through the heavy support area in a short period of time. The primary support below is in the 3025-3015 area. We can try to buy gold with this area.
🔎Xauusd:@3030-3020 Buy
📩Trading means that everything has results and everything has feedback. I have been committed to market trading and trading strategy sharing, striving to improve the winning rate of trading and maximize profits. If you want to copy trading signals to make a profit, or master independent trading skills and thinking, you can follow the channel at the bottom of the article to copy trading strategies and signals

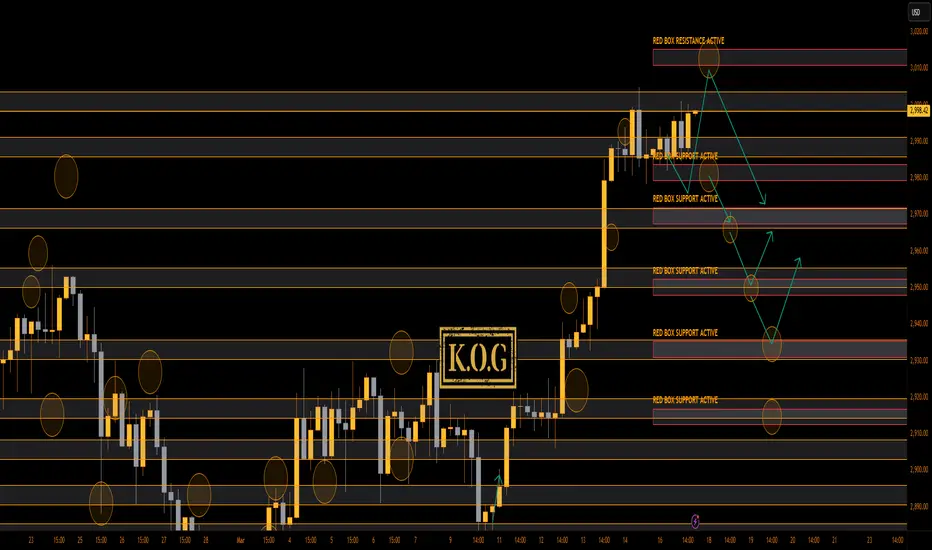
THE KOG REPORT - UpdateEnd of day update from us here at KOG:
Not a bad start to the week with the lower Red box support which was active holding price and giving the push up early session completing the first red box target. Since that we've experience accumulation and ranging which allowed us a short trade on the indicator and then a nice long to end the day, which is now protected and managed.
We'll stick with the plan at the moment expecting a spike up with the first region being 3006 and above that 3010. Again, a bit high to even attempt a long as traders will want to see if we can hold above the 3000 level, until then, we'll look for the potential RIP.
KOG’s bias for the week:
Bearish below 2995 with targets below 2970, 2965, 2955 and below that 2950
Bullish on break of 2995 with targets above 3003, 3006, 3010, 3016 and above that 3020
RED BOXES:
Break above 2995 for 2997✅, 3003, 3009, 3016 and 3021 in extension of the move
Break below 2980 for 2975, 2971, 2965, 2959, 2955 and 2945 in extension of the move
Short and simple this week, let’s see how the week plays out and remember, your risk model is there to protect you, use it, keep your losers small and your winners big!
Please do support us by hitting the like button, leaving a comment, and giving us a follow. We’ve been doing this for a long time now providing traders with in-depth free analysis on Gold, so your likes and comments are very much appreciated.
As always, trade safe.
KOG
Short positions are in trouble, how to get out of trouble?Bros, gold accelerated to above 2980 today under the stimulation of news. If you hold a short position in gold, you must be in a trading dilemma, so how to get rid of the trading dilemma has become the current primary goal.
First remember the key node, Thursday. Under normal circumstances, Thursday and Friday are the nodes most likely to cause market changes! And from the candle chart, it is just pulled back to the high area with the stimulation of news. From the regional conversion, we can clearly see that according to the current momentum of gold, it will only reach the area around 2980-2982 (there may be a technical false breakthrough). It is difficult to rise to the vicinity of the 3000 mark in one fell swoop.
If you still have sufficient margin levels to help you get out of trouble, you might as well consider adding more positions near 2980 to continue shorting gold, effectively raising your average cost price. After gold falls back, you can choose to close all short positions and turn losses into profits. However, because gold has risen sharply, we must lower our expectations for the extent of gold's retracement. If gold retraces to the 2940-2930 area, we can consider closing our positions, so that we can turn losses into profits! And I predict that gold will enter a correction market tomorrow at the latest!
Trading means that everything has results and everything has feedback. I have been committed to market trading and trading strategy sharing, striving to improve the winning rate of trading and maximize profits. If you want to copy trading signals to make a profit, or master independent trading skills and thinking, you can follow the channel at the bottom of the article to copy trading strategies and signals
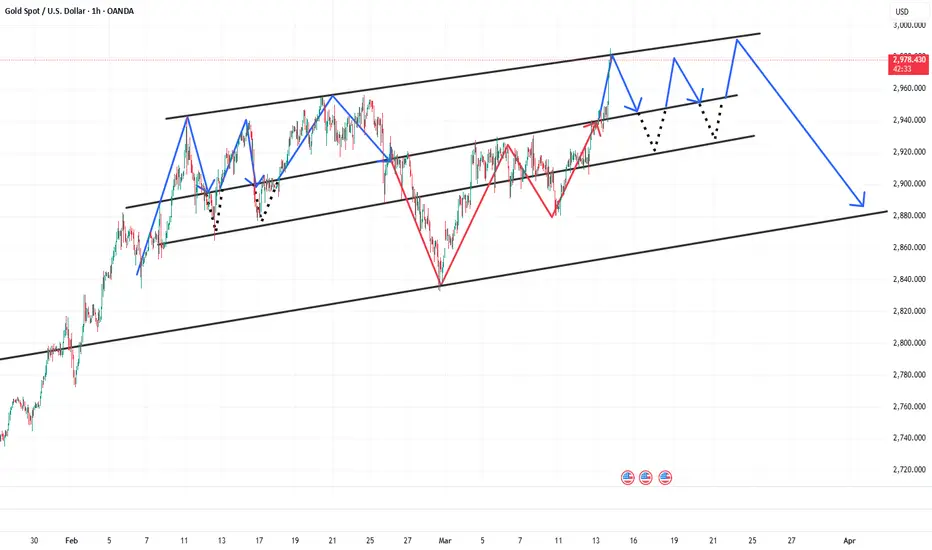
GOLD DAILY CHART MID/LONG TERM UPDATEHey Everyone,
This is an update on our daily chart idea that we are now tracking and playing out perfectly, as analysed.
2904 AXIS target was hit last week completing this level and also into the channel top for the perfect finish and rejection.
We now have body close above 2904 AXIS but will need ema5 lock to confirm 2959, although the channel top is acting as resistance and therefore will need some ranging movement within the channel so it can slowly ascend into the 2959 respecting the channel dynamics.
We also need to keep in mind the channel half line below to establish floor to provide support for the range. A break below the half line will open the lower part of the channel to establish floor on the channel bottom.
This is the beauty of our Goldturn channels, which we draw in our unique way, using averages rather than price. This enables us to identify fake-outs and breakouts clearly, as minimal noise in the way our channels are drawn.
We will use our smaller timeframe analysis on the 1H and 4H chart to buy dips from the weighted Goldturns for 30 to 40 pips clean. Ranging markets are perfectly suited for this type of trading, instead of trying to hold longer positions and getting chopped up in the swings up and down in the range.
We will keep the above in mind when taking buys from dips. Our updated levels and weighted levels will allow us to track the movement down and then catch bounces up using our smaller timeframe ideas.
Our long term bias is Bullish and therefore we look forward to drops like this from rejections, which allows us to continue to use our smaller timeframes to buy dips using our levels and setups.
Buying dips allows us to safely manage any swings rather then chasing the bull from the top.
Thank you all for your likes, comments and follows, we really appreciate it!
Mr Gold
GoldViewFX

Gold trading zones: 22-Jan-2025Hey traders! Check out today's Gold trading zones and let's discuss potential opportunities.

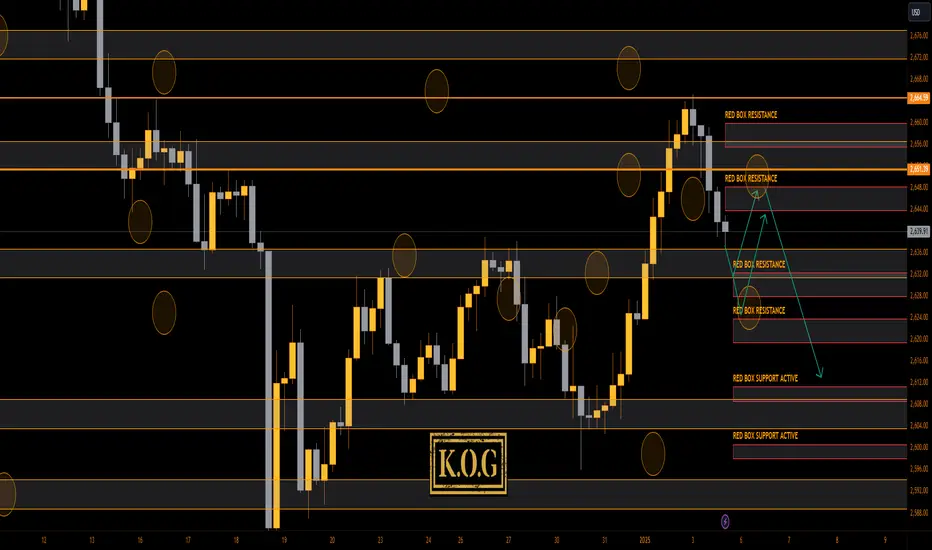
THE KOG REPORT THE KOG REPORT:
In last week's KOG Report we said we would look for two levels from the open to be attempted where we wanted to short the market. The first level of 2630-5 worked extremely well for us giving us a level to level, point to point short into the red box region and target level we had shared. This move completed a majority of our bearish targets apart from one, also giving us the opportunity to then long back up into the Excalibur targets we had above.
During the later part of the week we shared the updated chart and gave the levels again to attempt the short, and again, a pinpoint short came from the level we wanted and we closed the week with runners left on those trades.
Another decent week in Camelot, not only on Gold but also the other pairs we trade and analyse giving us a 15 out of 16 targets completed.
So, what can we expect from the week ahead?
To start, we have NFP towards the end of the week, so we’ll use this report for the first half of the week and then release the NFP KOG Report with our view per-event. After the bearish move on Friday, we’ll be looking for a base during the early sessions, potentially deeper into the 2625-30 region before then attempting the long trade back up to target the resistance levels. It’s those resistance levels 2640 and above that again the 2650-55 region that need to be monitored this week for the break, if held, further opportunities may be available to short again unless broken. We’re still in the larger range with key level support 2605 and resistance sitting way up at 2670-75 so it gives us some idea of the play.
If we do break above that 2550 level and hold with a close, we'll look higher again into the range high trading level to level.
KOG’s bias for the week:
Bullish above 2630 with targets above 2650, 2655 and above that 2667
Bearish below 2630 with targets below 2624, 2620, 2610 and below that 2604
RED BOXES:
Break above 2640 for 2646, 2650, 2659 and 2670 in extension of the move
Break below 2625 for 2620, 2617, 2610 and 2604 in extension of the move
Please do support us by hitting the like button, leaving a comment, and giving us a follow. We’ve been doing this for a long time now providing traders with in-depth free analysis on Gold, so your likes and comments are very much appreciated.
As always, trade safe.
KOG
Actionable Gold insights: 30-Dec-2024Rise and shine, traders! Start your day with actionable Gold insights. Let's grow your skills together, one chart at a time.

Actionable Gold insights: 27-Dec-2024Rise and shine, traders! Start your day with actionable Gold insights. Let's grow your skills together, one chart at a time.

Gold Market Analysis: 12-Dec-2024Gold trading insights: Not signals, but informative zones to aid your decision-making. Please note: These zones are not trading advice. Use them as a starting point for your own analysis.


Gold trading zones: 09-DEC-2024Your daily Gold trading briefing: Zones, insights, and opportunities.

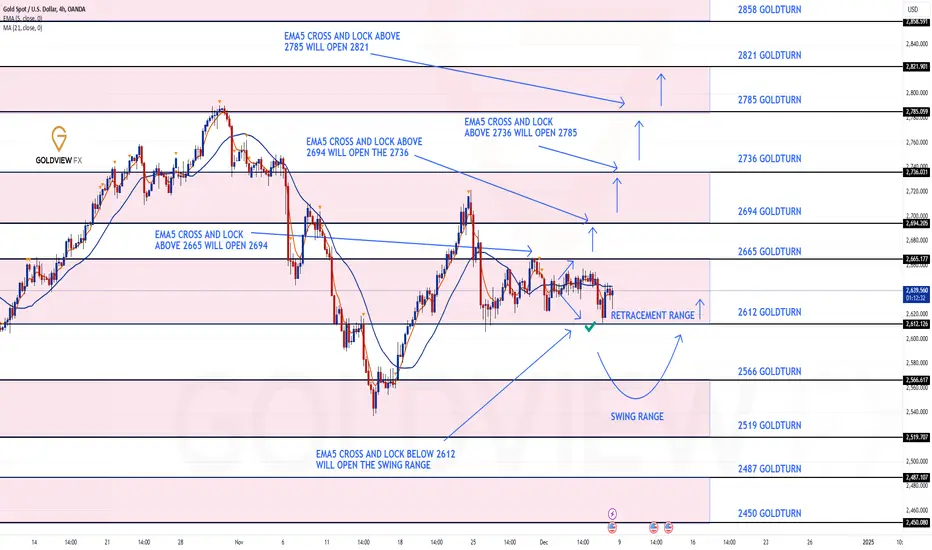
GOLD ROUTE MAP UPDATEHey Everyone,
A Piptastic finish to the week with our chart levels respecting and playing out like we analysed.
We tracked and traded the 1H chart all week, which was playing in a tight range, allowing us to use the weighted levels for the bounces throughout the week, taking advantage of the 30 to 40 pip weighted bounces.
This is now the 4h chart that we shared on Sunday and as you can see the retracement range was tested to perfection today, clearing 2612 bearish target, followed with the bounce just like we stated, completing the week with a bag full of pips.
We will now come back Sunday with our updated Multi time-frame analysis, Gold route map and trading plans for the week ahead.
Have a smashing weekend!! And once again, thank you all for your likes, comments and follows, we really appreciate it!
Mr Gold
GoldViewFX