Gold 21/07 Ambition TP 2000$.Gold prices rose in the Asian session on Thursday, hitting their highest in more than two months as weak UK inflation data led many to bet that global interest rates were nearing a peak, while a weaker dollar also helped.
The yellow metal is currently about $15 away from $2,000 a wish.
GOLD zone 1972 - 1975
Stop Loss : 1980
My taget is: 1968-1955
Note: Installing TP SL fully wins the market and is safe in trading
Goldtradingsetup

XAUUSD: 18/7 Gold Trading StrategyGold analysis: The gold short trading signal shared yesterday entered the market around 1959 and successfully made a profit.
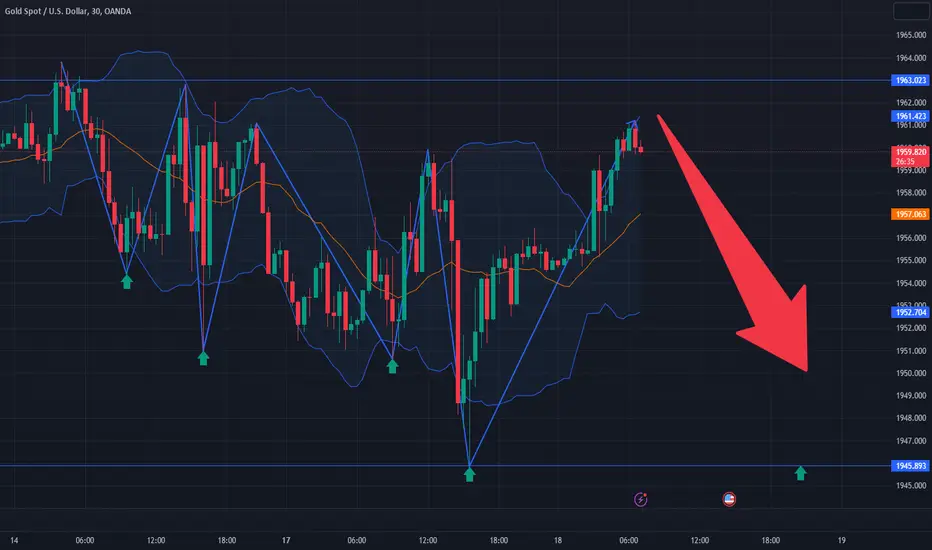
Gold soared higher and fell back yesterday. The previous corrections have come to an end for the time being, and it is unknown whether the bulls can successfully take over and continue to attack the short-term high of 1963. At present, since gold rose to the high point of 1963, the trend has retraced and fluctuated sideways. Under this trend, we only need to confirm the range, and sell high and buy low within the range. We can see that the support position of the low point below has been moving up, especially the recent low point of 1945, which can be regarded as a new support level in the short term. At present, the resistance has changed to support, and the rise of gold is still relatively strong. Regardless of whether you are long or short, we just enter the market when we have a chance and make money.
Back to the topic, gold fell to the lowest point of 1945 on Monday and then began to rebound. The overall operation was above the 1954 line until the close, and the willingness of the bulls can be clearly seen. So today's operating strategy:
SELL: 1965~1968
TP1: 1958
TP2: 1955
BUY: 1950~1945
TP1: 1955
TP2: 1960
xauusd:The support level 1965 has a huge upside
Gold formed a big positive line yesterday and rose in volume, confirming the stable situation after stepping back to 1946 the day before. It broke high again the next day, closed at a high level, and continued to stabilize at a new high level. It hit a recent new high of 1985, getting closer and closer to the 2000 integer mark. There is a little room for release today, and it is expected to touch the 2000 mark. At present, the daily line closes at a high level, and the short-term will continue to rise moderately. Judging from the K-line shape and the moving average indicators, gold has formed multiple divergent patterns, and with the upward moving average indicators, it has formed a supportive upward trend. The breaking high of 1963 has also been converted into a support level.
Overall, gold continued its upward momentum, breaking highs became support. Continue to be bullish today, and it is expected to gradually break through the 2000 mark.
gold buy 1968-1973 tp 1990-2000

Gold 7/19- FED, USD and Gold - Trader's battleAll eyes are now on the Fed and what they will do with rates when policymakers sit down on July 26 to decide on rates.
While the Fed's so-called Federal Open Market Committee decided to pass a rate hike last month, economists think they will most likely vote for a 25 basis point increase this time around. consistent with recent rate hikes.
BUY GOLD zone 1962 - 1965
Stop Loss : 1957
My taget is: 1970$ - 1985$
Note: Installing TP SL fully wins the market and is safe in trading

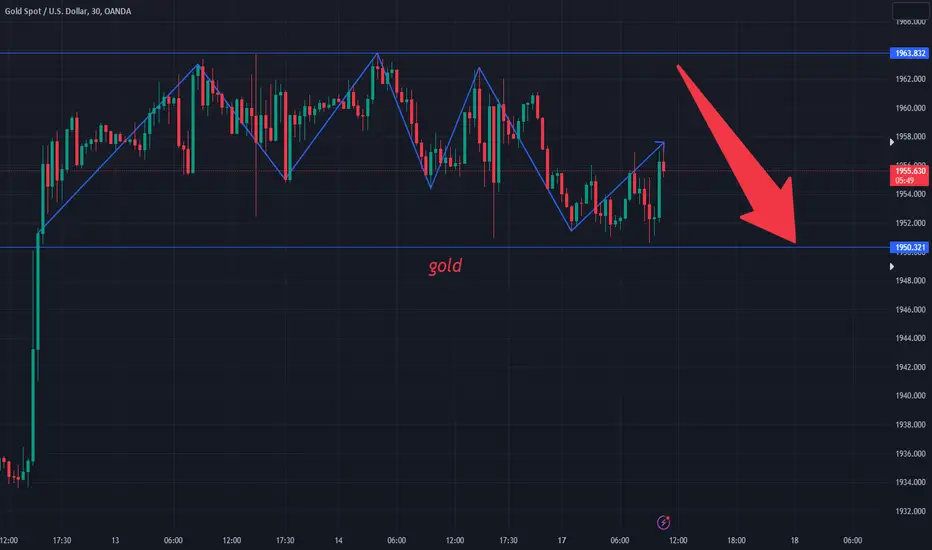
XAUUSD: 17/7 Trading StrategyToday's gold analysis: Friday's multi-single strategy, after gold fell to the 1950 position, gave an opportunity to enter the market. Finally, take profit and leave the market at the 1959 position.
Today we need to pay attention to the support position of the 1940 position, while the above needs to pay attention to the breakout of the 1963 position. This wave of rebound and correction last week failed to close at a high level, and returned to the shock below 1960. There was a slight signal of stopping the decline, the upward trend could not be continued, and the short-term turned short again, which was also a correction due to the previous rapid rise. Last Friday, DXY also showed signs of stopping the decline, but the rebound was very small. The main idea for gold this week is to return to the previous sell high and buy low.
Back to the topic, since gold rose to the upper high of 1963 and the low of 1950 on Wednesday, it has been tested back and forth many times, but in the end all failed, and it has never been able to break through. This week is mostly about waiting for a breakthrough to go in a new direction.
Today's strategy:
BUY: 1945-1940
TP1: 1950
TP2: 1955
SELL: 1960-1965
TP1: 1955
TP2: 1950
Gold 1960 will be the key to choose the directionIt is recommended to go short around 1960, stop loss at 1965, and hold the target at 1950. For long orders, first look at the situation of 1950 support breakout.
Contact me for specific trading signals
Gold Daily TFI anticipate that gold will experience a healthy retracement following a bullish flag breakout.
Starting from June 6th, the Dow Jones has been declining, but it has now discovered support and is responding positively from a -0.27 weekly Fibonacci target. In my observation, the Dow Jones appears poised to rise, while gold seems likely to begin a downward movement.

XAUUSD GOLD Sell Trade IdeaXAUUSD - GOLD - Market Analysis
Smart-money concepts / Institutional trading strategy
Thursday price started to slow down after creating new highs earlier in the week.
Following structure from the 4H down to the daily, we can see very clear breaks of structure towards the down-side.
Entry is based on 4 of my confirmations including Risk:Reward over 1:5.
Could take gold lower but will be waiting for further price action when market opens.

Inflation cools down, Fed may raise interest rates for the last In general, inflation data in June 2023 can help the Fed "breathe a sigh of relief". However, central bank officials often focus more on core inflation, which is still well above the Fed's 2% target.
As core inflation remains more than double the Fed's 2% target, traders believe the Fed will raise rates by 25 basis points at its meeting on July 25-26, 2023. However, they think the probability of the Fed raising one more time is quite low, about 25%, down from more than 33% before.
BUY GOLD zone 1943-1940
Stop Loss : 1935
Take Profit 1: 1945
Take Profit 2: 1950
Take Profit 3: 1960
Note: Installing TP SL fully wins the market and is safe in trading

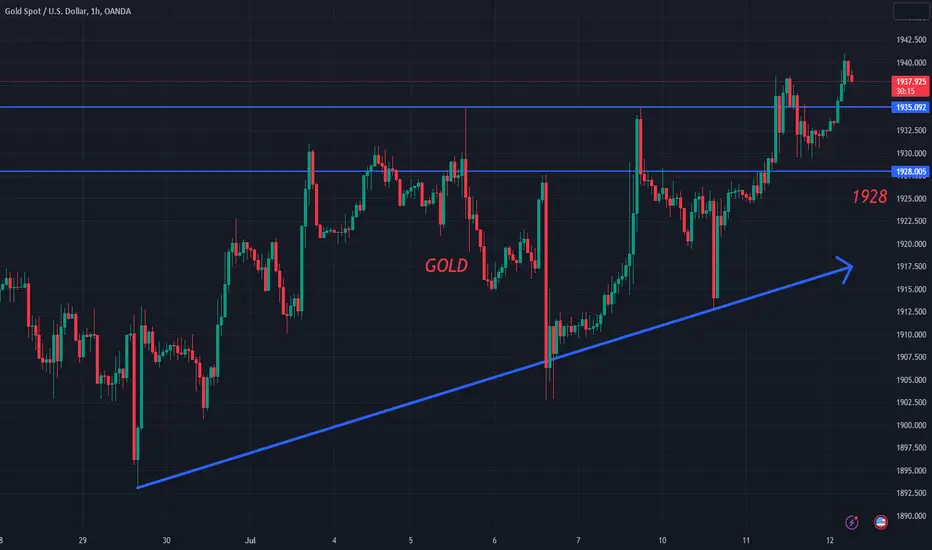
XAUUSD: About today's CPI strategy within the dayYesterday, gold directly broke through the previous double top of 1935, which broke the previous standard shock range. Therefore, the trend of trading is a bit unclear, and the long and short positions are a bit difficult to ride. Although it has broken through 1935, there is no unilateral pattern, so it is difficult to be optimistic about a big rise, but it has already broken through 1935, and it is difficult to see a big drop, so shorting is also more difficult.
From the perspective of cycle technology, the daily line has risen slowly since last week, Lianyang has risen, and since it broke the 1935 double top, it has begun to stand firmly above the Bollinger middle track of the daily line cycle. Then, this wave of gold is on the track in the daily line The demand at the high point of 1955, therefore, try to do long-term long-term transactions in the near future, and short-term retracement. However, there is no clear unilateral state in the H4 cycle. At least for the time being, Bollinger has not opened his mouth. Therefore, there is still the possibility of falling back and oscillating. Then, the key within the day is to look at the size of the falling space. The lower support is at 1928, 1920. If the Asian-European market falls below 1928, gold will enter the shock cycle again
The U.S. market may use the CPI data to scan the market up and down, and the range is expected to be 1940/1912. If the Asian-European market does not fall below 1928, it can continue to increase on the support of 1928. Continue to look up and break the position. The U.S. market may use the CPI data to rush higher. Focus on 1940 and 1955 above. Therefore, the whole day market focuses on the gains and losses at 1928 points. For transactions before the intraday CPI data comes out, if gold slowly rises to around 1940, you can short-sell to see the room for a fall, and then combine the above-mentioned key points to see the gains and losses, and then decide whether to keep the short order.
CLEAR BULLISH Gold Trend? (READ FULL)TVC:GOLD
CAPITALCOM:GOLD VELOCITY:GOLD NYSE:GOLD ACTIVTRADES:GOLD OANDA:XAUUSD FOREXCOM:XAUUSD
PEPPERSTONE:XAUUSD EIGHTCAP:XAUUSD
-
Welcome back, traders! Make sure to bookmark this page for regular market analysis. Today, we're diving into the technical analysis and forecast for the XAU/USD pair, also known as gold. So let's get started!
Gold has soared to new heights, reaching a high of 1962. The recent release of CPI data triggered a free fall in the dollar, further fueling the bullish momentum for gold. The lack of support for the dollar, with the last significant level at 100.80, paints a negative picture for the Dollar Index (DXY). As sellers dominate the market, the DXY faces a potential decline towards double-digit figures, suggesting a favorable environment for gold.
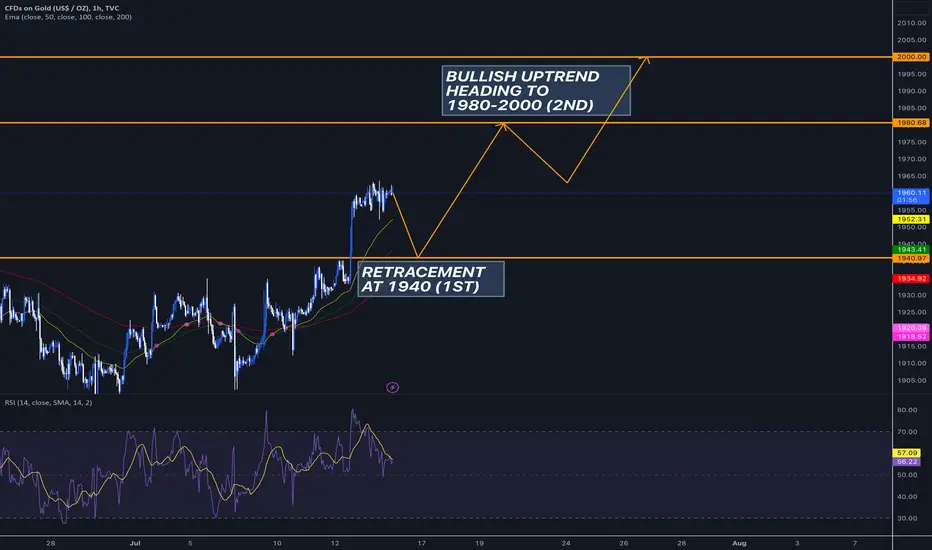
Turning our attention to the gold market itself, it's undeniable that the precious metal is experiencing a strong bullish trend. A notable structural change has occurred in recent days, with gold transitioning from forming lower lows and lower highs to higher lows and a breakthrough of previous resistance levels.
This shift in the market structure presents an excellent opportunity for swing traders to consider taking a long position in gold. The next target for gold lies within the range of 1980 to 2000. A breakthrough above the significant 2000 level could potentially propel gold to new all-time highs, offering even greater opportunities for traders.
Now, let's discuss the trading strategies that can be employed to capitalize on the current market conditions. Given the overbought nature of the market, buying on retracements is a prudent approach. Waiting for a retracement allows for an improved risk-to-reward ratio. During the European session, if gold exhibits a deep retracement or displays a few red candles, it may be an opportune time to consider a buy position around the 1940 level.
Keep in mind that 1940 previously served as a strong resistance level. Given recent developments, it is likely to act as a support level going forward. However, considering the current market price around 1956, it's important to acknowledge the distance between the current price and the desired entry level. In such cases, an alternative support level to watch is around 1945, which may provide a viable bounce opportunity.
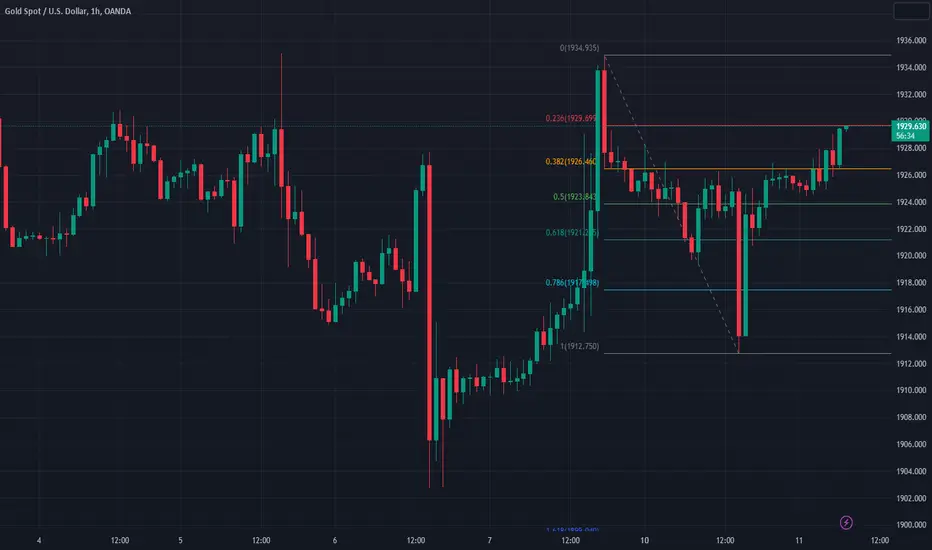
To confirm these levels, it's beneficial to utilize the Fibonacci retracement tool. By drawing the Fibonacci retracement from the lowest to the highest point on the chart, we can identify the 0.236 retracement level aligning with 1945, further reinforcing its significance as a potential support level.
In summary, if gold retraces to these identified levels and finds support, it presents an attractive opportunity to enter long positions. However, always exercise strict risk management principles to safeguard your trading capital. In the event of an unexpected deeper retracement, it is crucial to be prepared and adjust your trading strategy accordingly.
That concludes today's analysis of the XAU/USD pair. Remember, market analysis is subject to change, so conduct thorough research and analysis before making trading decisions. Be a trader, not a gambler. Follow strict risk management guidelines, and trade wisely.
Thank you for reading, and stay tuned for more updates on the exciting world of trading gold.
GOLD ( XAUUSD ) Long Term Trading IdeaHello Traders
In This Chart GOLD HOURLY Forex Forecast By FOREX PLANET
today nzdcad analysis 👆
🟢This Chart includes_ (GOLD market update)
🟢What is The Next Opportunity on GOLD Market
🟢how to Enter to the Valid Entry With Assurance Profit
This CHART is For Trader's that Want to Improve Their Technical Analysis Skills and Their Trading By Understanding How To Analyze The Market Using Multiple Timeframes and Understanding The Bigger Picture on the Charts

Inflation Cools, Gold Heats UpIn June, the United States inflation fell to 3%, which is the lowest since March 2021. This was slightly below the market's expectations of 3.1% and a significant decline from May's rate of 4%. Additionally, the core inflation rate unexpectedly dropped to 4.8%, marking its lowest level since October 2021.
The implication of this deceleration is that it could prompt the Federal Reserve to scale back its plans for interest rate hikes. With inflation showing signs of cooling, the central bank may now be inclined to raise rates only once more throughout the remainder of the year.
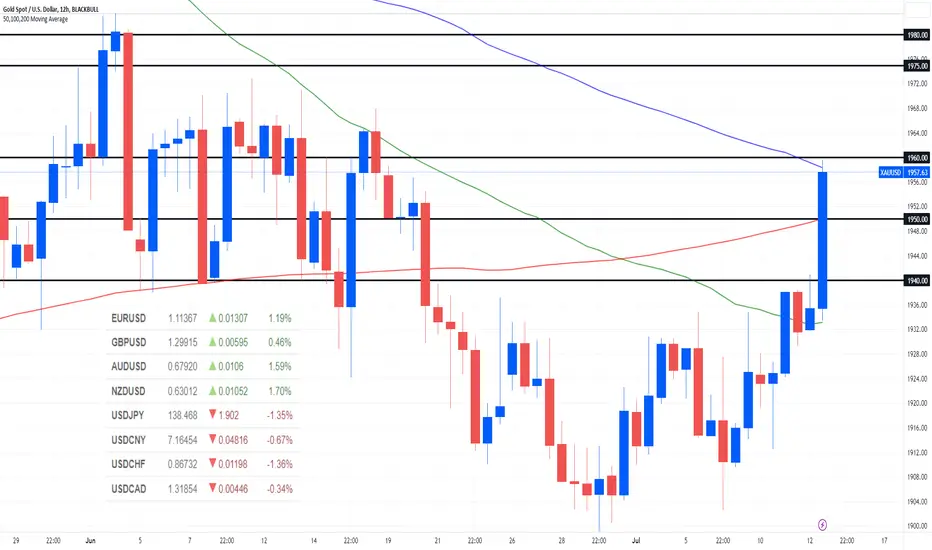
In the wake of the inflation report gold prices shot up, soaring by more than 1.3%. The metal breached the $1,940 resistance level but fell just short of clearing the $1,960 overhead barrier. If further upward momentum materializes, it could pave the way for a potential retest of $1,975 and $1,980.
At the same time, the US dollar faced a steep decline, sinking to its lowest point in over 14 months. Against the Swiss franc, it tumbled to depths not witnessed since early 2015, settling at 0.8673 francs, down 1.4%. Earlier in the session, it even touched 0.8660, marking its weakest position since the Swiss National Bank abandoned the Swiss currency peg back in January 2015. Against the Japanese yen, the dollar hits a six-week low of 138.47 yen, witnessing a 1.4% decline. Additionally, the US dollar weakens by more than 1.5% against the New Zealand and Australian dollars. Conversely, the euro surges to its highest level since March last year, reaching $1.1125. The Euro trades up 1.2% at $1.113.
Gold Daily TFI am presently anticipating the possibility of gold surpassing the 1940 mark. Once it achieves this, gold's upward momentum is expected to intensify. Today at 1:30 PM, we have the CPI data, so let's observe the outcome.
Gold has successfully broken out of a bullish flag pattern, and I predict a retracement to the flag's lower boundary, followed by a further upward movement. This will allow gold to reenter the channel and continue its bullish swing.

GOLD - Head and shoulders pattern is formedThe yellow metal retains support at $1,900 an ounce as a significantly weaker-than-expected nonfarm payrolls report dented the dollar and boosted hopes that the Federal Reserve near the end of the rate hike cycle.
However, Fed officials said the bank still needs to raise interest rates in the near term to combat overheating. Markets are broadly pricing in a Fed increase of at least 25 basis points by the end of July.
SELL XAUUSD zone 1936 - 1938 - Stoploss 1945 (scalp)
SELL XAUUSD zone 1948 - 1950 - Stoploss 1957
Note: Installing TP SL fully wins the market and is safe in trading
Notice when Gold Break Out from the price range 1930$ - 1932$ and close above this price range. This easily helps Gold reach its target of 1940$ - 1945$ - 1950$ in the short term.
When trading the breakout method, pay attention to place the stop loss at the nearest resistance area of $1924
Conversely, if the Triple Top is formed first, Gold will return to $1907 - $1905, This will help us form a long-term Buy strategy.

XAUUSD: intraday shock range 1912~1935Good morning, friends, in terms of the trend of gold yesterday, it did not continue the upward trend of last Friday. Instead, it went deep V-shaped in the US market time period, with an upward trend of falling first and then rising. This is also the completion of my transaction yesterday. Signal, take a profit of 8 US dollars.
At present, my point of view remains unchanged. The upper resistance position of 1935 is also likely to be touched today. Gold has risen many times and has not made a substantial breakthrough. If you want to make a breakthrough within the day, you must be stimulated by news. For the time being, it seems that there has been no change in the bulls, and there is an obvious upward correction of shocks. So the next operation is still the same as what I said on Monday, we can just sell high and buy low to operate in the range shock. Near SELL1935, near BUY1912, this is the general direction of today's trading, specific real trading signals pay attention to follow-up updates
Gold trading recommendations today
Gold fell sharply yesterday in a small non-agricultural situation, and today it is a large non-agricultural situation. The decline continues, and the pressure position continues to be short.
Gold's current rebound is over, and it will resume its decline! From the perspective of the 4-hour level, this rebound hits the suppression of the long-term moving average and then directly turns downwards, and directly falls below the support of the short-term moving average! The current K-line remains below the moving average, and the short position is in a downward trend! Rebounds are short opportunities!
The current pressure is the reverse pressure position of yesterday's consolidation, and it is also the short-term moving average 1918 position! Relying on this pressure position within the day, the position is dry and bearish! After the big non-agricultural data, it is expected to further break the new low and continue to fall!
Trading straregy:
gold: sell@1918 tp1:1900 tp2:1890
Next, there will be a lot of trading opportunities for gold, and I will provide you with more signals, don't miss the opportunity to make money!

XAUUSD Top-down analysis Hello traders, this is a complete multiple timeframe analysis of this pair. We see could find significant trading opportunities as per analysis upon price action confirmation we may take this trade. Smash the like button if you find value in this analysis and drop a comment if you have any questions or let me know which pair to cover in my next analysis.

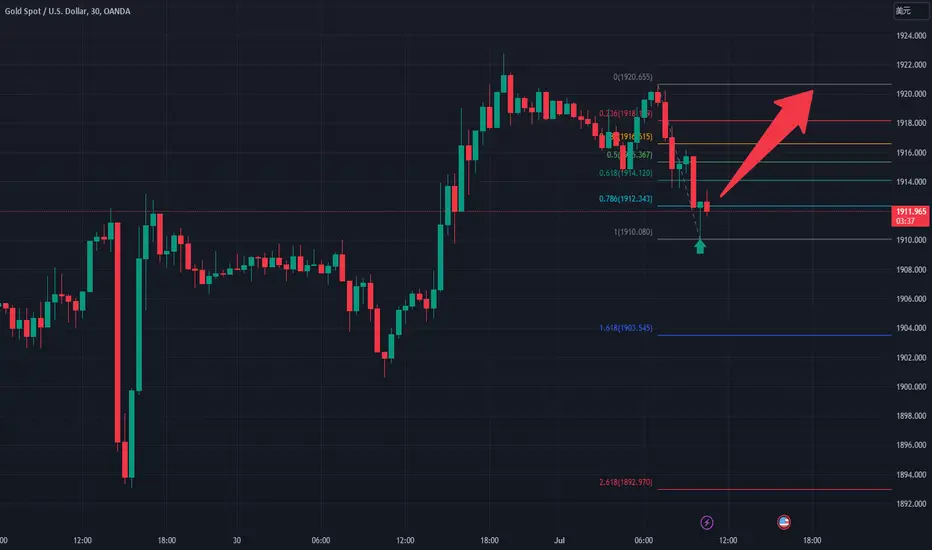
Gold price fell below 1915, go longEntered the market at 1916 in the morning, and there was no TP in 1920, and finally fell sharply. At present, the bottom support is formed, and the short-term strategy in the day continues to be long
At the same time, when gold falls back to 1911/1910, you can enter the market in batches. In early trading today, it is given 1916~17 to do more. If you hold the 1900 line, we are short-term bullish. We will look at the follow-up direction in 1920
The fall of the golden hour line is normal and inevitable. The bottom of the candle chart is also obvious, and the triple bottom is more prominent. The gold price has also passed the long-lost resistance line 1912. The candle chart can still maintain 1912, so we go long directly
As long as the price of gold falls back, we dare to increase our positions, unless we break through the 1900 line
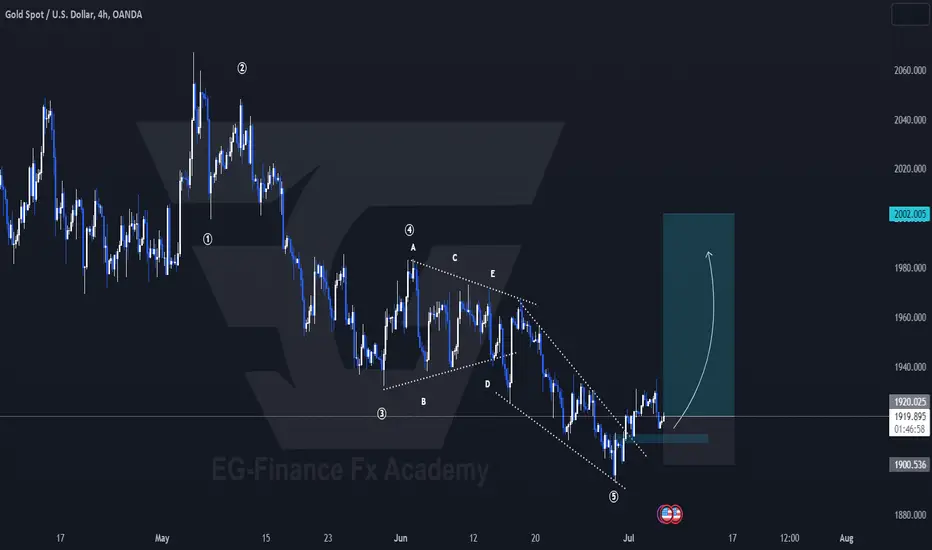
elliott wave analysis .. it's time to buy gold after the creation of the fifth wave, ended with a falling wedge pattern .. it's time to buy!
Potential Gold Rally at Latest Resistance of $2072 A potential gold rally that may occur if it reaches the latest resistance level $2072. However, I would like to emphasize the need for caution, as the pressure on gold could lift if signs of a recession start to build.
Gold has shown remarkable strength over the past few months, with prices steadily climbing and reaching new heights. We find ourselves at a critical juncture as it approaches the resistance level $2072. Should gold break through this level, it could trigger a significant rally, leading to further price appreciation.
Nevertheless, it is essential to consider the broader economic landscape. The global economy is currently facing uncertainties, with various indicators suggesting the possibility of an impending recession. Should these signs materialize into a full-blown recession, the pressure on gold may temporarily lift as investors flock to other safe-haven assets or adopt a risk-off approach.
Given the delicate balance between a potential gold rally and the looming recessionary concerns, it is crucial to approach the situation cautiously. As a prudent gold trader, it is wise to carefully assess the market conditions, monitor economic indicators, and stay updated on significant developments that could impact gold prices.
With this in mind, I encourage you to consider loading up on gold as part of your trading strategy. Gold has historically proven to be a reliable store of value during economic uncertainty, serving as a hedge against inflation and currency fluctuations. By diversifying your portfolio and allocating some of your investments to gold, you can potentially mitigate risks and safeguard your wealth.
In conclusion, while the possibility of a gold rally at the latest resistance of 2072 is enticing, it is crucial to remain cautious and vigilant. Keep a close eye on the signs of a potential recession, as this could significantly impact the performance of gold. You can confidently navigate the market by staying informed and making well-informed decisions.

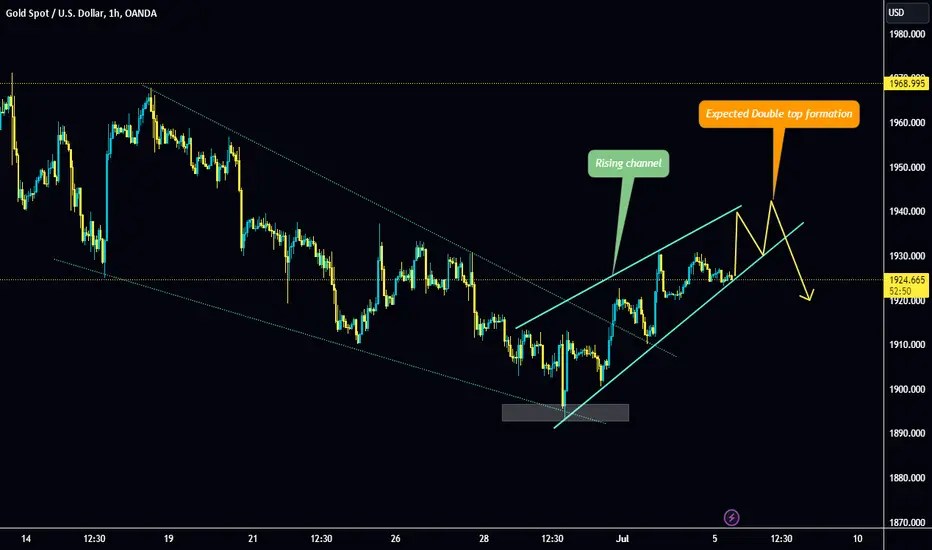
Gold is expected to breakdown soonCurrently in 4 hour chart gold is forming a nice rising channel pattern so keenly watch the expected double top formation for the potential short.
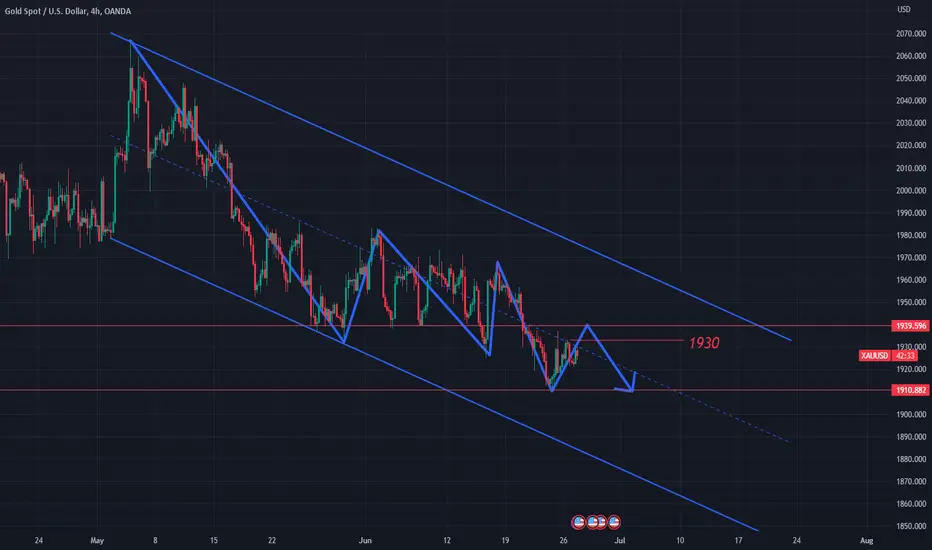
XAUUSD: pay attention to the trend range 1910~1940As far as today's market is concerned, looking directly at the picture, the current upper pressure level is gradually lowering, and the short-term focus is around 1930. If it breaks through 1930, then rebound and continue to focus on the 1940 area. With a lower weekly close, we're leaning toward another bottom this week.
Therefore, in terms of operation, today it is recommended that gold rely on the two pressures of 1930 and 1940 to see the market and continue to short rallies, with the target around 1910! ! !
The market will focus on the initial monthly rate of US durable goods orders in May, which will be released later. The current market expectation is -1.0%. If it meets expectations, it will be the worst performance in the past three months. This expectation tends to support gold prices. However, the hawkish stance of most central banks around the world and the need to raise interest rates further may limit the room for gold's rebound.
In addition, this trading day also needs to pay attention to the seasonally adjusted annualized total new home sales in May in the United States, the Consumer Confidence Index of the Conference Board in June in the United States, the CPI data in May in Canada, and pay attention to the speeches of central bank officials such as the Bank of England, the European Central Bank and the Bank of Canada.
The trading signal SELL1929-1932 during the Asian session made a profit of 50 points, and it has already made a profit in advance today