Gold continues to fall, and the current price is directly SellGold continues to fall from its high level. At the same time, the early 2164 support platform has also been pierced. The inverted V reversal pattern has emerged, and there is still a large downside space. In the absence of news stimulation, it will at least return to its starting point. On the 2157 line, the market continues to fall, and our short orders will be arranged to follow the market's rhythm! So you can Sell directly!
Judging from the current market situation, the bullish momentum has faded, and the shock and decline will gradually eliminate the previous bullish followers! Subsequent followers will gradually enter the market! And the market will also wait for the time to mature before going out of a waterfall market! The one-hour short corner is currently at the 2175 line, which is also the point where the moving average is suppressed. If it reaches it again within the day, we will definitely increase our position! Those with short positions will have an excellent entry opportunity!
Goldtradingsetup

XAU/USD 22 March 2024 Intraday AnalysisH4 Analysis:
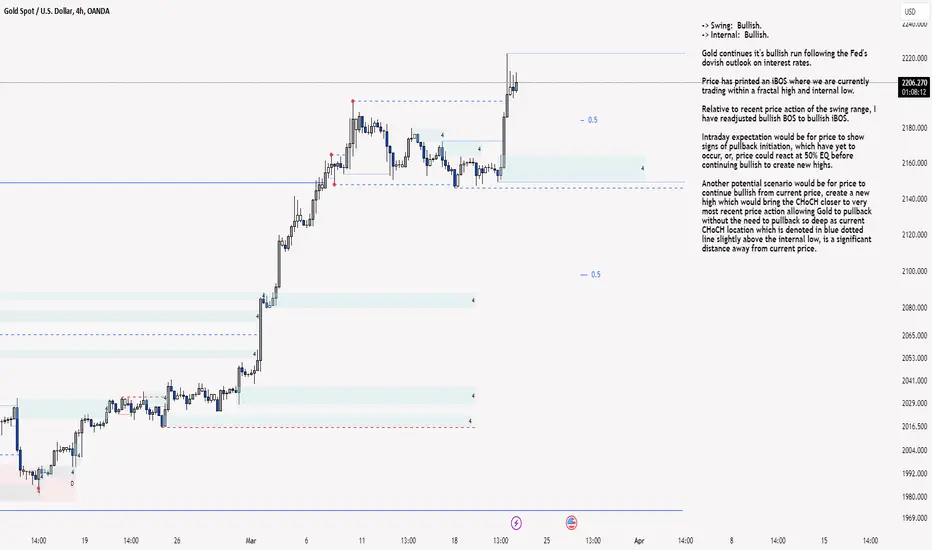
-> Swing: Bullish.
-> Internal: Bullish.
Gold continues it's bullish run following the Fed's dovish outlook on interest rates.
Price has printed a bullish iBOS where we are currently trading within a fractal high and internal low.
Relative to recent price action of the swing range, I have readjusted bullish BOS to bullish iBOS.
Intraday expectation is for price to react H4 POI to then target fractal high.
Because of the need for HTF's requiring a pullback, another potential scenario would be for price to continue bearish and print a bearish iBOS which would then indicate the Daily pullback has initiated.
H4 Chart:
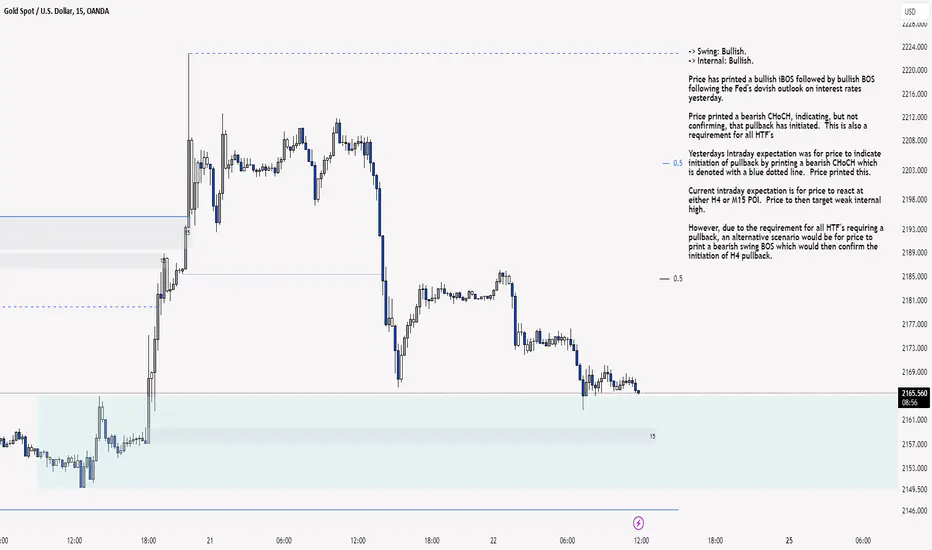
M15 Analysis:
-> Swing: Bullish.
-> Internal: Bullish.
Price has printed a bullish iBOS followed by bullish BOS following the Fed's dovish outlook on interest rates yesterday.
Price printed a bearish CHoCH, indicating, but not confirming, that pullback has initiated. This is also a requirement for all HTF's
Yesterdays Intraday expectation was for price to indicate initiation of pullback by printing a bearish CHoCH which is denoted with a blue dotted line. Price printed this.
Current intraday expectation is for price to react at either H4 or M15 POI. Price to then target weak internal high.
However, due to the requirement for all HTF's requiring a pullback, an alternative scenario would be for price to print a bearish swing BOS which would then confirm the initiation of H4 pullback.
M15 Chart:
Gold god strikes again. Let's take a moment to review this flawless execution AGAIN!!!.
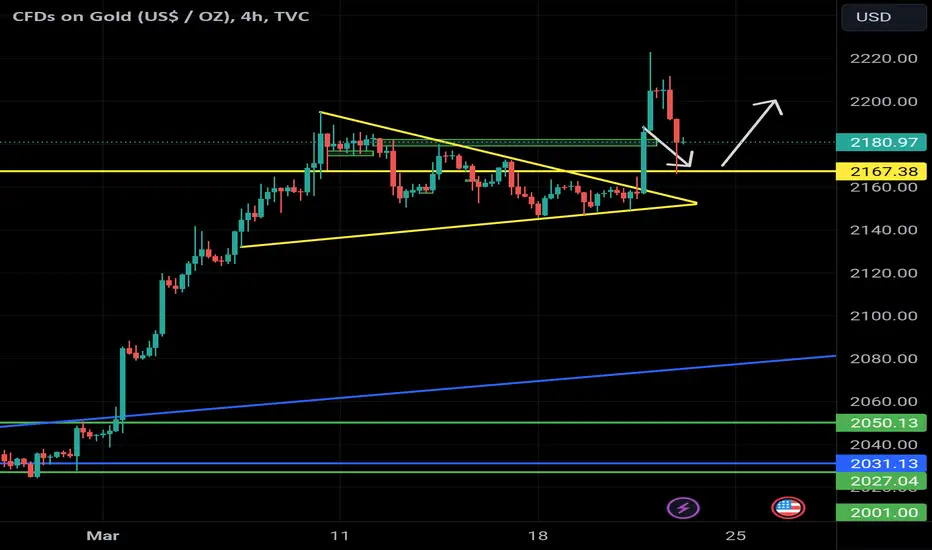
We identified the bullish flag pattern prior to reaching all-time highs, offering an ideal entry point.
Yesterday's push following the Fed meeting was just what we needed. Currently, gold's all-time high stands at 2220. Today, we witnessed a retracement to the key support level we anticipated yesterday, hitting 2167 as predicted. With a clean break of 2185, our next resistance target is 2200. Gold's journey is far from over; 2220, we'll be seeing you soon.
Gold latest technical analysis
In early trading in the European market on Thursday (March 21), spot gold continued its intraday gains and is currently trading around US$2,200, rising by more than US$20 during the day. Spot gold is trading at $2,200 an ounce.
Looking at the daily chart of gold, gold prices have confirmed the formation of a bullish flag, with the relative strength index (RSI) once again overbought.
The Federal Reserve said on Wednesday that it would still cut interest rates three times by 25 basis points each time before the end of this year. Federal Reserve Chairman Jerome Powell said at a subsequent press conference that he believed interest rates may be at a cyclical peak and that it would be appropriate to start cutting interest rates at some point this year.
Affected by the dovish stance of the Federal Reserve, the U.S. dollar suffered a sell-off on Wednesday, with spot gold closing at $28.96, or 1.34%, at $2,186.06 per ounce. The price of gold rose further in early trading in Asia on Thursday, reaching a maximum of $2,222.90 per ounce, setting a new all-time high.
As shown on the daily chart of gold, gold prices confirmed the formation of a bullish flag after closing above the downtrend line resistance at $2,161 an ounce on Wednesday.
If gold buyers regain confidence, the next bullish price target is expected to be a record high of $2,223 an ounce, followed by a psychological level of $2,250 an ounce.
If the daily closing price of gold is below the $2,200/ounce mark, the high of $2,189/ounce will be tested.
Once gold prices fall below $2,189 per ounce, this will trigger a new downward trend in gold prices and fall towards Monday's low of $2,146 per ounce.
My suggestion is to go short at high prices at the right time
Always pay attention to my signals to make the right choice from them.
I will share trading strategies and trading ideas every day. Follow me in the channel at the bottom of the article to get detailed trading signals. I hope that with my help, everyone can make huge profits!
XAUUSD: 21/3 Today’s Analysis and StrategyGold prices topped $2,200 for the first time in history as the Federal Reserve maintained expectations for three interest rate cuts this year, suggesting they were not concerned about a recent rise in inflation. It once hit a record high of $2,222.65, rising by more than $60 before the Fed's interest rate decision. Gold climbed more than 1% on Wednesday after the Federal Reserve signaled they expected to cut interest rates by 75 basis points by the end of 2024, sending the dollar and Treasury yields lower.
Gold investors are finally breathing a sigh of relief as there is some new buying momentum in the precious metals market as the Federal Reserve hints that it will still cut interest rates three times this year. In a highly anticipated move, the Federal Reserve announced it would keep the federal funds rate unchanged at a range of 5.25% to 5.50%. However, the market is more interested in the Fed's forward guidance and interest rate expectations before the end of the year.
Although the Fed continues to signal interest rate cuts, it is still reluctant to provide a specific timetable. The monetary policy statement struck a very optimistic tone about the health of the economy. The gold market rose sharply as markets began to solidify expectations for a rate cut in June.
golden technical aspect
Daily resistance is 2250, support below is 2177-45
Four-hour resistance is 2223-50, support below is 2178-50
Gold operation suggestions:
From the daily analysis, the short-term support below focuses on the vicinity of 2178. This position is also the watershed for the recent strong bulls. At the same time, do not chase the bulls at the current high level. Just wait patiently for sideways consolidation before entering the market.
SELL:2120-2125
BUY:2178-2183
BUY:2148~2153
Technical analysis only provides trading direction!
XAU/USD 21 March 2024 Intraday AnalysisH4 Analysis:
-> Swing: Bullish.
-> Internal: Bullish.
Gold continues it's bullish run following the Fed's dovish outlook on interest rates.
Price has printed an iBOS where we are currently trading within a fractal high and internal low.
Relative to recent price action of the swing range, I have readjusted bullish BOS to bullish iBOS.
Intraday expectation would be for price to show signs of pullback initiation, which have yet to occur, or, price could react at 50% EQ before continuing bullish to create new highs.
Another potential scenario would be for price to continue bullish from current price, create a new high which would bring the CHoCH closer to very most recent price action allowing Gold to pullback without the need to pullback so deep as current CHoCH location which is denoted in blue dotted line slightly above the internal low, is a significant distance away from current price.
H4 Chart:
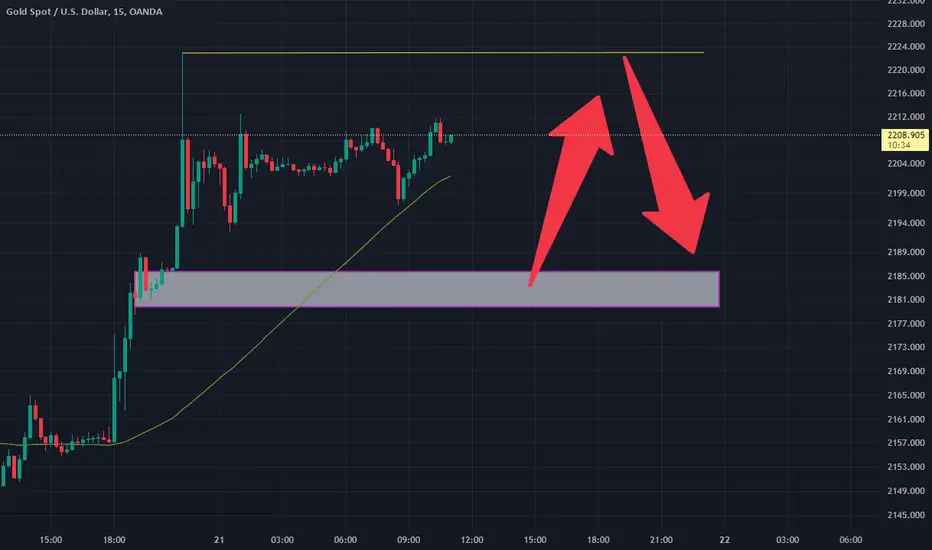
M15 Analysis:
-> Swing: Bullish.
-> Internal: Bullish.
Price has printed a bullish iBOS followed by bullish BOS following the Fed's dovish outlook on interest rates yesterday.
Price is currently trading within a fractal high and low.
Intraday expectation would be for price to indicate initiation of pullback by printing a bearish CHoCH which is denoted with blue dotted lines.
Alternatively, and much like H4, price could continue bullish to create new highs in order to bring CHOCH closer to the very most recent price action. This would Gold to initiate first structural signs of pullback without the need to significantly pull back.
M15 Chart:
XAUUSD: 18/3 Today’s Gold Trading StrategyData last week showed that U.S. consumer prices rose more than expected in February, and producer prices also showed a certain degree of inflationary stickiness. Traders have reduced their bets on an interest rate cut in June. Gold prices fell more than 0.8% last week.
Spot gold has already priced in the positive push from expectations of lower interest rates. If inflation starts moving higher again, it means policymakers will have to keep monetary policy tighter for longer. Although gold does not particularly like high interest rate environments, if the reason for interest rates remaining so high is overheating inflation this naturally means that people will turn to international gold again. Higher-than-expected inflation continues to put pressure on the Federal Reserve to keep interest rates high, putting pressure on gold prices. The non-yielding precious metal is also used as a hedge against inflation.
Central banks will be in focus this week. The Bank of Japan and the Reserve Bank of Australia will announce interest rate decisions on Tuesday, the Federal Reserve will announce interest rate decisions on Wednesday, and the Bank of England and the Swiss National Bank will announce interest rate decisions on Thursday. The market will also focus on Tuesday's U.S. housing starts and building permits, as well as Thursday's weekly jobless claims, Philadelphia Fed manufacturing survey, PMI preview data and existing home sales.
Gold technical analysis:
Daily resistance is 2184, support below is 2124-00
4H resistance is 2158, support below is 2124-00
Gold operation suggestions:
Judging from the daily and four-hour analysis, today's short-term strong short-term strong dividing line is around 2158. Short-term pressure will focus on around 2158. The focus below will be on the daily level support of 2124 and today's low near 2145.
BUY:2140-2145
BUY:2120-2125
GOLD Bearish Robbery PlanDear Pro and Noob Traders,
My Gold heist plan is started am looting Some Gold.💰

xauusd goldBack to our latest analysis of #XAU/USD, we're delighted to share that our recent assessment of #XAUUSD (Gold) has proven accurate, with the market closely aligning with our projections.
Although the prices didn't adhere strictly to our forecast, the overall movement unfolded as anticipated.
new all-time high for gold was recorded yesterday during the #FOMC, our targets still set at $2260.
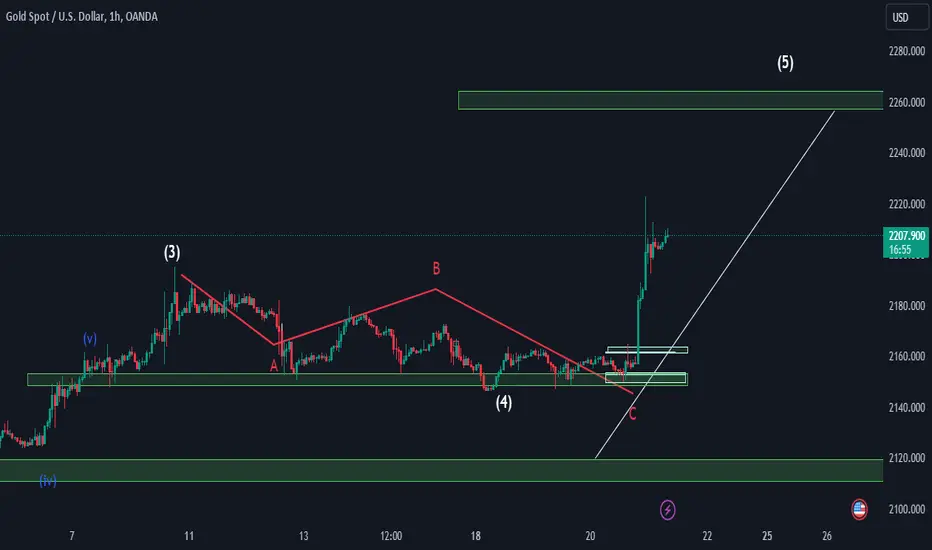
Gold execution As mentioned earlier this week, gold entered a flag formation in anticipation of today's Fed news, poised for potential upward movement. Today, we observed a bullish surge from 2150 around 12:30, gaining 100 pips before stabilizing in anticipation of further updates. With the flag pattern broken and a strong bullish sentiment, a retracement back to 2176 followed by a retest and subsequent rise to new highs is likely. This reaffirms our belief that the journey with gold is far from over. Hopefully, everyone capitalized on these opportunities and made some gains.

Gold market analysis
The price of gold is now $2157
From a gold technical perspective, the relative strength index (RSI) remains bullish and gold prices await confirmation of a bullish flag pattern.
Focus on Fed rate decision and Powell press conference
The U.S. Federal Open Market Committee (FOMC) will announce its interest rate resolution and summary of economic expectations; Federal Reserve Chairman Powell will hold a monetary policy press conference.
Gold market traders are closely watching the Fed's projected dot plot on the future path of interest rates, as well as comments from Fed Chairman Jerome Powell on the prospects for rate cuts.
It's the calm before the storm of the Fed's interest rate decision, and gold traders are turning to the sidelines to avoid making any new position bets. Markets are turning cautious as tensions rise ahead of the Fed's decision, eager for new hints on the timing and magnitude of the Fed's first interest rate cut this year.
The market's current expectation for the Fed to cut interest rates in June is only about 60%. Although the Fed's December dot plot predicted three rate cuts, it remains to be seen what the Fed's prospects for rate cuts will be. It is also worth noting that comments from Federal Reserve Chairman Jerome Powell at the press conference after the policy meeting will have new implications for the dollar and gold prices.
Always pay attention to my signals to make the right choice from them.
I will share trading strategies and trading ideas every day. Follow me in the channel at the bottom of the article to get detailed trading signals. I hope that with my help, everyone can make huge profits!
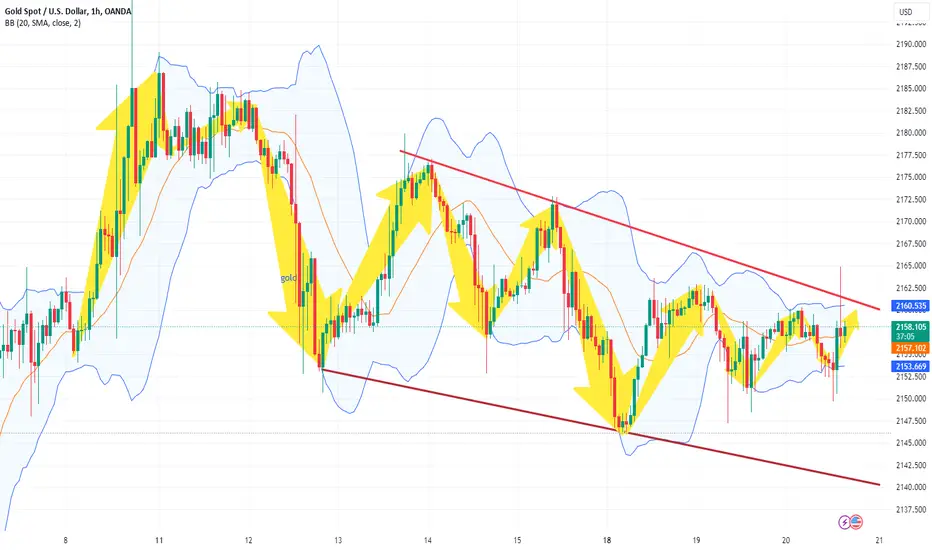
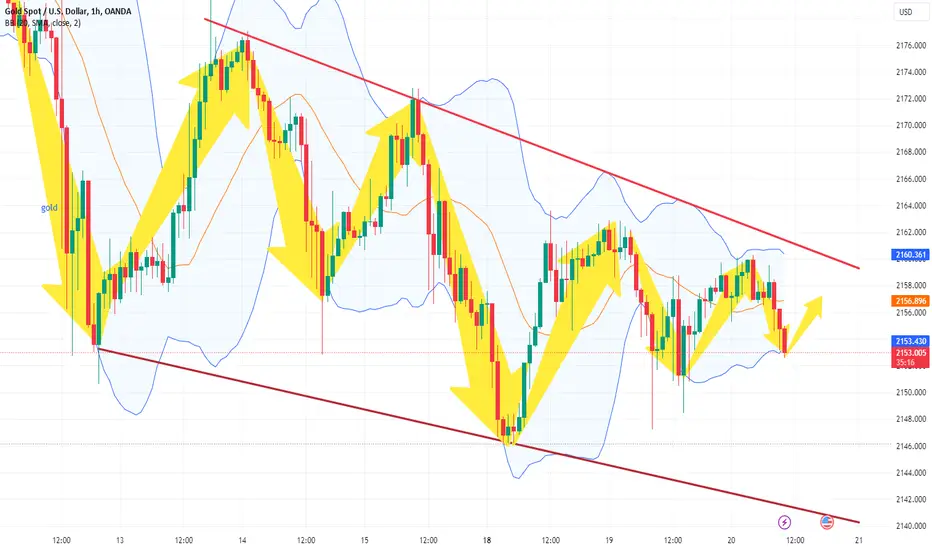
The downward trend continues, choose to sell high againGold is still in a volatile pattern. The short-term trend continues to be suppressed by the pressure level of 2160 on the upper trend line, and the overall recent trend is bearish. Now that the counterattack has basically arrived, you can choose to sell at a high level again!
The fluctuating trend of gold prices is a good opportunity for us to sell high and buy low. Looking at the market, the key resistance levels above are at the turning point pressure of 2160 and 2163. Choosing Sell is just right! Trading is actually very simple. Choose the right direction, control the position risk, and the rest is to wait for the goal to be realized!

Today’s gold price market trading analysis
On Wednesday (March 20), spot gold was trading below $2,160 per ounce at the beginning of the European market. Investors are cautiously awaiting the Federal Reserve's monetary policy statement. However, the market remains cautious about gold's near-term upside. If Powell makes dovish remarks again, gold is expected to usher in a new rally.
But from a short-term perspective, according to the 4-hour chart, gold prices are currently trading around $2,155 per ounce, and although below the mildly bearish 20-period SMA, a deeper decline remains unclear. The longer-term moving averages continue to rise, but technical indicators remain at negative levels, lacking clear directional strength signals.
Gold prices will continue to fluctuate within a narrow range. It is particularly important to grasp the rhythm at this time.
The latest important support and resistance levels for gold prices:
Support level: $2145.10;
Resistance level: $2163.40;
I am more inclined to go long at low prices, going long around $2150
Always pay attention to my signals to make the right choice from them.
I will share trading strategies and trading ideas every day. Follow me in the channel at the bottom of the article to get detailed trading signals. I hope that with my help, everyone can make huge profits!
Today's gold market price analysis
On Monday (March 19), the price of gold is now $2,159.
According to the current gold trend, gold prices will continue to fluctuate within a narrow range.
Gold remains at high levels and is trading sideways in a narrow range for the time being. On the four-hour gold chart, the price of gold is still suppressed by the moving average and is below the middle track of the Bollinger Bands. The high points are successively lower, seemingly forming a downward channel. The technical indicator MACD energy column continues to remain below the zero axis, indicating that gold's situation under short-term pressure has not changed significantly. Initial support below is $2,142.15, with further levels at $2,130.66 and $2,110.45. Only if the upper limit breaks through $2,176 can the upward trend be expected to continue.
Short-term gold trading recommendations: short around $2,160.
Always pay attention to my signals to make the right choice from them
I will share trading strategies and trading ideas every day. Follow me in the channel at the bottom of the article to get detailed trading signals. I hope that with my help, everyone can make huge profits!
Gold Going Down Gold fluctuates in a narrow band at around $2,160 for the second consecutive day on Tuesday. Ahead of the Fed's policy announcements, the benchmark 10-year US Treasury bond yield moves sideways near 4.3% and limits's XAU/USD's volatility.
Real-time analysis of gold price
Today, the lower support will focus on 2145-50, and the upper pressure will focus on 2170. During the day, we will first rely on the high altitude and low long cycle of this range to participate in the rhythm of long and short shock operations. At the midline position, you should watch more and move less, follow orders cautiously, and wait patiently for key points to enter the market.
Always pay attention to my signals to make the right choice from them
I will share trading strategies and trading ideas every day. Follow me in the channel at the bottom of the article to get detailed trading signals. I hope that with my help, everyone can make huge profits!

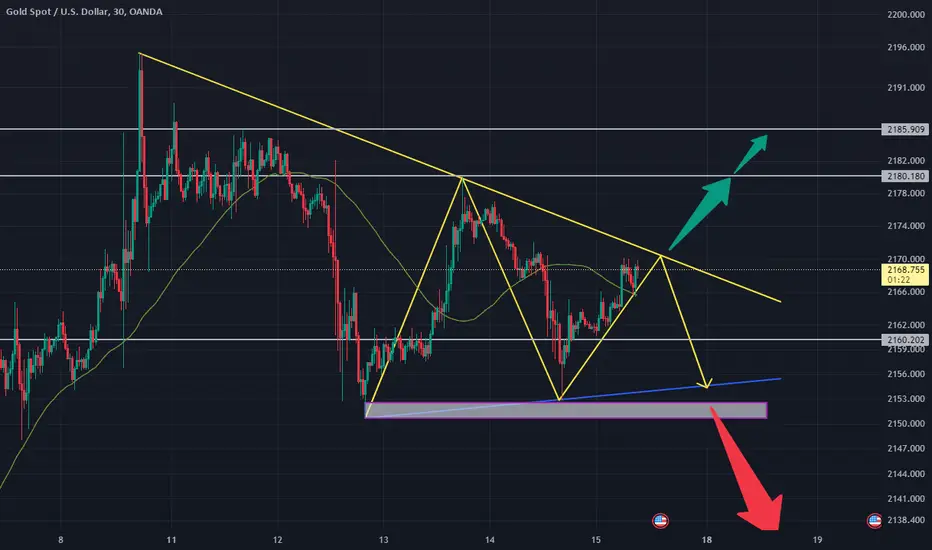
XAUUSD:14/3 Today’s Analysis and Trading StrategyGold fluctuated within a narrow range on Thursday and is currently trading around $2,170. Gold prices rose 0.75% on Wednesday to close at $2,174, boosted by a weaker U.S. dollar as investors still held out hope for a rate cut by the Federal Reserve in June despite scorching U.S. inflation data, while escalating geopolitical tensions maintained safe-haven demand for international gold. Gold prices rebounded, recovering from the previous session's losses, boosted by a weaker U.S. dollar.
Gold prices retreated from record highs set last week on Tuesday, posting their worst one-day drop since February 13, after a report showed U.S. consumer prices rose sharply in February, suggesting some stickiness in inflation. Higher-than-expected inflation means more pressure on the Federal Reserve to keep interest rates high, putting pressure on non-yielding assets such as gold. The precious metal is also used as a hedge against inflation. This is reinforced by the softer tone in U.S. Treasury yields, which has put dollar bulls on the defensive and acted as a driver for gold prices. As the U.S. dollar index fell 0.2%, overseas buyers were more willing to buy gold to avoid risks.
Despite the disappointing consumer price index, U.S. monetary policy authorities may judge that price pressures are easing. Gold has the potential to rise as long as economic data continues to be weak, with the focus now on U.S. retail sales (commonly known as the "terror index"), producer price index and last week's jobless claims, all of which are due to be released on Thursday.
Gold technical analysis
Daily resistance is 2184, support below is 2124-00
Four-hour resistance is 2200, support below is 2167-53
Gold operation suggestions:
From the daily and four-hour analysis, today's support at the bottom will be around 2164-53, short-term pressure at the top will be around 2184, and strong resistance will be at 2195-2200. The short-term long-short dividing line will be around 2150. You can continue to participate in long positions before the daily level falls below this level. If it falls below this level, you will look towards the 2124 target.
BUY:2148-2153
SELL:2195-2200
SELL:2148-2153

XAUUSD:15/3 Today’s Analysis and StrategyThe final value of U.S. retail sales data in February was 0.6%, lower than the expected 0.8%, but higher than the previous value of -0.8%. The final value of PPI in February was 1.6%, exceeding the expected 1.11%, and the previous value was 1%. PPI rose 0.6% month-on-month, twice the expected value, and the previous value was 0.3%.
The rise in energy prices is the main reason for the rise in February's PPI data. Combined with Tuesday's CPI data, it is not able to support the Federal Reserve's implementation of interest rate cuts at the next meeting. Judging from the data, the target of inflation falling back to 2% is still far away.
Affected by the data, the price of gold rose first and then fell yesterday, and then rose again to recover the decline. The intraday low hit below $2,153, and was supported again near the previous low of $2,150. The final price closed at $2,162. In the short term, the support below $2,150 is effective.
Gold technical analysis
Daily resistance is 2184, support below is 2124-00
Four-hour resistance is 2200, support below is 2167-53
Gold operation suggestions:
Judging from the daily and four-hour analysis, today's support below will focus on around 2150. During the day's decline, rely on this position to continue to go long. The short-term pressure above will focus on around 2184, the strong resistance will be 2195, and the short-term bullish strong dividing line will focus on 2150.
SELL:2195~2200
BUY:2148~2153
Technical analysis only provides trading direction!
Gold real-time trading analysis
On Monday (March 18), spot gold bottomed out and rebounded, with the price rising at $2,147. According to the latest analysis, gold is supported at $2,145.35. The price of gold is now $2,155.
Based on current gold trends, gold prices will continue to rise.
It is predicted that the price of gold will rise to around $2,160 and then fall.
Always pay attention to my signals to make the right choice from them.
It is recommended to go short in the short term: short around $2160.
I will share trading strategies and trading ideas every day. Follow me in the channel at the bottom of the article to get detailed trading signals. I hope that with my help, everyone can make huge profits!

XAU/USD 08 March 2024 Intraday AnalysisH4 Analysis:
-> Swing: Bullish.
-> Internal: Bearish.
Price had printed a swing BOS and subsequently a bullish iBOS.
Swing range confirmed.
Price has now printed a bearish iBOS to confirm swing pullback has initiated and is underway.
Scenario 2 played out from previous analysis whereby it was mentioned price could target internal low as all HTF's are requiring a pullback.
Intraday expectation is for price to continue bullish, react at either 50% EQ or H4 POI before targeting weak internal low.
H4 Chart:
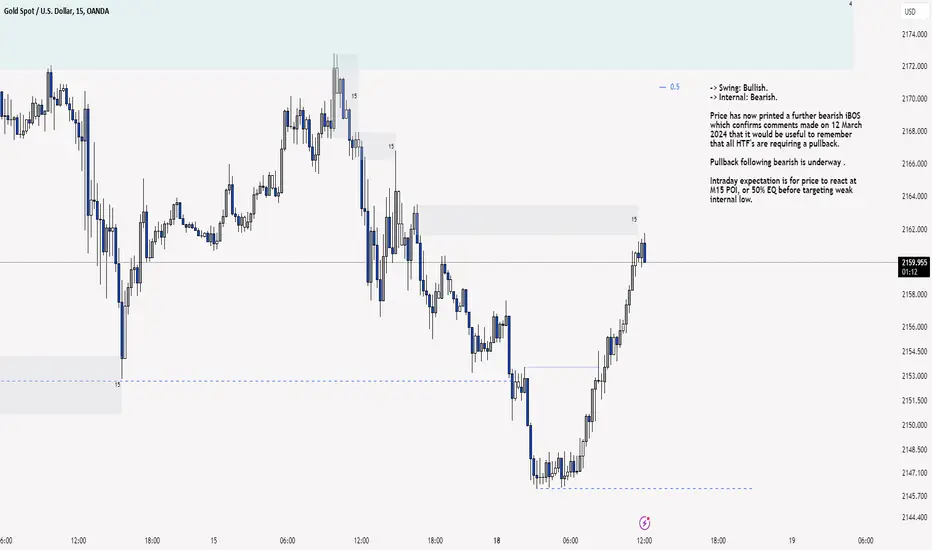
M15 Analysis:
-> Swing: Bullish.
-> Internal: Bearish.
Price has now printed a further bearish iBOS which confirms comments made on 12 March 2024 that it would be useful to remember that all HTF's are requiring a pullback.
Pullback following bearish is underway .
Intraday expectation is for price to react at M15 POI, or 50% EQ before targeting weak internal low.
M15 Chart:
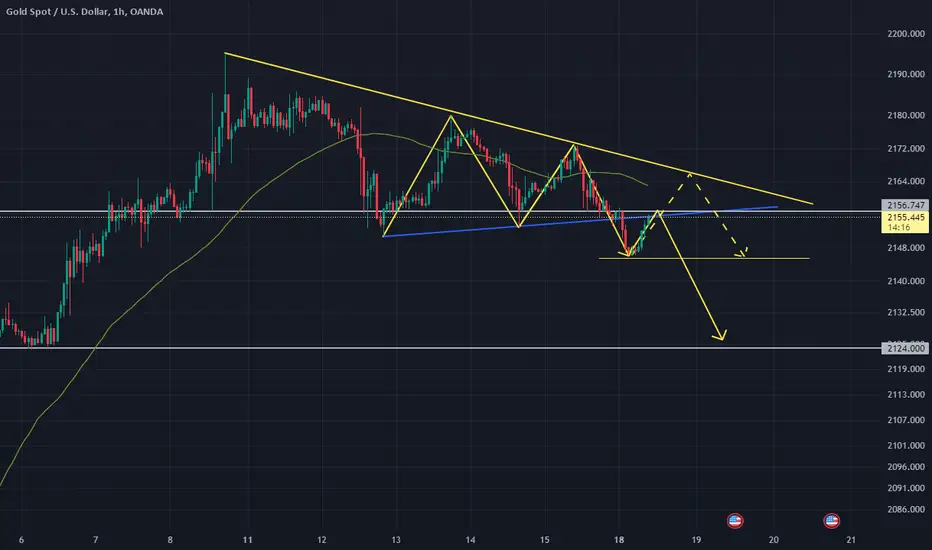
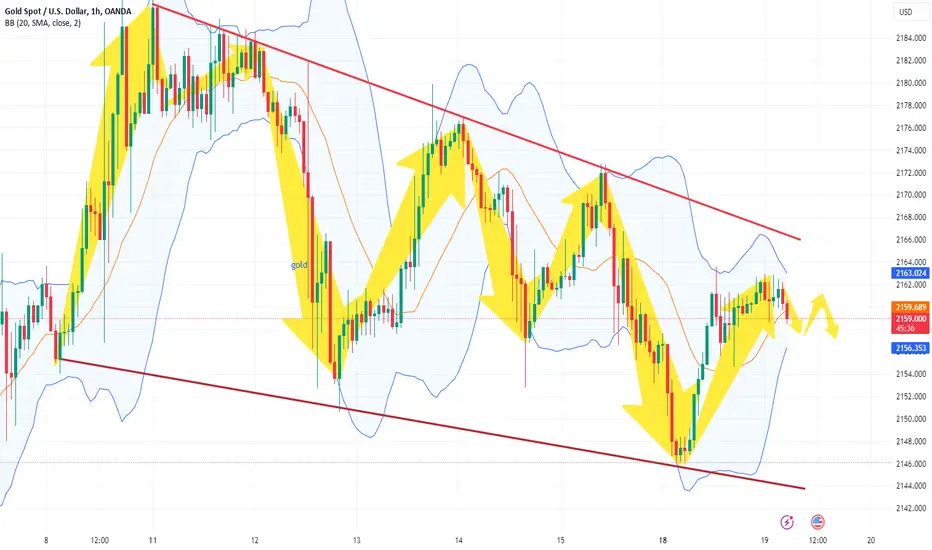
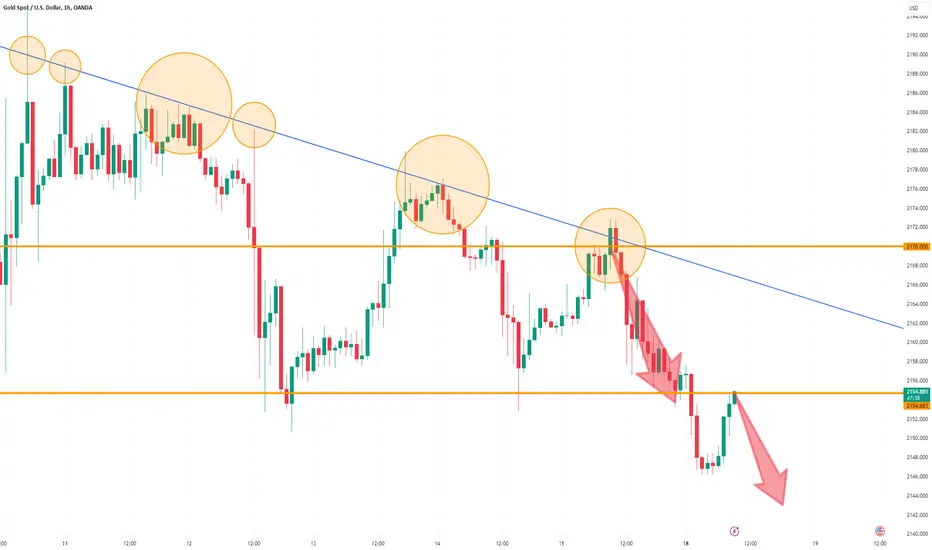
Gold maintains downtrend, continues to sell on reboundAfter repeated shocks, the price of gold began to show a weak situation. The key support level of 2150 has been tested for the third time, while the high points above are constantly pressing downwards. The triangle shock situation is nearing the end! I believe it is not difficult to fall below 2150 within the day, so I think it can be sold directly now! The target is gradually looking towards 2140-2130!
Technical analysis shows that the recent trend of gold prices is mostly running below the moving average dead cross, showing a weak short-term pattern. At this stage, the moving average pressure is at the 2161 line, while the upper trend line pressure is at 2168. The upper side is facing dual pressure levels, and The bottom only faces the support of 2150, so the situation only needs a little stimulation to achieve a breakthrough!
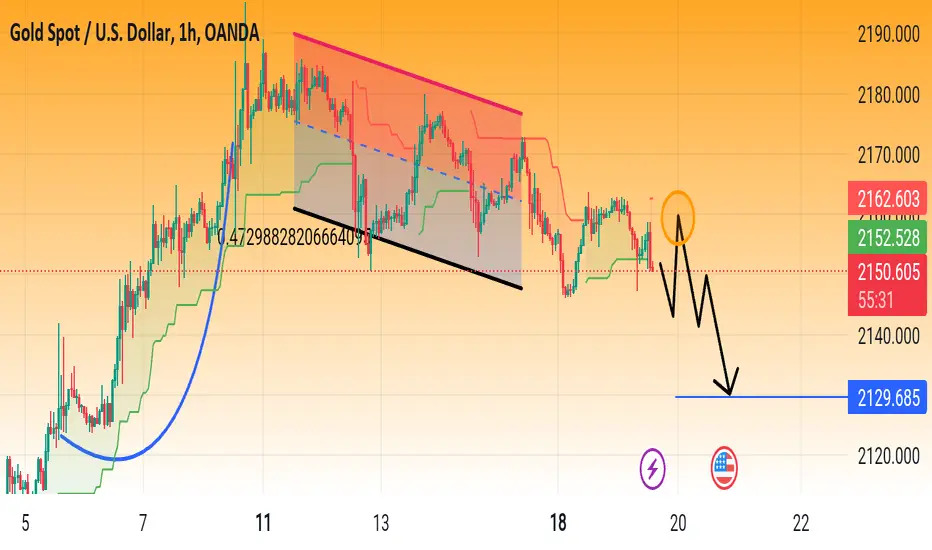
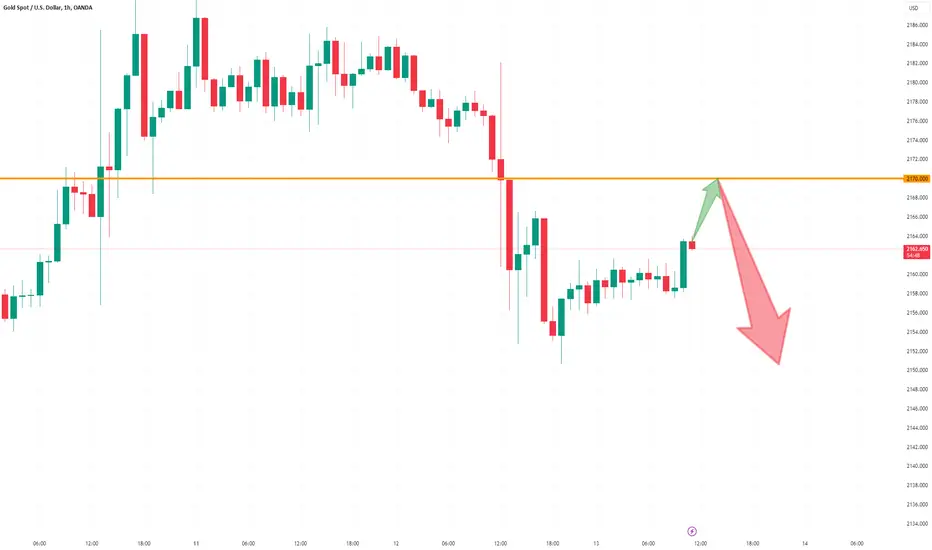
Wait for gold to rebound and sell todayThe price of gold has fallen below the trend line and stabilized, and its trend has entered the stage of adjustment. However, it is unknown where the adjustment will be, but what is certain is that the rising momentum has temporarily come to an end, and the next operation will turn to high selling. The main idea is that when the gold price rebounds to around 2170, you can boldly sell!
Technical feedback shows that the current one-hour trend has fallen below the support of the moving average and trend line. The upper moving average dead cross pressure is at 2170. At the same time, the gold price has fallen below the Fibonacci 0.236 support level of 2155, which means further support. Will look towards the 2130 line, which is the 0.382 retracement! At present, there is still a large profit margin below, and grasping the rhythm of the market is the only way to keep up with the rhythm of making money!
Gold Trading Analysis·Trends
Spot gold fell below $2,150 per ounce for the first time since March 7, down 0.28% on the day.
Now the price of gold is under pressure from above around $2,147, showing a downward trend.
What needs to be noted is whether the price of gold can fall below the $2,140 line.
If it receives strong support below at $2,140, the price of gold will rebound. If it falls below the $2,140 line, you need to watch $2,130 below.
Therefore, I think a safer trade is to wait for the gold price to receive support from below, and then go long at a low price.
Recommendation: Go long when gold is around $2,140
TP: $2150
SL: $2130
I will share trading strategies and trading ideas every day. Follow me in the channel at the bottom of the article to get detailed trading signals. I hope that with my help, everyone can make huge profits!
