Gold Entry Zones: 03-Feb-2025Good morning! Happy New week! Happy New Month! Improve your trading strategy with our Gold zones. Understand market dynamics and make informed decisions.
Goldtradingstrategy

Gold Bullish Run: Targeting $2,900 - Time to Ride the Wave! 📈 Gold Analysis: Bullish Setup
🟢 Current Price: 2,607
🎯 Take Profit 1: 2,635
🎯 Take Profit 2: 2,680
🎯 Take Profit 3: 2,790
🎯 Take Profit 4: 2,900
🔹 Stop Loss: 2,524
📈 Why This Trade?:
Gold continues to trade within a bullish channel, having broken above 2,144 back in March. With higher highs and higher lows consistently forming, the trend remains strong.
The stop loss is positioned below both the 50MA and recent lows at 2,524, allowing for market fluctuations while keeping risk under control.
⚠️ Risk Management Reminder:
Although the bullish trend remains intact, trends can change quickly. Always apply proper risk management and ensure you’re not over-leveraging. A drop below 2,524 would signal a potential shift in the market, invalidating this setup.
Stay tuned for updates! 🚀

GOLD 1H CHART ROUTE MAP & TRADING PLAN FOR THE WEEKHey Everyone,
Please see our updated 1h chart levels and targets for the coming week.
We are seeing price play between two weighted levels with a gap above at 2807 and a gap below at 2794. We will need to see ema5 cross and lock on either weighted level to determine the next range.
We will see levels tested side by side until one of the weighted levels break and lock to confirm direction for the next range.
We will keep the above in mind when taking buys from dips. Our updated levels and weighted levels will allow us to track the movement down and then catch bounces up.
We will continue to buy dips using our support levels taking 30 to 40 pips. As stated before each of our level structures give 20 to 40 pip bounces, which is enough for a nice entry and exit. If you back test the levels we shared every week for the past 24 months, you can see how effectively they were used to trade with or against short/mid term swings and trends.
BULLISH TARGET
2807
EMA5 CROSS AND LOCK ABOVE 2807 WILL OPEN THE FOLLOWING BULLISH TARGET
2819
EMA5 CROSS AND LOCK ABOVE 2819 WILL OPEN THE FOLLOWING BULLISH TARGET
2832
EMA5 CROSS AND LOCK ABOVE 2832 WILL OPEN THE FOLLOWING BULLISH TARGET
2845
BEARISH TARGETS
2794
EMA5 CROSS AND LOCK BELOW 2794 WILL OPEN THE FOLLOWING BEARISH TARGET
2778
EMA5 CROSS AND LOCK BELOW 2778 WILL OPEN THE FOLLOWING BEARISH TARGET
2764
EMA5 CROSS AND LOCK BELOW 2764 WILL OPEN THE RETRACEMENT RANGE
2753 - 2739
EMA5 CROSS AND LOCK BELOW 2739 WILL OPEN THE SWIG RAGE
SWING RANGE
2722 - 2707
As always, we will keep you all updated with regular updates throughout the week and how we manage the active ideas and setups. Thank you all for your likes, comments and follows, we really appreciate it!
Mr Gold
GoldViewFX

GOLD 4H CHART ROUTE MAP & TRADING PLAN FOR THE WEEKHey Everyone,
Please see our updated 4h chart levels and targets for the coming week.
We are seeing ema5 and price play between two weighted levels with a gap above at 2800 and a gap below at 2772. We need ema5 to cross and lock above or below the weighted Goldturns to determine the next range.
We will see levels tested side by side until one of the weighted levels break and lock to confirm direction for the next range.
We will keep the above in mind when taking buys from dips. Our updated levels and weighted levels will allow us to track the movement down and then catch bounces up.
We will continue to buy dips using our support levels taking 30 to 40 pips. As stated before each of our level structures give 20 to 40 pip bounces, which is enough for a nice entry and exit. If you back test the levels we shared every week for the past 24 months, you can see how effectively they were used to trade with or against short/mid term swings and trends.
BULLISH TARGET
2800
EMA5 CROSS AND LOCK ABOVE 2800 WILL OPEN THE FOLLOWING BULLISH TARGET
2826
EMA5 CROSS AND LOCK ABOVE 2826 WILL OPEN THE FOLLOWING BULLISH TARGET
2852
BEARISH TARGETS
2772
EMA5 CROSS AND LOCK BELOW 2772 WILL OPEN THE RETRACEMENT RANGE
2744 - 2712
EMA5 CROSS AND LOCK BELOW 2712 WILL OPEN THE SWING RANGE
SWING RANGE
2685 - 2655
As always, we will keep you all updated with regular updates throughout the week and how we manage the active ideas and setups. Thank you all for your likes, comments and follows, we really appreciate it!
Mr Gold
GoldViewFX

GOLD DAILY CHART MID/LONG TERM UPDATEHey Everyone,
Please see the daily chart update we have been trading and tracking for a while now, to give you all an overall view of the range and how we have been hitting targets after targets.
Previously we stated that we have a candle body close above 2686 opening 2760 and we now also had ema5 lock to further confirm this gap, which was hit perfectly completing this target and allowing plenty of time after the confirmation to get in for the action.
We then had a candle body close above 2760 with a gap above at 2797, which was hit last week completing this target.
2797 has left no further candle body close and therefore we may see some rejection here. We will now look for a body close above this level to confirm a continuation or we will see lower Goldturns tested for support to establish long term range. We have now also updated the retracement and swing range on this chart.
We will use our smaller timeframe analysis on the 1H and 4H chart to buy dips from the weighted Goldturns for 30 to 40 pips clean. Ranging markets are perfectly suited for this type of trading, instead of trying to hold longer positions and getting chopped up in the swings up and down in the range.
We will keep the above in mind when taking buys from dips. Our updated levels and weighted levels will allow us to track the movement down and then catch bounces up using our smaller timeframe ideas.
Our long term bias is Bullish and therefore we look forward to drops like this, which allows us to continue to use our smaller timeframes to buy dips using our levels and setups.
Buying dips allows us to safely manage any swings rather then chasing the bull from the top.
Thank you all for your likes, comments and follows, we really appreciate it!
Mr Gold
GoldViewFX

GOLD MONTHLY CHART LONG TERM/RANGE ROUTE MAPHey Everyone,
Please see update on our monthly chart idea for our long term/range analysis.
Previous month in December we stated that the month started with a detachment to ema5 below for a correction, which was highlighted with a small mini circle on the chart for visual purpose.
- This detachment to ema5 was completed perfectly.
We also stated last month in December that the area above 2589 is a strong level of support with ema5 providing dynamic support now for a bounce.
- This also played out perfectly with ema5 providing dynamic support and above our 2589 support level for the push up, perfectly hitting our axis target 2702.
We then stated that we had two days for month end and will need a body close above 2702 for confirmation for a further continuation or a body close below 2589 to confirm the channel top test below. We also stated that if price closes this month in this range without the body closes, then we are likely to see play between this range for another month with not much detachment on the next monthly candle to ema5, which means the likely dynamic support should be provided by ema5 from the beginning of the month.
- This played out perfectly in January as the the ema5 provided the dynamic support right from the start, which followed with a nice push up. We now also have a candle body close above 2702 leaving a gap to 2825 Axis our long term target that we have been tracking over the months.
We will continue to use all support structures, across all our multi time frame chart ideas to buy dips also keeping in mind our long term gaps above. Short term we may look bearish but looking at the monthly chart allows us to see the bigger picture and the overall long term Bullish trend.
As always, we will keep you all updated with regular updates throughout the week and how we manage the active ideas and setups. Thank you all for your likes, comments and follows, we really appreciate it!
Mr Gold
GoldViewFX

GOLD ROUTE MAP UPDATEHey Everyone,
What an amazing finish to the week smashing all our chart ideas across all our multi timeframe analysis.
After completing all our targets yesterday; we stated that we now needed to see ema5 lock above 2797 for a continuation into 2808. This was hit perfectly today completing all our targets for a perfect finish to the week.
BULLISH TARGET
2778 - DONE
EMA5 CROSS AND LOCK ABOVE 2778 WILL OPEN THE FOLLOWING BULLISH TARGET
2787 - DONE
EMA5 CROSS AND LOCK ABOVE 2787 WILL OPEN THE FOLLOWING BULLISH TARGET
2797 - DONE
EMA5 CROSS AND LOCK ABOVE 2797 WILL OPEN THE FOLLOWING BULLISH TARGET
2808 - DONE
BEARISH TARGETS
2768 - DONE
EMA5 CROSS AND LOCK BELOW 2768 WILL OPEN THE FOLLOWING BEARISH TARGET
2757 - DONE
EMA5 CROSS AND LOCK BELOW 2757 WILL OPEN THE FOLLOWING BEARISH TARGET
2746 - DONE
EMA5 CROSS AND LOCK BELOW 2746 WILL OPEN THE FOLLOWING BEARISH TARGET
2732 - DONE
EMA5 CROSS AND LOCK BELOW 2732 WILL OPEN THE SWING RANGE
SWING RANGE
2707 - 2697
We will now come back Sunday with our updated Multi time-frame analysis, Gold route map and trading plans for the week ahead.
Have a smashing weekend!! And once again, thank you all for your likes, comments and follows, we really appreciate it!
Mr Gold
GoldViewFX
Gold trading zones: 31-Jan-2025Good morning! Find today's Gold trading zones and enhance your market analysis.

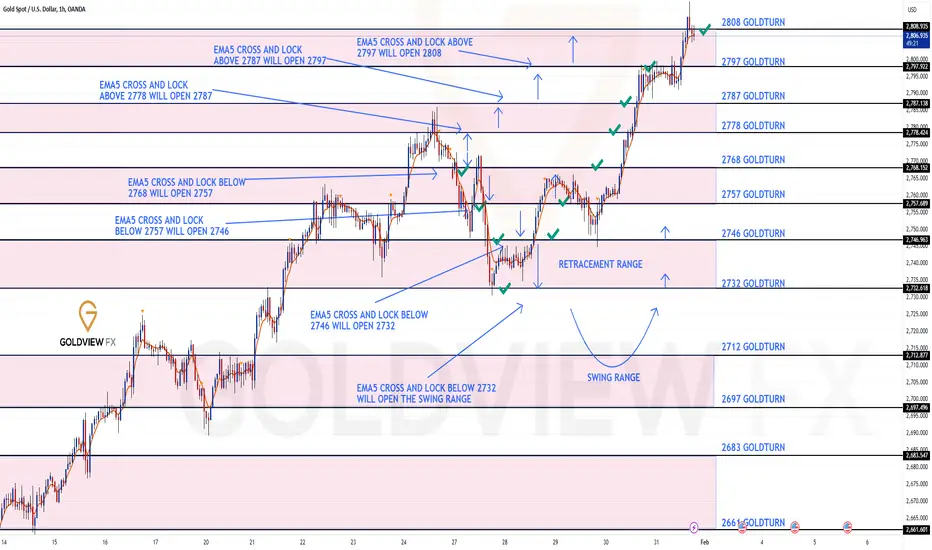
GOLD ROUTE MAP UPDATEHey Everyone,
A PIPTASTIC day on the chart smashing all our targets, just like we analysed.
We started the week completing our bearish targets into the retracement range for support. We then highlighted the weighted level rejection bounce for the push up into our Bullish targets, clearing 2778, followed with ema5 lock opening 2787, which was hit perfectly. We then finished off with our final lock above 2787 opening 2797, now complete!!! True level to level action!!!
Now we need to see ema5 lock above 2797 for a continuation or failure to lock will follow with a rejection into Goldlturns below to find support. We are now siting in a new range and will need some play here to establish a blueprint to re-engage.
We will keep the above in mind when taking buys from dips. Our updated levels and weighted levels will allow us to track the movement down and then catch bounces up.
We will continue to buy dips using our support levels taking 30 to 40 pips. As stated before each of our level structures give 20 to 40 pip bounces, which is enough for a nice entry and exit. If you back test the levels we shared every week for the past 24 months, you can see how effectively they were used to trade with or against short/mid term swings and trends.
BULLISH TARGET
2778 - DONE
EMA5 CROSS AND LOCK ABOVE 2778 WILL OPEN THE FOLLOWING BULLISH TARGET
2787 - DONE
EMA5 CROSS AND LOCK ABOVE 2787 WILL OPEN THE FOLLOWING BULLISH TARGET
2797 - DONE
EMA5 CROSS AND LOCK ABOVE 2797 WILL OPEN THE FOLLOWING BULLISH TARGET
2808
BEARISH TARGETS
2768 - DONE
EMA5 CROSS AND LOCK BELOW 2768 WILL OPEN THE FOLLOWING BEARISH TARGET
2757 - DONE
EMA5 CROSS AND LOCK BELOW 2757 WILL OPEN THE FOLLOWING BEARISH TARGET
2746 - DONE
EMA5 CROSS AND LOCK BELOW 2746 WILL OPEN THE FOLLOWING BEARISH TARGET
2732 - DONE
EMA5 CROSS AND LOCK BELOW 2732 WILL OPEN THE SWING RANGE
SWING RANGE
2707 - 2697
As always, we will keep you all updated with regular updates throughout the week and how we manage the active ideas and setups. Thank you all for your likes, comments and follows, we really appreciate it!
Mr Gold
GoldViewFX

Gold trading insights: 30-Jan-2025Gold trading insights for today: Explore our zones for informed decision-making.

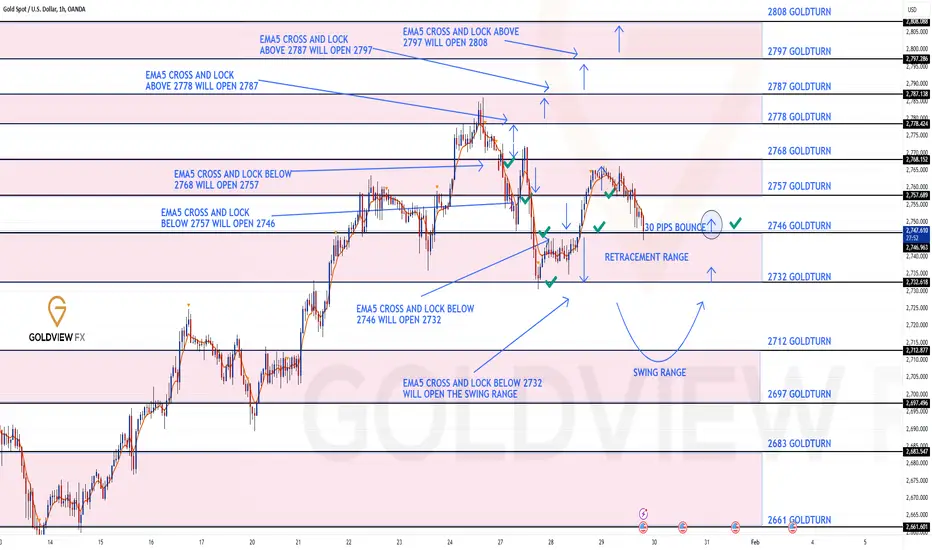
GOLD ROUTE MAP UPDATEHey Everyone,
Once again our levels were respected allowing us to buy dips inline with our plans.
After completing a nice bull run yesterday we got a break above 2757 opening the range above, which gave over 90 pips and just fell short of the gap that remains on our radar.
We saw a rejection onto our weighted level below 2746, which gave a clean bounce like we always state on our charts ideas.
We are now seeing price play into the retracement range, where we expect a reaction for support. A break below the retracement range will open the swing range. Failure to break will see price retest the Goldturns above once again.
We will keep the above in mind when taking buys from dips. Our updated levels and weighted levels will allow us to track the movement down and then catch bounces up.
We will continue to buy dips using our support levels taking 30 to 40 pips. As stated before each of our level structures give 20 to 40 pip bounces, which is enough for a nice entry and exit. If you back test the levels we shared every week for the past 24 months, you can see how effectively they were used to trade with or against short/mid term swings and trends.
BULLISH TARGET
2778
EMA5 CROSS AND LOCK ABOVE 2778 WILL OPEN THE FOLLOWING BULLISH TARGET
2787
EMA5 CROSS AND LOCK ABOVE 2787 WILL OPEN THE FOLLOWING BULLISH TARGET
2797
EMA5 CROSS AND LOCK ABOVE 2797 WILL OPEN THE FOLLOWING BULLISH TARGET
2808
BEARISH TARGETS
2768 - DONE
EMA5 CROSS AND LOCK BELOW 2768 WILL OPEN THE FOLLOWING BEARISH TARGET
2757 - DONE
EMA5 CROSS AND LOCK BELOW 2757 WILL OPEN THE FOLLOWING BEARISH TARGET
2746 - DONE
EMA5 CROSS AND LOCK BELOW 2746 WILL OPEN THE FOLLOWING BEARISH TARGET
2732 - DONE
EMA5 CROSS AND LOCK BELOW 2732 WILL OPEN THE SWIG RAGE
SWING RANGE
2707 - 2697
As always, we will keep you all updated with regular updates throughout the week and how we manage the active ideas and setups. Thank you all for your likes, comments and follows, we really appreciate it!
Mr Gold
GoldViewFX
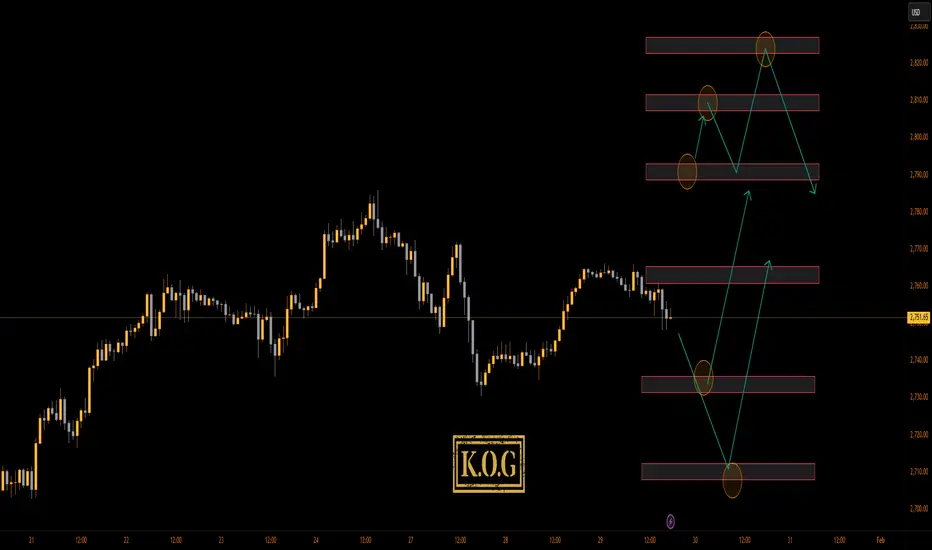
THE KOG REPORT - FOMCTHE KOG REPORT – FOMC
This is our view for FOMC, please do your own research and analysis to make an informed decision on the markets. It is not recommended you try to trade the event if you have less than 6 months trading experience and have a trusted risk strategy in place. The markets are extremely volatile, and these events can cause aggressive swings in price.
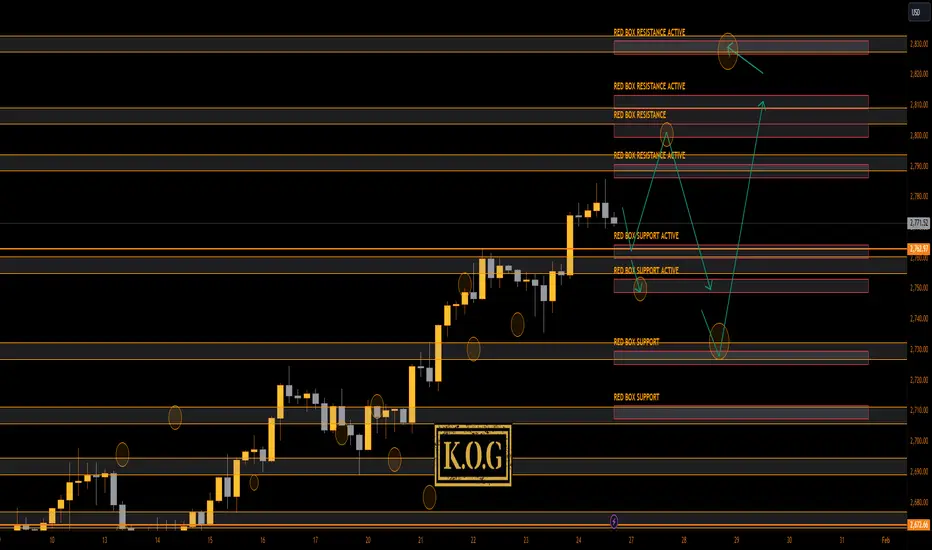
Ok team, a simple one for this FOMC as we're expecting a bit of a curveball which is going to make it difficult to hold trades. For that reason, we have plotted the extreme key levels on the charts, anything intra-day and immediate support and resistance has been removed as it’s simply irrelevant if we see aggressive volume.
We have the level below which is also the order region 2730-40, a spike there with rejection can give this the momentum it needs to break upside and attack that 2800 level which is ideally what we want to see if they’re going to attempt it. We’ll be waiting higher however for them to complete the move and confirm a reversal, only then will we want to attempt the short trade back down using the red boxes.
Below the order region is the key level 2710-03, a push down there with a confirmed rejection and reversal, we’ll decide on whether to long or not back up using the red boxes level to level. We’ve done well on the KOG Report, we’ve shorted, we’ve longed and we’ve closed nicely on the bias level targets this week. We’re suggesting our traders take it easy, instil some patience and discipline, wait for them to take the price to where they want, then hunt the trade.
RED BOXES:
Break above 2762 for 2775, 2782, 2790 and 2810 in extension of the move
Break below 2740 for 2730, 2720, 2710 and 2698 in extension of the move
Please do support us by hitting the like button, leaving a comment, and giving us a follow. We’ve been doing this for a long time now providing traders with in-depth free analysis on Gold, so your likes and comments are very much appreciated.
As always, trade safe.
KOG
Gold trading zones: 29-Jan-2025Today's Gold trading zones: Identify potential opportunities and plan your strategy.

GOLD DAILY CHART ANALYSIS MID/LONG TERM UPDATEHello Everyone,
Here’s the latest update on the GOLD daily chart we’ve been monitoring and trading. Below is a comprehensive breakdown of the current range we’ve been tracking.
Previously, we identified a significant resistance level at 2790, highlighting it as a potential reversal point. At the time, we recommended holding off on trades due to the likelihood of a reversal. We also mentioned that if EMA5 crossed and held above the ENTRY LEVEL at 2744, it would signal a buy opportunity with a target at TP1 (2807).
Friday NY Session Update: After the daily chart correction, EMA5 crossed the ENTRY LEVEL at 2744, with the price reaching 2785 before pulling back due to the strong resistance level.
This week began with a notable bounce on Monday, with FVG providing solid support between 2720-2740. This support could pave the way for another attempt to break above the resistance level. However, confirmation will depend on EMA5 holding above or below the ENTRY LEVEL at 2744.
Key Updates:
Bullish Targets:
TP1: 2807
TP2: 2870
TP3: 2933
If EMA5 hold and stays above ENTRY LEVEL at 2744, the next target is 2807.
If EMA5 crosses and locks above TP1 (2807), it will open the path to TP2 (2870).
If EMA5 crosses and locks above TP2 (2870), it will further open the path to TP3 (2933).
Bearish Targets:
TP1: 2689
TP2: 2629
TP3: 2560
If EMA5 crosses and locks below 2744, it will open the path to 2689.
If EMA5 crosses and locks below 2689, the next target will be 2629.
If EMA5 crosses and locks below 2629, it will lead to 2560.
Short-Term Strategy:
We will use smaller timeframes (1H and 4H charts) to buy dips at weighted levels, aiming for clean 30-40 pips per trade. Ranging markets are ideal for this strategy, avoiding longer holds that risk being caught in volatile swings.
Long-Term Bias:
Our long-term outlook remains Bullish, and we view drops as opportunities to buy dips, using our predefined levels and setups on smaller timeframes.
The QUANTUM Trading Mastery

GOLD ROUTE MAP UPDATEHey Everyone,
Once again another great day on the charts with our analysis playing out, as analysed.
Yesterday after completing each of the bearish gaps 2768, 2757 and 2746 confirmed with cross and lock, we stated that we now have a lock below 2746 opening 2732.
- This was hit perfectly today followed with no further lock confirming the rejection and the bounce into the Goldlturns above, inline with our plans to buy dips, just like we stated yesterday. This allowed us to catch the move up.
We are now seeing 2757 being tested and will need ema5 cross and lock above 2757 to open the range above. Failure to lock above will follow with a rejection and drop to test the lower Goldlturns again.
We will keep the above in mind when taking buys from dips. Our updated levels and weighted levels will allow us to track the movement down and then catch bounces up.
We will continue to buy dips using our support levels taking 30 to 40 pips. As stated before each of our level structures give 20 to 40 pip bounces, which is enough for a nice entry and exit. If you back test the levels we shared every week for the past 24 months, you can see how effectively they were used to trade with or against short/mid term swings and trends.
BULLISH TARGET
2778
EMA5 CROSS AND LOCK ABOVE 2778 WILL OPEN THE FOLLOWING BULLISH TARGET
2787
EMA5 CROSS AND LOCK ABOVE 2787 WILL OPEN THE FOLLOWING BULLISH TARGET
2797
EMA5 CROSS AND LOCK ABOVE 2797 WILL OPEN THE FOLLOWING BULLISH TARGET
2808
BEARISH TARGETS
2768 - DONE
EMA5 CROSS AND LOCK BELOW 2768 WILL OPEN THE FOLLOWING BEARISH TARGET
2757 - DONE
EMA5 CROSS AND LOCK BELOW 2757 WILL OPEN THE FOLLOWING BEARISH TARGET
2746 - DONE
EMA5 CROSS AND LOCK BELOW 2746 WILL OPEN THE FOLLOWING BEARISH TARGET
2732 - DONE
EMA5 CROSS AND LOCK BELOW 2732 WILL OPEN THE SWIG RAGE
SWING RANGE
2707 - 2697
As always, we will keep you all updated with regular updates throughout the week and how we manage the active ideas and setups. Thank you all for your likes, comments and follows, we really appreciate it!
Mr Gold
GoldViewFX
THE KOG REPORT THE KOG REPORT
In last week’s KOG Report we said we would be looking price to attempt the 2715 price point and if rejected we would be looking for the short into the lower red box but sticking with the bullish bias levels. We got the move exactly into the red box support we wanted initially giving us the move upside completing not only KOGs bullish above targets but also the red box targets and the Excalibur targets. We update traders through the week with the plan and continued to remain with the long of the lows up to where we ended the week.
A phenomenal week in Camelot on gold hitting 7 targets and the team completing about 12 targets on the other pairs we trade and analyse.
So, what can we expect in the week ahead?
It’s going to be a frustrating week of expected ranging and choppy price action for traders due to it being the last week of the month and with FOMC pending. For that reason, we will use this KOG Report for the first half of the week and then update traders with the KOG Report FOMC before the release.
For this week we’re not looking to long unless we get a deep pull back either into the order region 2750-55 or further below that the 2730-35 region. It’s actually this levels we will want to test the short trades in to from the higher red box regions. We do have a red box active now at 2827, however, due to where the price is at the moment we’re not comfortable to long up here. If we can open and stay below the 2777 level, we feel an opportunity to short is available into the first region of 2765 which needs to be monitored for the break, and level that the order region of 2750-55. That’s where we will want to test the first long trade, but, as we said above, due to FOMC we can’t expect a clean move.
We have the levels above now active at 2827-30 which we feel is where they may want to take this to open up the 2800’s. If we do continue higher, that’s where we will be watching for a RIP IF we get there!
KOG’s bias for the week:
Bullish above 2750 with targets above 2784, 2793 and above that 2810 pre-event
Bearish on break of 2750 with target below 2735
Red boxes:
Break above 2780 for 2793, 2795, 2806 and 2827 in extension of the move
Break below 2770 for 2765, 2757, 2755, 2750 and 2743 in extension of the move
Please do support us by hitting the like button, leaving a comment, and giving us a follow. We’ve been doing this for a long time now providing traders with in-depth free analysis on Gold, so your likes and comments are very much appreciated.
As always, trade safe.
KOG
Gold trading zones: 28-Jan-2025Today's Gold trading zones: Identify potential opportunities and plan your strategy.

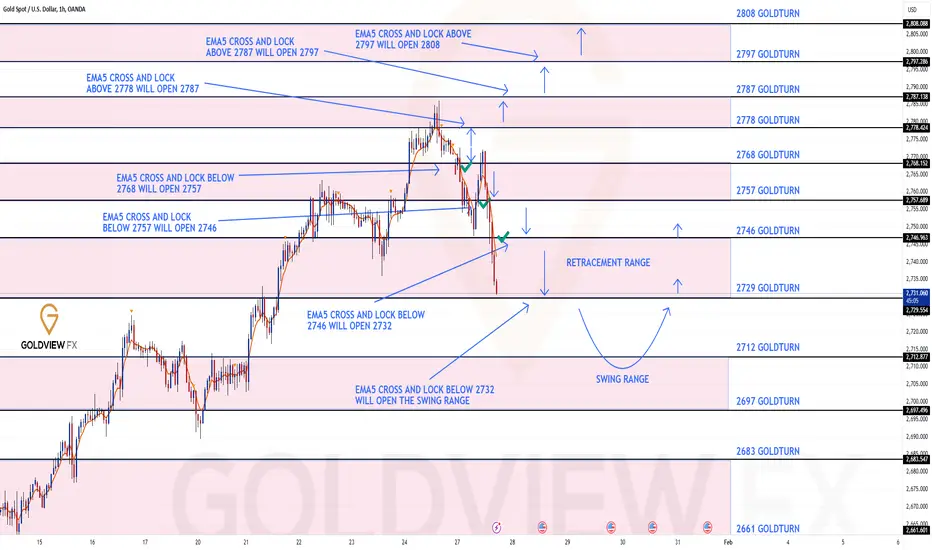
GOLD ROUTE MAP UPDATEHey Everyone,
Great start to the week with our analysis playing out as analysed with our level breaks giving us confirmation range to range.
We like to see these corrections down, which then allows us to buy dips safely riding the long term trend.
We got our bearish target hit at 2768, which followed with a cross and lock opening 2757 and a further lock below 2757 opening 2746. Both targets were hit perfectly. We are now seeing a lock below 2746 opening 2732.
We were able to take our weighted level bounces on the way down clearing 30 to 40 pips on each weighted level just like we analysed.
Failure to lock below any weighted levels will see reactional bounces to test upper Goldturns.
We will keep the above in mind when taking buys from dips. Our updated levels and weighted levels will allow us to track the movement down and then catch bounces up.
We will continue to buy dips using our support levels taking 30 to 40 pips. As stated before each of our level structures give 20 to 40 pip bounces, which is enough for a nice entry and exit. If you back test the levels we shared every week for the past 24 months, you can see how effectively they were used to trade with or against short/mid term swings and trends.
BULLISH TARGET
2778
EMA5 CROSS AND LOCK ABOVE 2778 WILL OPEN THE FOLLOWING BULLISH TARGET
2787
EMA5 CROSS AND LOCK ABOVE 2787 WILL OPEN THE FOLLOWING BULLISH TARGET
2797
EMA5 CROSS AND LOCK ABOVE 2797 WILL OPEN THE FOLLOWING BULLISH TARGET
2808
BEARISH TARGETS
2768 - DONE
EMA5 CROSS AND LOCK BELOW 2768 WILL OPEN THE FOLLOWING BEARISH TARGET
2757 - DONE
EMA5 CROSS AND LOCK BELOW 2757 WILL OPEN THE FOLLOWING BEARISH TARGET
2746 - DONE
EMA5 CROSS AND LOCK BELOW 2746 WILL OPEN THE FOLLOWING BEARISH TARGET
2732
EMA5 CROSS AND LOCK BELOW 2732 WILL OPEN THE SWIG RAGE
SWING RANGE
2707 - 2697
As always, we will keep you all updated with regular updates throughout the week and how we manage the active ideas and setups. Thank you all for your likes, comments and follows, we really appreciate it!
Mr Gold
GoldViewFX
GOLD 4H CHART ROUTE MAP & TRADING PLAN FOR THE WEEKHey Everyone,
Please see our updated 4h chart levels and targets for the coming week.
We are seeing ema5 and price play between two weighted levels with a gap above at 2785 and a gap below at 2747. We need ema5 to cross and lock above or below the weighted Goldturns to determine the next range.
We will see levels tested side by side until one of the weighted levels break and lock to confirm direction for the next range.
We will keep the above in mind when taking buys from dips. Our updated levels and weighted levels will allow us to track the movement down and then catch bounces up.
We will continue to buy dips using our support levels taking 30 to 40 pips. As stated before each of our level structures give 20 to 40 pip bounces, which is enough for a nice entry and exit. If you back test the levels we shared every week for the past 24 months, you can see how effectively they were used to trade with or against short/mid term swings and trends.
BULLISH TARGET
2785
EMA5 CROSS AND LOCK ABOVE 2785 WILL OPEN THE FOLLOWING BULLISH TARGET
2811
EMA5 CROSS AND LOCK ABOVE 2811 WILL OPEN THE FOLLOWING BULLISH TARGET
2836
BEARISH TARGETS
2747
EMA5 CROSS AND LOCK BELOW 2747 WILL OPEN THE RETRACEMENT RANGE
2712 - 2668
EMA5 CROSS AND LOCK BELOW 2668 WILL OPEN THE SWING RANGE
SWING RANGE
2665 - 2633
As always, we will keep you all updated with regular updates throughout the week and how we manage the active ideas and setups. Thank you all for your likes, comments and follows, we really appreciate it!
Mr Gold
GoldViewFX

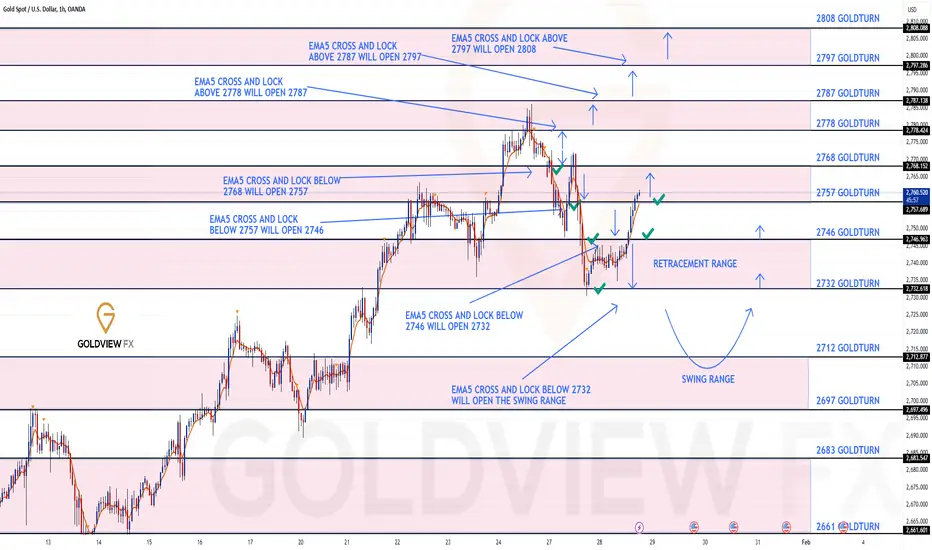
GOLD 1H CHART ROUTE MAP & TRADING PLAN FOR THE WEEKHey Everyone,
Please see our updated 1h chart levels and targets for the coming week.
We are seeing price play between two weighted levels with a gap above at 2778 and a gap below at 2768. We will need to see ema5 cross and lock on either weighted level to determine the next range.
We will see levels tested side by side until one of the weighted levels break and lock to confirm direction for the next range.
We will keep the above in mind when taking buys from dips. Our updated levels and weighted levels will allow us to track the movement down and then catch bounces up.
We will continue to buy dips using our support levels taking 30 to 40 pips. As stated before each of our level structures give 20 to 40 pip bounces, which is enough for a nice entry and exit. If you back test the levels we shared every week for the past 24 months, you can see how effectively they were used to trade with or against short/mid term swings and trends.
BULLISH TARGET
2778
EMA5 CROSS AND LOCK ABOVE 2778 WILL OPEN THE FOLLOWING BULLISH TARGET
2787
EMA5 CROSS AND LOCK ABOVE 2787 WILL OPEN THE FOLLOWING BULLISH TARGET
2797
EMA5 CROSS AND LOCK ABOVE 2797 WILL OPEN THE FOLLOWING BULLISH TARGET
2808
BEARISH TARGETS
2768
EMA5 CROSS AND LOCK BELOW 2768 WILL OPEN THE FOLLOWING BEARISH TARGET
2757
EMA5 CROSS AND LOCK BELOW 2757 WILL OPEN THE FOLLOWING BEARISH TARGET
2746
EMA5 CROSS AND LOCK BELOW 2746 WILL OPEN THE FOLLOWING BEARISH TARGET
2732
EMA5 CROSS AND LOCK BELOW 2732 WILL OPEN THE SWIG RAGE
SWING RANGE
2707 - 2697
As always, we will keep you all updated with regular updates throughout the week and how we manage the active ideas and setups. Thank you all for your likes, comments and follows, we really appreciate it!
Mr Gold
GoldViewFX

GOLD DAILY CHART MID/LONG TERM UPDATEHey Everyone,
Please see the daily chart update we have been trading and tracking for a while now, to give you all an overall view of the range.
Last week we stated that we have a candle body close above 2686 opening 2760 and we now also had ema5 lock to further confirm this gap
This was hit perfectly last week completing this target and allowing plenty of time after the confirmation to get in for the action.
We now have a candle body close above 2760 with a gap above at 2797 and will need ema5 lock to further confirm this.
We will use our smaller timeframe analysis on the 1H and 4H chart to buy dips from the weighted Goldturns for 30 to 40 pips clean. Ranging markets are perfectly suited for this type of trading, instead of trying to hold longer positions and getting chopped up in the swings up and down in the range.
We will keep the above in mind when taking buys from dips. Our updated levels and weighted levels will allow us to track the movement down and then catch bounces up using our smaller timeframe ideas.
Our long term bias is Bullish and therefore we look forward to drops like this, which allows us to continue to use our smaller timeframes to buy dips using our levels and setups.
Buying dips allows us to safely manage any swings rather then chasing the bull from the top.
Thank you all for your likes, comments and follows, we really appreciate it!
Mr Gold
GoldViewFX

GOLD WEEKLY CHART MID/LONG TERM ROUTE MAPHey Everyone,
Please see update on the weekly chart idea we have been tracking for over a month now and still playing out, as analysed.
Previously we stated that the channel top was continuing to provide support like we stated for the past few weeks and. as long as we see no ema5 cross and lock below into the channel, we can safely continue with our plans to buy dips in this range.
- This is continuing to play out perfectly. You can see although we had many breaks into the channel with candle over the last few weeks, ema5 failed to break inside, confirming the rejection and providing support above the channel like we stated.
Last week we stated that the bounce from the channel was playing out, as analysed and now heading towards our 2729 AXIS gap target above.
- This was hit perfectly completing this target. We now have a candle body close above 2729 opening long range/term gap at 2856 and will need ema5 lock to further confirm this.
This is the beauty of our channels, which we draw in our unique way, using averages rather than price. This enables us to identify fake-outs and breakouts clearly, as minimal noise in the way our channels are drawn.
Thank you all for your likes, comments and follows, we really appreciate it!
Mr Gold
GoldViewFX

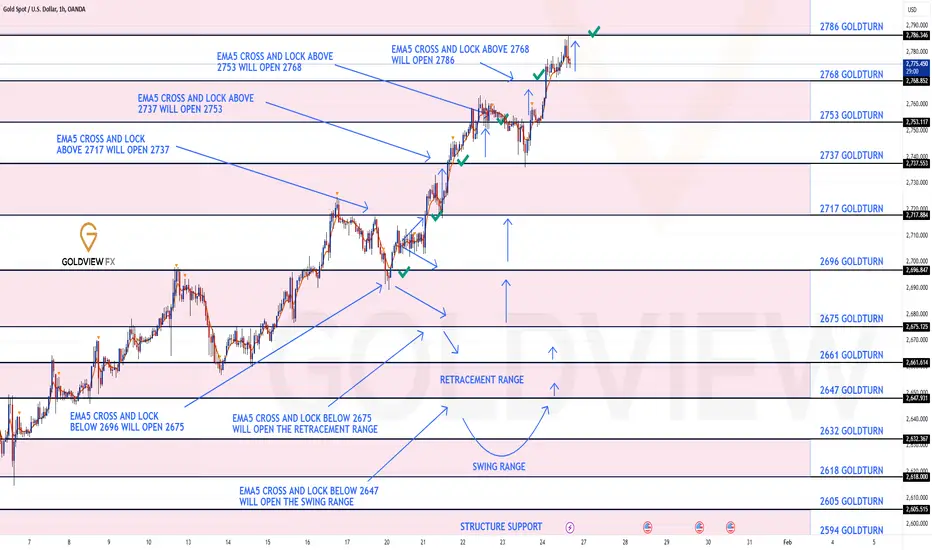
GOLD ROUTE MAP UPDATEHey Everyone,
Once again another PIPTASTIC performance!!
Not only did we clear all our targets but we were able to get in for the action well in advance with our cross and lock confirmation.
After completing 2717, 2737 and 2753, we stated that 2768 was left open with cross and lock confirmation. This was hit perfectly today followed with a further cross and lock above 2768 opening 2786. This is now hit, completing this chart idea for a perfect finish to the week!!!
We will now come back Sunday with our updated Multi time-frame analysis, Gold route map and trading plans for the week ahead.
Have a smashing weekend!! And once again, thank you all for your likes, comments and follows, we really appreciate it!
Mr Gold
GoldViewFX