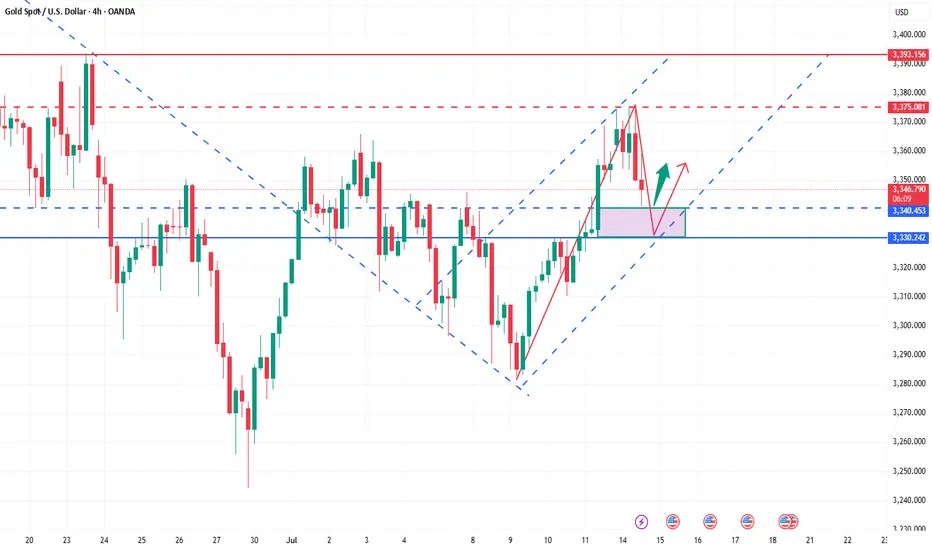
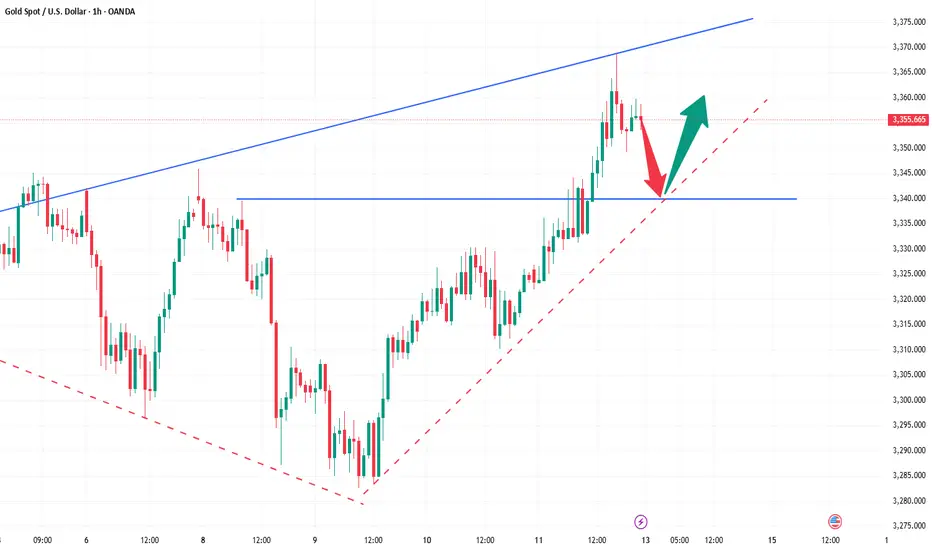
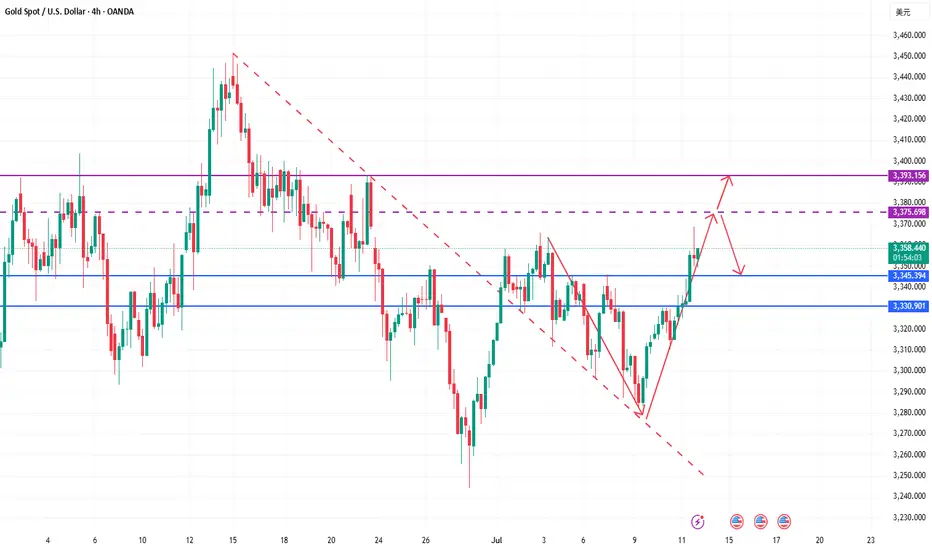
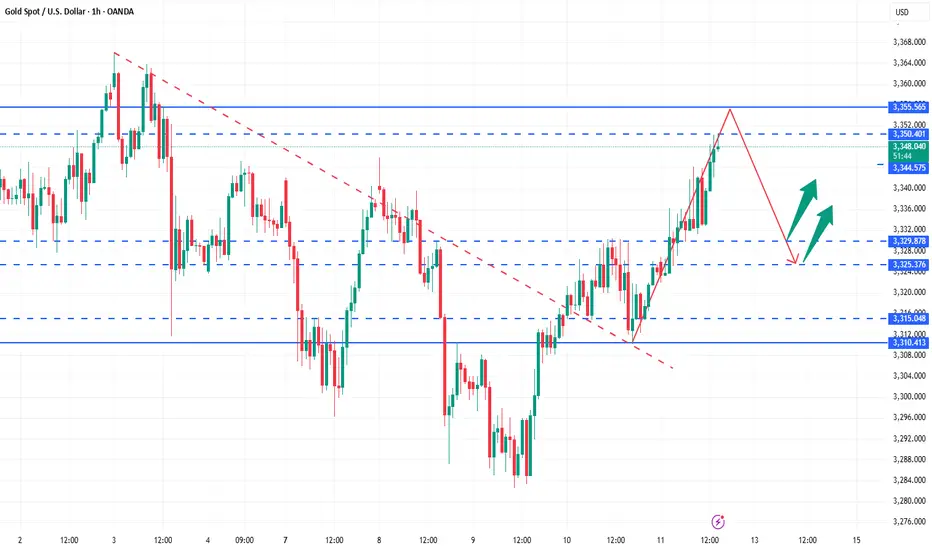
GOLD 1H CHART ROUTE MAP UPDATEHey Everyone,
Quick follow up on our 1H chart idea
We had a nice push up on the chart at the start of the week, coming close but just short of the 3381 gap. Still, it was a solid catch that respected our levels beautifully.
Following that, we cleared our 3353 Bearish Target, which also triggered the EMA5 cross and lock, confirming the move toward our 3328 retracement range, a level we hit perfectly.
As expected, we're now seeing a reaction in this 3328 zone, which remains key. We are watching this closely for a potential bounce. However, if price crosses and locks below 3328, the swing range will open, setting up the potential for a larger swing bounce from deeper levels.
We’ll continue using dips and key support zones for scalps and intraday bounces, aiming for 20–40 pips per level. The structure remains valid, and as mentioned before, our back-tested levels have consistently shown strong reaction zones over the past 24 months.
Updated Reminder of Key Levels:
BULLISH TARGET
3381
EMA5 CROSS & LOCK ABOVE 3381 opens
3416
EMA5 CROSS & LOCK ABOVE 3416 opens
3439
BEARISH TARGETS
3353 ✅ HIT
EMA5 CROSS & LOCK BELOW 3353 opens
3328 ✅ HIT
EMA5 CROSS & LOCK BELOW 3328 opens
3305
EMA5 CROSS & LOCK BELOW 3305 opens Swing Range:
3288
3259
As always, we’ll continue monitoring and sharing updates, as price reacts around these zones. Thank you all for the continued support, your likes, comments, and follows are genuinely appreciated!
Mr Gold
GoldViewFX
Goldtradingstrategy

Gold bearishness once again in line with expectationsThe data released so far show that the US inflation data is stable and tends to decline, which increases the possibility of the Fed's monetary policy. The US dollar index fell first and then rose. Gold opened at around 3344 and rebounded all the way. The current highest rebound is around 3366. It fell back to 3352 before the data was released, and then quickly rebounded to 3360. After the data was released, it fell again quickly, and the current lowest touched around 3346. The short orders around 3360-3365 that we shared with brothers before were basically the highest short orders of the day, and we successfully completed our first goal. The brothers who participated in it all made good profits. Judging from the current trend of gold, we continue to participate in short orders during the rebound, and the long position is still around 3335-3330. After the release of the CPI data, it is bearish overall. The core is that it is lower than market expectations but higher than the previous value. Inflation has heated up again, which has once again suppressed the expectation of interest rate cuts. After this data, it also laid a good foundation for the decline in the market. If the price goes up again, it will still rely on the 3365 level to go short again. The data is obviously bearish, and it scared a lot of long positions before it was released.
Gold reference ideas:
Continue to short when it rebounds to around 3358-3365, with a target around 3350-3340;
Go long when it falls back to around 3335-3330, with a target around 3350.
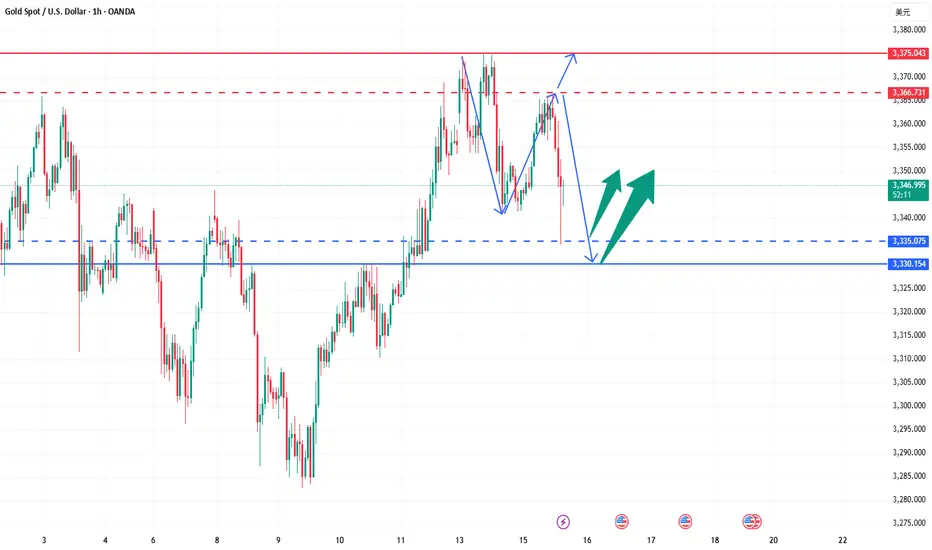
Gold’s Uptrend Is a Mirage, Bears Are Lurking Beneath!Gold repeatedly touched around 3375 yesterday and then fell under pressure, proving that there is strong resistance above. Moreover, after gold retreated and touched around 3341 yesterday, it did not recover in time and stand above 3350. It was not until today that it rebounded and touched around 3365. The rebound cycle has been extended to the present, and the rebound strength is not very strong.
Since gold retreated, it has not been able to recover the lost ground in time. Gold is under pressure in the 3360-3370 area in the short term. If gold cannot successfully break through this resistance area during the day, then gold will retreat again, and will refresh the 3341 low again, and continue to the 3335-3325 area.
So for short-term trading, I think we can try to short gold in the 3360-3370 area appropriately, looking at the target area: 3350-3340
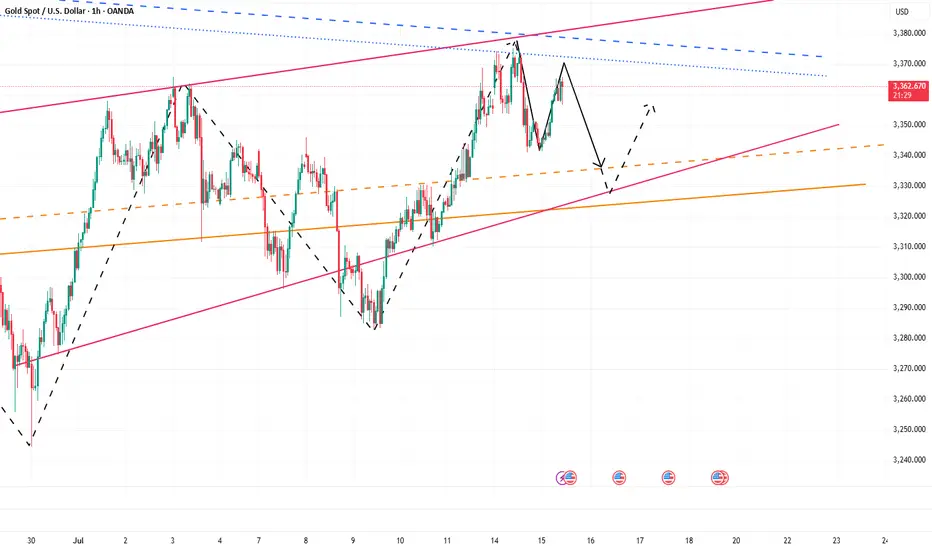
How to grasp the key trading points of gold?Yesterday, gold tested the 3375 line several times but failed to break through effectively. The selling pressure on the market was obvious, and the price immediately fell back, reaching a low of around 3341. The daily line closed with a long upper shadow, indicating that the bullish momentum has weakened and the short-term market has entered an adjustment phase. From the perspective of the 4-hour cycle, the continuous negative trend has led to the gradual closing of the Bollinger Bands, and the middle track position has temporarily gained support, but the overall market is volatile and weak. Today, we will focus on the 3354 watershed. If the rebound fails to effectively stand at this position, the pressure on the upper side will still be strong, and there is a risk of a short-term decline.
Key technical positions: upper resistance: 3365, 3354, lower support: 3340, 3330. In terms of operation rhythm, it is recommended to deal with it with a high-selling and low-buying, oscillating approach, and maintain flexible adjustments.
The operation suggestions are as follows: You can choose to short in the 3360-3365 area, with the target around 3350 and 3340; if the rebound is blocked below 3354, you can also enter the short order in advance. It is recommended to enter and exit quickly in the short-term weak market; strictly control the stop loss to avoid risks caused by sudden changes in the market.
The current market is obviously volatile, so don't blindly chase the rise and fall. It is particularly important to operate around the key pressure and support areas. The grasp of the rhythm will determine the final profit, and steady trading is the kingly way.

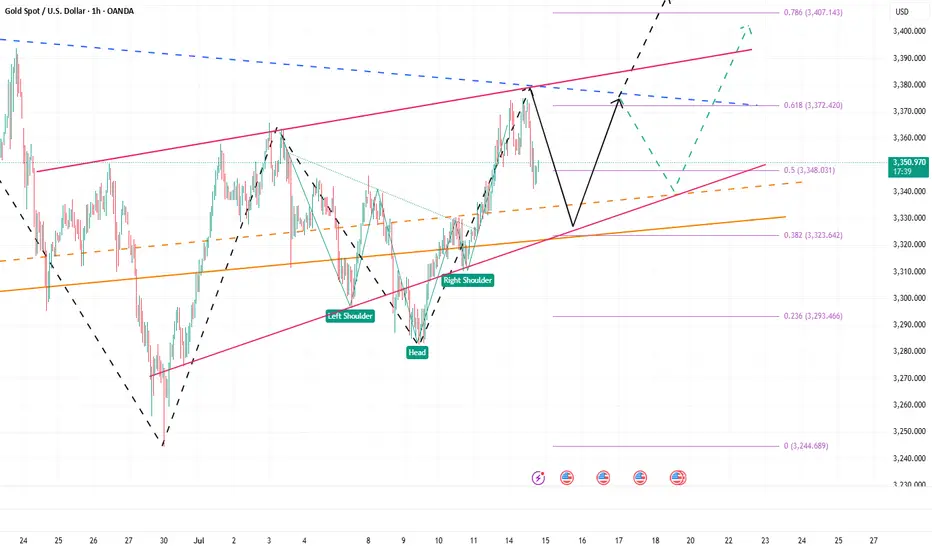
Eyes on 3335–3325: Next Bullish Launchpad!!!Today, gold hit 3375 several times and then fell back after encountering resistance. The lowest has reached 3341. Although the rising structure has not been completely destroyed, and the technical double bottom structure and the inverted head and shoulder structure support resonance effect still exist below, since gold fell below 3350, it has not even been able to stand above 3350 in the current rebound. The gold bull pattern has been weakened to a certain extent, and the market has begun to diverge in the long and short consciousness.
Gold encountered resistance and fell back near 3375 three times, proving that the upper resistance is relatively strong. Gold must increase liquidity by retracement to store more energy for breakthrough, so the short-term correction of gold is actually within my expectations, which is why I advocate brave shorting of gold today! However, according to the current retracement range and the fact that gold has been unable to stabilize above 3350, I believe that gold has not fallen to the right level and there is still room for retracement below. So I think gold will continue to pull back to test the 3335-3325 area. If gold retests this area and does not fall below, we can boldly go long on gold in this area.
Once gold rebounds after testing the 3335-3325 area, as liquidity increases, the market may form a strong bullish force to support gold to continue its rebound and continue to the 3380-3390 area, or even the 3400-3410 area.
Two lines of defense for bulls: 3340 and 3330 are the key!Gold maintains a strong pattern in the short term, and it is recommended to mainly buy on dips. The short-term support below focuses on the neckline of the hourly line at 3340 last Friday. The more critical support is locked at the 3330 line. This range is an important watershed for judging the continuation of short-term bullish momentum. As long as the daily level can remain stable above the 3330 mark, the overall trend will remain upward. Before falling below this position, we should adhere to the idea of buying low and buying low, and rely on key support levels to arrange long orders. At present, the price has completed a technical breakthrough and broke through the upper edge of the 3330 convergence triangle under the dual positive factors of Trump's tariff landing to stimulate risk aversion and the support of the Fed's interest rate cut expectations, and formed three consecutive positive daily lines. It is necessary to pay attention to the short-term pressure at the 3375 line. The overall operation strategy will be combined with the real-time trend prompts during the trading session, and pay attention to the bottom in time.
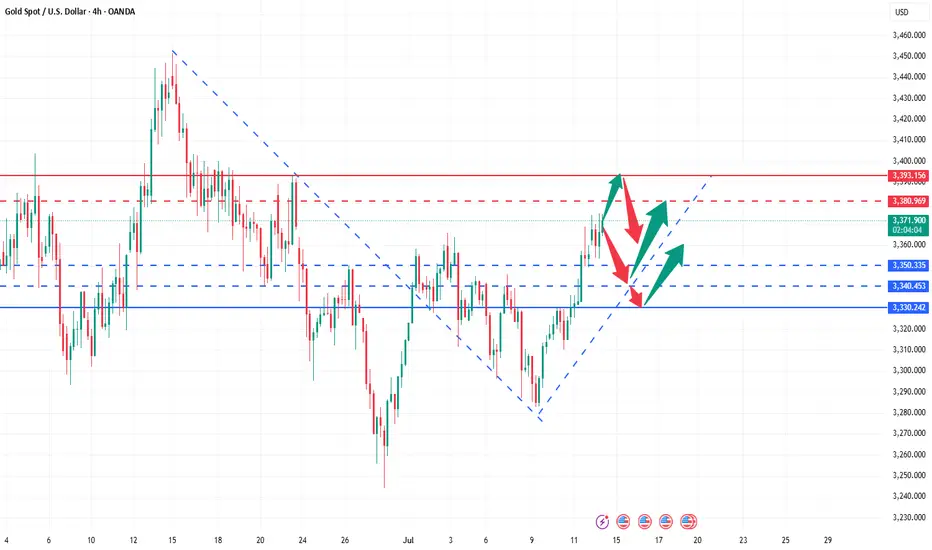
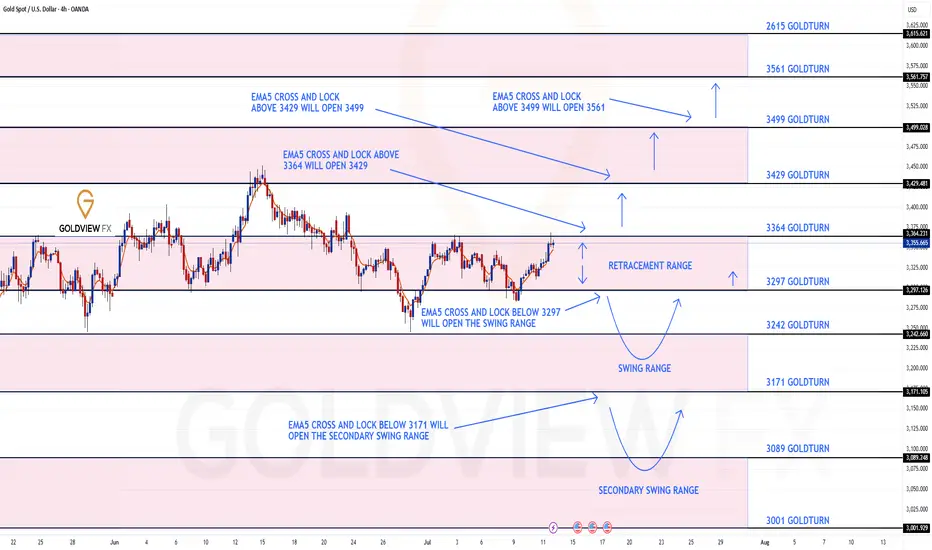
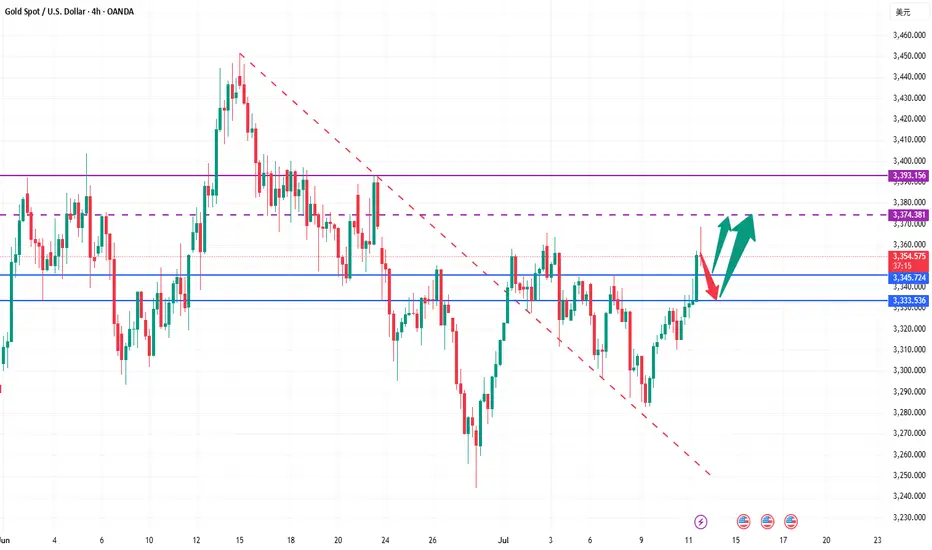
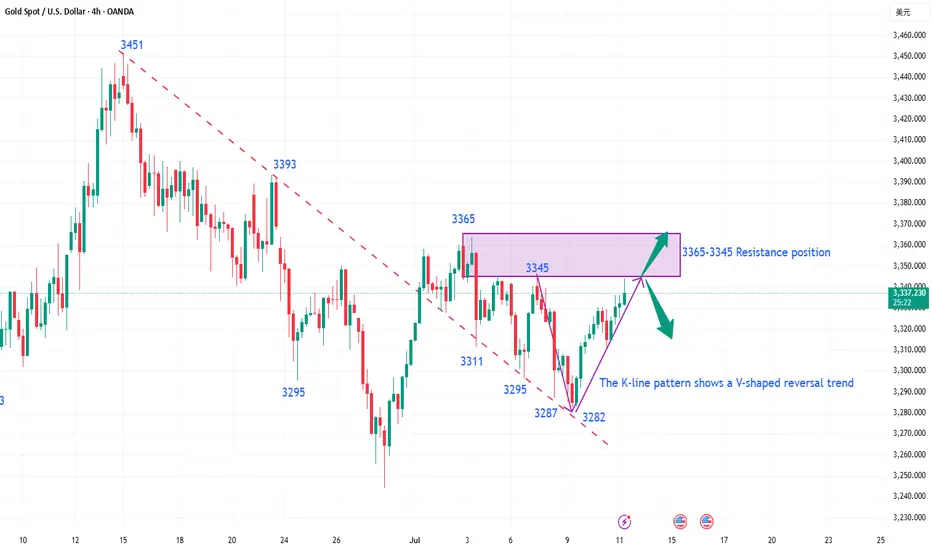
GOLD 4H CHART ROUTE MAP UPDATEHey Everyone,
Great start to the week with our chart idea playing out as analysed.
We started the week with our Bullish target 3364 HIT, followed with no ema5 lock confirming the rejection. Bearish target remains open and may complete with the rejection.
We will continue with our plans to buy dips, utilising the support levels from the bearish targets and/or Goldturns. Also keeping in mind our 1h chart, although gave a nice push up , the full Bullish gap remains open.
We will keep the above in mind when taking buys from dips. Our updated levels and weighted levels will allow us to track the movement down and then catch bounces up.
We will continue to buy dips using our support levels taking 20 to 40 pips. As stated before each of our level structures give 20 to 40 pip bounces, which is enough for a nice entry and exit. If you back test the levels we shared every week for the past 24 months, you can see how effectively they were used to trade with or against short/mid term swings and trends.
The swing range give bigger bounces then our weighted levels that's the difference between weighted levels and swing ranges.
BULLISH TARGET
3364 - DONE
EMA5 CROSS AND LOCK ABOVE 3364 WILL OPEN THE FOLLOWING BULLISH TARGETS
3429
EMA5 CROSS AND LOCK ABOVE 3429 WILL OPEN THE FOLLOWING BULLISH TARGET
3499
EMA5 CROSS AND LOCK ABOVE 3499 WILL OPEN THE FOLLOWING BULLISH TARGET
3561
BEARISH TARGETS
3297
EMA5 CROSS AND LOCK BELOW 3297 WILL OPEN THE SWING RANGE
3242
3171
EMA5 CROSS AND LOCK BELOW 3171 WILL OPEN THE SECONDARY SWING RANGE
3089
3001
As always, we will keep you all updated with regular updates throughout the week and how we manage the active ideas and setups. Thank you all for your likes, comments and follows, we really appreciate it!
Mr Gold
GoldViewFX

7.15 Gold Market Analysis and Operation SuggestionsFrom the 4-hour analysis, the short-term support below focuses on the neckline of the hourly line of last Friday, 3340-45, and focuses on the support of 3325-30. The intraday retracement continues to follow the trend and the main bullish trend remains unchanged. The short-term bullish strong dividing line focuses on the 3325 mark. The daily level stabilizes above this position and continues to follow the trend and bullish rhythm. Before falling below this position, continue to follow the trend and follow the trend. Maintain the main tone of participation.
Gold operation strategy:
1. Go long when gold falls back to 3340-45, and add more when it falls back to 3325-30, stop loss 3317, target 3365-70, and continue to hold if it breaks;
Gold rises strongly, aiming for a new high!Last Friday, gold continued to rise strongly, breaking through 3320 in the Asia-Europe session and accelerating its rise. The European session broke through the 3340 mark continuously. The US session broke through 3369 and then fell back. The daily line closed with a big positive line. It broke through the high for three consecutive days and returned to above 3360. The unilateral bullish pattern was re-established. Today, the gold price jumped high and broke through 3370 and then fluctuated at a high level. Although it rushed up, the strength was limited. It must be adjusted after a short-term retracement before it can continue to rise. Therefore, in terms of operation, we continue to maintain the main idea of retreating and multiplying. Pay attention to the 3340-3345 area for short-term support during the day, and look at the 3330 line for strong support. If it does not break, it will continue to be a good opportunity to buy low and do more. Taking advantage of the trend is still the current main tone. As long as the daily level does not break 3330, the bullish structure will not be destroyed.
🔹Support focus: 3340-3345, key support level 3330
🔹Resistance focus: 3380-3393 area
1️⃣ If the price falls back to 3340-3350, a light long position will be intervened, with the target of 3365-3370. A strong breakthrough can see a new high;
2️⃣ If the price rises to 3380-3393 and is under pressure, a short-term short position adjustment can be tried, with a short-term target of around 3360.
The specific real-time points and position arrangements will be updated at the bottom. Interested friends are advised to pay attention to my strategy tips in a timely manner and seize every opportunity reasonably.
Gold still has room to pull back, be brave and short gold!Gold continued to rebound today, and we also successfully gained 150pips profit in long gold trading. However, although gold is currently maintaining its upward trend, the rebound strength of gold is not strong during the European session, and it has repeatedly touched 3375 and then fell back, proving that there is still some resistance above. In my previous trading point of view, I also emphasized that gold is under pressure near 3380 in the short term. In addition, from a technical perspective, today's intraday high is limited to 3395.
So in order to dump the bullish momentum so that it can break through 3380 more smoothly, or even continue to above 3340, gold will inevitably have a retracement in the short term. So when most people in the market are still waiting for a retracement to go long on gold, I will definitely not waste the opportunity of gold retracement in vain.
So for short-term trading, I will consider shorting gold appropriately in the 3375-3395 area, with the target looking at 3360-3350. After gold falls back as expected, we might as well consider going long on gold at a low level.

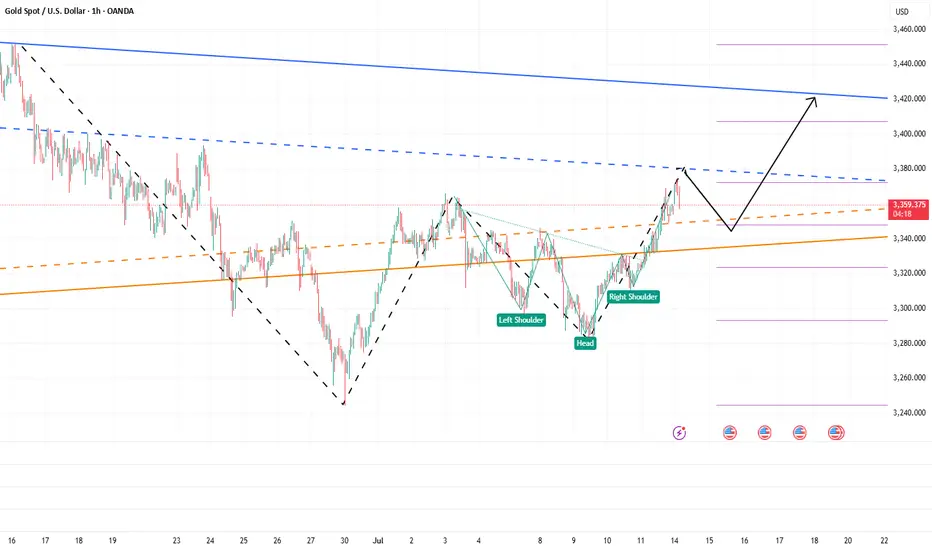
The bulls have started, aiming at 3400!Gold rose as soon as the market opened, and the highest has now reached above 3374. The upward momentum of gold is strong. It can be seen that after breaking through the recent high of 3365, its morphological structure has obviously tended to a bullish structure, and the technical form shows a "W" double bottom structure and an inverted head and shoulder resonance. The resonance of this technical structure will continue to support the continued rise of gold.
At present, gold is under pressure near the 3380 area in the short term, followed by the area near 3405. At present, gold has a technical retracement near 3380, but it is difficult to destroy the already formed rising structure based on the current retracement strength. Once gold rises again, 3380 will definitely be conquered! It will even continue to the 3400-3410 area; and the area with obvious short-term support is concentrated in the 3350-3340-3330 area, so gold may still rebound again with the support of this area after the decline, and continue to rise.
So for short-term trading, I would consider buying gold in batches based on the support of the 3350-3330 area, with the first target looking at 3380, followed by the 3400-3410 area.
It is the right time to go long after the shock and adjustmentGold opened higher at 3364 today, and after a brief surge to 3374, it entered a stage of shock and retracement. Our plan to arrange short orders near 3370 was successfully implemented, and we stopped profits in batches in the 3360-3355 range, making short-term profits. Overall, although it jumped higher due to the stimulus of news such as the increase in tariffs over the weekend, the momentum of the surge is limited, and the technical side still needs to retrace to digest the gains.
At present, the market has returned to the technical rhythm. The key support refers to the breakthrough point of 3340-3345 last Friday. Further exploration will look at the strong support of 3330. The overall rhythm is still mainly to arrange long orders near the low support, and going with the trend is the key. As long as the 3330 support is not broken, the daily line structure will still maintain a strong bullish trend. Do not blindly chase the short position. The operation of short orders against the trend needs to be particularly cautious. I will promptly remind you of the specific operation strategy according to the changes in the market. You can pay attention to the bottom notification. It is recommended that you keep paying attention and respond to the market rhythm steadily.
Reference for gold operation strategy: Go long on gold near the 3345-3355 area, target the 3365-3370 line. If it breaks above 3370, you can continue to hold and hope for further continuation.

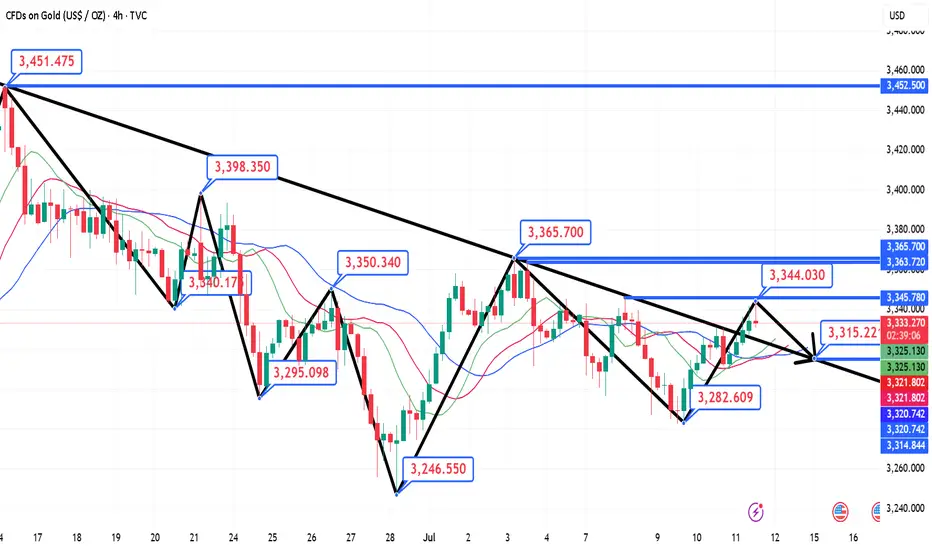
The 3400 mark will be the key for next week!Gold has been up and down this week, and the shock wash has intensified. It bottomed out and rebounded at 3282, and then steadily pulled up. After a slow rise to 3368 on Friday, the retracement was limited, and finally closed at 3355. So can gold be expected to be strong? Is it possible to reach 3400 next week? From the trend point of view, it is too early to say that it will turn strong. 3400 is an insurmountable barrier. Only by breaking through 3400 can we see a stable strong bull. If it is suppressed below 3400, the bulls will not be stable and may fall back at any time. We can only see large range fluctuations. From the overall trend point of view, gold is currently fluctuating widely in the large range of 3250-3400. It is safe to buy below 3300, and it is easy to go up. After all, it is still upward in the long run. Next week, we will focus on the gains and losses of the 3400 mark. It is not recommended to chase the high position directly on Monday. On the one hand, the interruption of the market after the weekend holiday can easily cause discontinuous rise. In addition, after three consecutive positive lines on the daily line, there will either be a negative correction and a fall, or a large positive volume. Combined with the current trend and rhythm of gold, be careful of a high-rise fall, and it is easy to get trapped by chasing long positions at high positions. Don't feel that it will soar as soon as it rises, and the high point of 3500 seems to be within reach; don't feel that it will fall sharply as soon as it falls, and the 3000 mark is not a dream. We should stay away from those who sing long when it rises and sing short when it falls. The direction is not because you see it, so you believe it, but because you believe it, so you see it. There will always be a time when you chase the rise and sell the fall and you will return with nothing.
Moreover, the high point of 3365 has not formed a substantial break and stabilized. On Monday, we still need to focus on the gains and losses of this position, so we need to look at it from two aspects:
1. If it rises directly at the opening, pay attention to the pressure near 3370-3380 and you can go short, and the target is 3350-3340!
2. If the market falls back at the opening, go long around 3340-3330, with the target above the high point of 3360-3368.
GOLD 4H CHART ROUTE MAP UPDATE & TRADING PLAN FOR THE WEEKHey Everyone,
Please see our updated 4h chart levels and targets for the coming week.
We are seeing price play between two weighted levels with a gap above at 3364 and a gap below at 3297. We will need to see ema5 cross and lock on either weighted level to determine the next range.
We will see levels tested side by side until one of the weighted levels break and lock to confirm direction for the next range.
We will keep the above in mind when taking buys from dips. Our updated levels and weighted levels will allow us to track the movement down and then catch bounces up.
We will continue to buy dips using our support levels taking 20 to 40 pips. As stated before each of our level structures give 20 to 40 pip bounces, which is enough for a nice entry and exit. If you back test the levels we shared every week for the past 24 months, you can see how effectively they were used to trade with or against short/mid term swings and trends.
The swing range give bigger bounces then our weighted levels that's the difference between weighted levels and swing ranges.
BULLISH TARGET
3364
EMA5 CROSS AND LOCK ABOVE 3364 WILL OPEN THE FOLLOWING BULLISH TARGETS
3429
EMA5 CROSS AND LOCK ABOVE 3429 WILL OPEN THE FOLLOWING BULLISH TARGET
3499
EMA5 CROSS AND LOCK ABOVE 3499 WILL OPEN THE FOLLOWING BULLISH TARGET
3561
BEARISH TARGETS
3297
EMA5 CROSS AND LOCK BELOW 3297 WILL OPEN THE SWING RANGE
3242
3171
EMA5 CROSS AND LOCK BELOW 3171 WILL OPEN THE SECONDARY SWING RANGE
3089
3001
As always, we will keep you all updated with regular updates throughout the week and how we manage the active ideas and setups. Thank you all for your likes, comments and follows, we really appreciate it!
Mr Gold
GoldViewFX
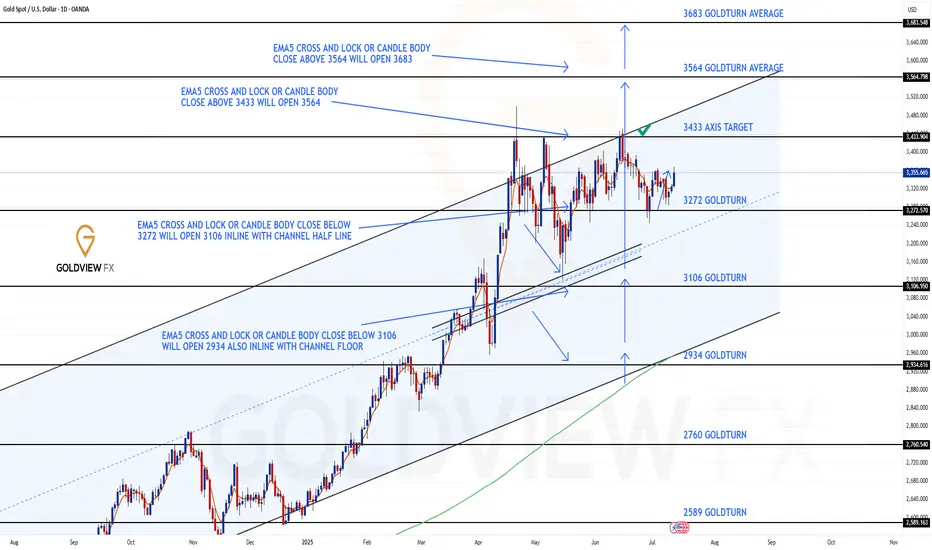
GOLD DAILY CHART ROUTE MAPHey Everyone,
Daily Chart Follow Up – Structure Still in Full Control
Just a quick update on our daily structure roadmap. Price continues to respect our Goldturn levels with surgical precision.
After the previous bounce off 3272, we’ve now seen over 800 pips of upside follow through. That level once again proved its weight, holding beautifully as support and launching price firmly back toward the upper boundary.
We now have a clear gap overhead at 3433, which sits right near the channel top a familiar rejection zone. With that in play, we’re expecting a range bound dynamic to develop between 3272 and 3433 in the short term.
Here’s what we’re focusing on next:
Range scenario active:
Until price breaks out cleanly, we anticipate swings between 3433 resistance and 3272 support to play out. This is the working range for now.
EMA5 cross and lock:
Watch for a clean EMA5 break and lock, this will be our technical confirmation for whether we’re breaking out of this range or just ping ponging inside it.
Structure remains intact:
No EMA5 breakdown off 3272 during the recent test means buyers remain in control. Until that changes, dips into 3272 continue to offer structured long setups.
Key Levels This Week
Support 3272 Proven bounce zone. As long as this holds, the structure favours upside.
Resistance 3433 Open gap + channel top confluence; expect reaction and potential fade unless we break cleanly with EMA5 confirmation.
As always, we continue to let structure guide the way, measured, deliberate, and data-driven.
Thanks again for all the continued support, every like, comment, and follow is truly appreciated.
Wishing you all a focused and profitable week ahead!
Mr Gold
GoldViewFX
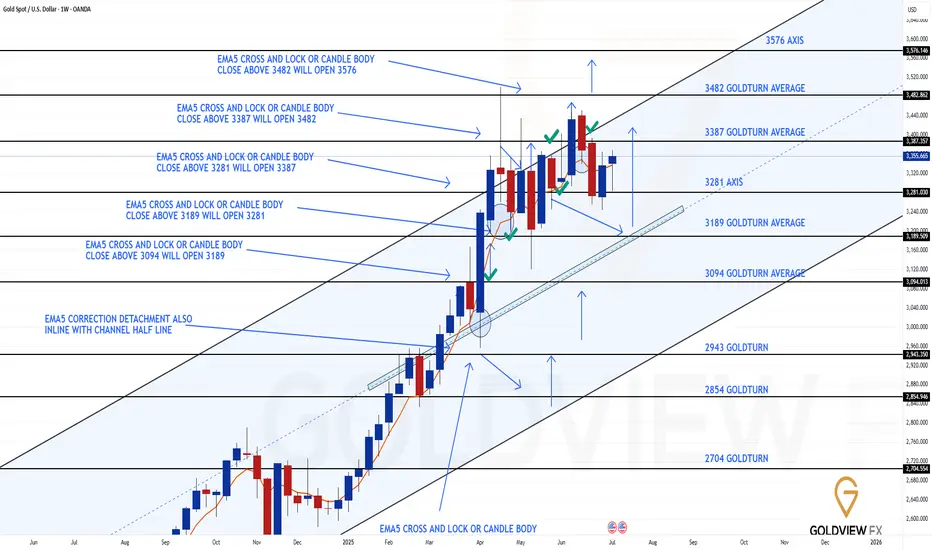
GOLD WEEKLY CHART MID/LONG TERM ROUTE MAPHey Everyone,
Please see update on our weekly chart idea.
Price delivered the rejection at the channel top, so our longer range gap at 3482 remains open overhead. The pullback rejection from channel top extended to 3281 axis precisely where buying interest stepped in, just before the rising channel mid-line, which is edging higher in tandem with price and keeping the broader structure intact.
Key take aways from the latest swing:
Support confirmed:
3281 held on a weekly closing basis, giving us the springboard we needed.
Bounce in motion:
We’ve already reclaimed the prior pivot zone and are now working on the 3387 gap fill; this is the near-term magnet before any attempt at the larger 3482 imbalance.
Structure unchanged:
The channel is still orderly, the EMA5 has curled but hasn’t locked bearishly, and the mid-line continues to ascend beneath price, favouring a measured, step wise climb.
Updated Levels to Watch:
Immediate Support 3281 Proven axis support
Resistance 1 3387 Gap fill target in progress; expect reaction.
Resistance 2 3482 Long standing weekly gap remains the bigger picture objective.
Plan: While 3281 holds, bias remains for a grind higher toward 3387 and ultimately 3482. Should 3281 fail, we reassess at the mid-line for the next structured long setup.
We remain patient and continue reacting to clean structure backed opportunities.
Mr Gold
GoldViewFX
Where will gold prices go at the weekly close?The mentality of trading is very important. At the same time, you must have clear ideas and decisive actions. Gold has been in a state of rapid growth. Many people are easily led to big losses by a small mistake. If you are worried about the loss at this time, you can choose to observe our daily operations in the group. The operations in the group are reasonable and well-founded, with real-time current price orders, and the returns are also considerable. Everyone is welcome to come and verify.
Gold risk aversion has driven gold to strengthen. The current bullish trend of gold is strong. The decline during the US trading session is still dominated by long positions. Technically, the 1-hour moving average forms a golden cross upward, indicating sufficient bullish momentum. After the gold price breaks through, it is confirmed that the support level of 3330 is effective, and the short-term support structure has been formed. It is recommended to wait for the second opportunity for the gold price to step back! Although the 1-hour chart shows that the current trend remains strong and the step-back amplitude is small, it is necessary to maintain a cautious attitude-even if the market is strong, it is not recommended to chase more, and it is necessary to guard against the risk of a deep correction in the gold price. In terms of operation, it is reminded that you can focus on the support level below: the first support level is 3345 (bull-bear watershed). If it falls below, pay attention to the key support of 3330. If the gold price falls back to around 3345 and stabilizes, you can consider a light position to try more.
Although the bulls are strong, don't chase them at high levelsGold trend analysis:
The market is fluctuating repeatedly now, and it is possible to rise or fall, but under the bullish trend, the main force is still rising. Therefore, this week's trading is to fall back and do more at a low price. Whether it is the previous 3285, 3306, or 3315, there are good profits. Although it is temporarily unable to break out of the bullish volume, at least the trend remains unchanged, and there will definitely be a large upward space in the future. Today is Friday, and we still pay attention to the possibility of bullish volume. This week, we have been emphasizing that if it rises during the week, we will see the 3370 high point. If 3370 breaks, there are still 3380 and 3400 above. On Friday, we will see whether this idea is realized.
From a technical point of view, there was a sharp pull this morning, with the big sun breaking through the upper track of the downward channel 3326 in the above figure, and then stepping back to confirm stabilization and bottoming out, which means that the breakthrough is effective, so you can directly follow the bullish trend in the morning, and during the European session, it repeatedly went up and down around the 3345-3332 range. With the experience of yesterday's trend, today we have been waiting for it to approach the 10-day moving average and then continue to be bullish on dips, and the entry point is basically good; currently it has broken through the resistance level of 3345 in the European session, so it depends on whether it can stand directly on it tonight. Once it stands, it can gradually rush to 3370, and the second is 3374, etc.; Of course, if it just pierces but does not stabilize, it will continue to spiral slowly upward around the yellow channel in the figure, so continue to wait patiently for the 10-day moving average, which is also the lower track position to grasp the low and long; Therefore, tonight gold 3345-3333 continues to rise on dips, with 3330 top and bottom positions as nodes, resistance at 3370, further resistance at 3374, etc.; If there is an unexpected big negative inducement to empty the market like yesterday, pay attention to stabilization above 3320 and still bullish;
Gold operation strategy: It is recommended to go long when it falls back to 3333-3345, and the target is 3360-3370.
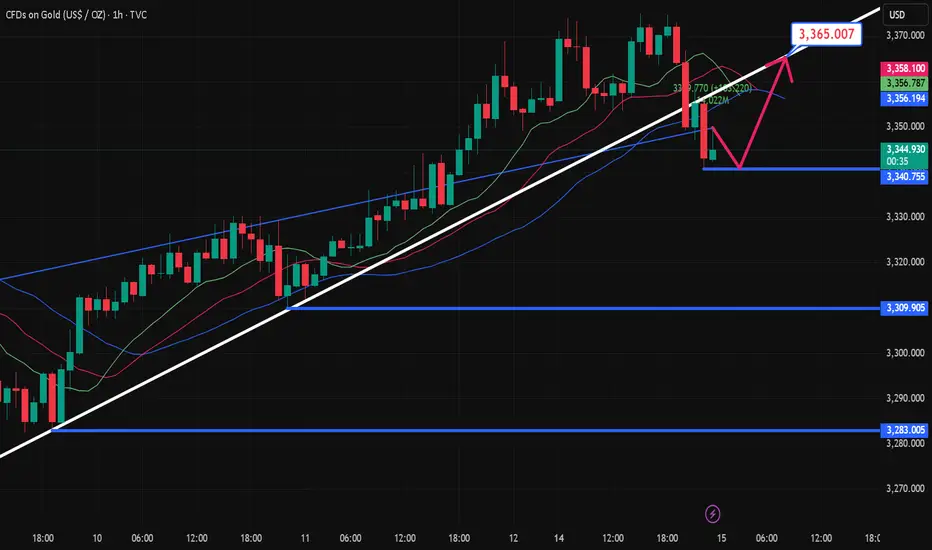
Continue to try to find the top of the band to short goldGold maintained a slow and volatile rise structure during the day. The highest has reached 3348, and it is only a step away from 3350. Will gold continue its upward momentum as usual?
In fact, it was beyond my expectation that gold could break through 3345 in the short term. According to my original expectation, the intraday high of gold was almost around 3345. Although the rebound of gold exceeded expectations, it is currently located near the resistance of 3348-3350, so I will definitely not give priority to chasing gold at high levels in short-term transactions.
Moreover, gold is currently in the resistance area of 3348-3350. The volatility of gold has converged, and the upward momentum has declined. As gold continues to rebound and faces the key resistance area again, the bulls are relatively more cautious. In this context, this resistance area may act as a catalyst, and the bears will react, leading the decline in gold. However, as gold rebounds and the support below gradually stabilizes, we can appropriately reduce the expectation of gold's decline and adjust the decline target to the 3330-3320 area.
So for short-term trading, I will still short gold based on the resistance area, trying to find a swing top in the 3340-3350 area, and look at the target area of 3330-3320.
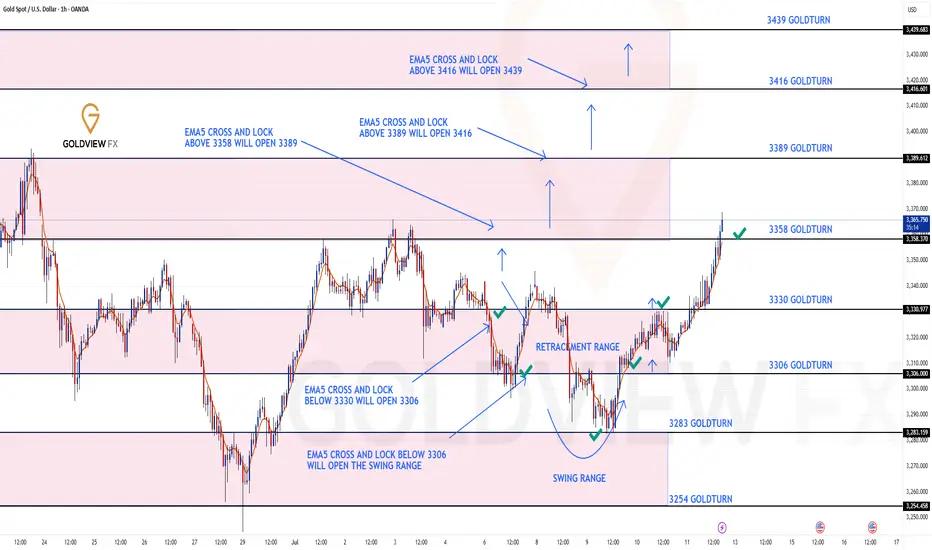
GOLD ROUTE MAP UPDATEHey Everyone,
Great finish to the week!!!
After completing our Bearish targets throughout the week, we got the swing perfectly, like we analysed and was waiting for our Bullish target to be complete.
- We got the Bullish target at 3358 HIT perfectly completing this range!!
BULLISH TARGET
3358 - DONE
BEARISH TARGETS
3330 - DONE
EMA5 CROSS AND LOCK BELOW 3330 WILL OPEN THE FOLLOWING BEARISH TARGET
3306 - DONE
EMA5 CROSS AND LOCK BELOW 3306 WILL OPEN THE SWING RANGE
3283 - DONE
We will now come back Sunday with a full multi timeframe analysis to prepare for next week’s setups, including updated views on the higher timeframes, EMA alignments, and structure expectations going forward.
Thanks again for all your likes, comments, and follows.
Wishing you all a fantastic weekend!!
Mr Gold
GoldViewFX
Try shorting once below 3355!The market closed at 3326 on Thursday and still failed to break through the small range of long and short positions. The overall market is in a strong bullish trend and this trend indicates the possibility of a breakout in the future. In this week's trading example, after confirming that the 3315 low support is effective, a short-term long operation was successfully carried out below the area and profited. The picture and truth can be checked in the article on Thursday. In the short term, continue to pay attention to the range shock and pay close attention to the breakthrough direction of key points. The first thing to pay attention to is the strong pressure of 3355. If it breaks through and stands firmly at this position, it will open up further upward space, and the potential target can be seen in the 3365 or even 3400 area. On the contrary, if the gold price is always under pressure below 3355, the market is likely to continue the current shock and consolidation rhythm. Therefore, breaking through the 3355 mark will be a key signal to judge whether the market can release significant upward momentum in the future. Before the effective breakthrough, continue to intervene in the low-long opportunity at the 3325-15 support level of the shock range. On the upper side, you can arrange short positions at 3345-3455.
How to seize gold trading opportunitiesNews:
On Friday (July 11) in the Asian time zone, US President Trump posted a "tariff change" on social media, announcing that a 35% tariff would be imposed on all Canadian goods from August 1, a 10 percentage point increase from the current rate. This decision was like a thunderbolt, instantly igniting the market's risk aversion sentiment, and the spot gold price soared, reaching a high of $3,344 per ounce during the session. Although Trump extended the tariff agreement to August 1, which once suppressed the gold price, he subsequently stated that it would not be extended after the expiration, and launched further tariff attacks after the expiration, announcing a new 50% tariff on copper imports from the United States and a 50% tariff on goods from Brazil, which increased concerns about tariff risks and pushed the gold price to rebound from the bottom;
Gold trend analysis:
The market is fluctuating repeatedly now, and it is possible to rise or fall, but under the bullish trend, the main force is still rising. Therefore, this week's trading is to fall back and do more at a low price. Whether it is the previous 3285, 3304, or 3317, there are good profits. Although it is temporarily unable to break out of the bullish volume, at least the trend remains unchanged, and there will definitely be a large upward space in the future. Today is Friday, and we still pay attention to the possibility of bullish volume. This Monday has been emphasizing that if it rises during the week, it will look at the 3345 high point. If 3345 breaks, there are still 3365 and 3400 above. Friday will see whether this idea is realized.
From a technical point of view, all cycles are obviously bullish now. The daily line bottomed out on Tuesday, and Wednesday and Thursday were all small broken Yang rising. If it continues, we will first see whether the daily Bollinger middle rail 3345 pressure is broken. After the break, the big Yang closes high. This wave of rise may reach 3400. Therefore, the daily cycle has a lot of room for growth and should not be taken lightly. The H4 cycle needs to see whether today's rise can break 3345, because if it breaks 3345, there is a possibility of the upper rail opening. After the upper rail opens, gold will have a unilateral trend. Therefore, today's bullish target is 3345. If 3345 is not broken, there is still a possibility of a decline. If 3345 breaks, there will be 3365 and 3400 above. Here, it is clearly bullish and optimistic about the break of 3345. After determining the direction, the trading idea on Friday is also clear. It must be mainly long on the decline. The support below is 3320-3310. Don't chase more in the European session. Trade again if there is a decline.
Gold operation strategy: It is recommended to go long if it falls back to around 3315-3325, with the target at 3335-3345; it is recommended to consider shorting if it touches 3345 but does not break, with the target at 3335-3325.
7.11 Gold bulls rise again, beware of the black swan coming on FYesterday, Thursday, the US dollar index rose first and then fell. It once approached the 98 mark before the US market, but then gave up most of the gains.
Yesterday, spot gold fluctuated around the 3320-30 US dollar mark. After the US market, it once touched 3310, but finally rebounded to above 3320 for consolidation.
Today, Friday, gold broke through the high point of 3330 yesterday in one fell swoop in the early trading.
So this is relatively good news for bulls.
If the high point of yesterday breaks through and stabilizes, it means that the bullish upward trend may continue today.
From the current 4-hour chart:
It can be found that the current 4-hour chart of gold has stabilized in the breakthrough range.
So if gold continues to go up, simply look at the previous high point.
The two recent high points are around 3345 and 3360.