Goldtradingstrategy

GOLD ROUTE MAP UPDATEHey Everyone,
Smashing start to the week with our chart idea playing out perfectly, as analysed.
We started the day with our first bullish target hit at 2645. This followed with ema5 cross and lock above 2645 opening 2661, which was hit perfectly completing this gap.
We now have a gap left at 2679, which fell just short and as long as 2661 holds, we will look for this gap to be completed. However, if we see ema5 lock below 2661, then we are likely to see lower Goldlturns tested to find support again.
We will keep the above in mind when taking buys from dips. Our updated levels and weighted levels will allow us to track the movement down and then catch bounces up.
We will continue to buy dips using our support levels taking 30 to 40 pips. As stated before each of our level structures give 20 to 40 pip bounces, which is enough for a nice entry and exit. If you back test the levels we shared every week for the past 24 months, you can see how effectively they were used to trade with or against short/mid term swings and trends.
BULLISH TARGET
2645 - DONE
EMA5 CROSS AND LOCK ABOVE 2645 WILL OPEN THE FOLLOWING BULLISH TARGET
2661 - DONE
EMA5 CROSS AND LOCK ABOVE 2661 WILL OPEN THE FOLLOWING BULLISH TARGET
2679
EMA5 CROSS AND LOCK ABOVE 2679 WILL OPEN THE FOLLOWING BULLISH TARGET
2697
BEARISH TARGETS
2626
EMA5 CROSS AND LOCK BELOW 2626 WILL OPEN THE FOLLOWING BEARISH TARGET
2612
EMA5 CROSS AND LOCK BELOW 2612 WILL OPEN THE SWING RANGE
SWING RANGE
2599 - 2584
As always, we will keep you all updated with regular updates throughout the week and how we manage the active ideas and setups. Thank you all for your likes, comments and follows, we really appreciate it!
Mr Gold
GoldViewFX
Gold trading zones: 09-DEC-2024Your daily Gold trading briefing: Zones, insights, and opportunities.

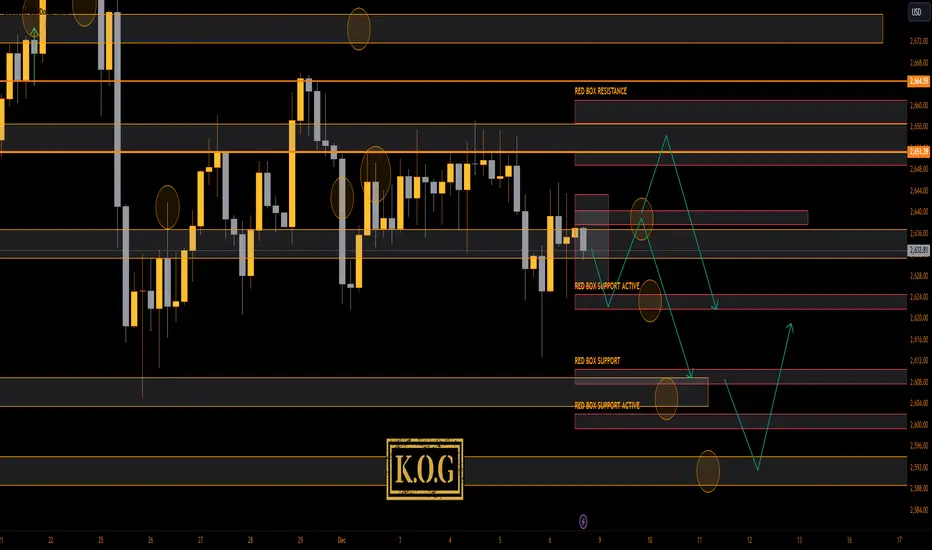
THE KOG REPORT THE KOG REPORT
In last week's KOG report we said to expect choppy price action, but we did not expect it to last the whole week! What a week however, the range allowing traders to trade within it up and down making the most of the levels on the boxes and Excalibur. We gave the weekly key level as 2620 which we said will need to break to go lower, otherwise, opportunities from that level were available and worked well.
On Friday we published the NFP report, again giving the key level for the push up 2625, this also worked well for traders, with the bonus of the short to end the week. A fantastic week for traders with us completing a phenomenal 37 targets across the markets!
We had that higher region of 2670 which however was not visited, so is it still available? Let’s dive in.
So, what can we expect from the week ahead?
This week we would expect this price action to continue, the range getting a little larger but the up and down movement making it difficult to hold position, at least for the first part of the week. We have that key level of resistance above again at 2650 with that level of 2670 still active on our books. For that reason, we feel this decline isn’t ready just yet, but the lower levels are available for consideration. Support below 2620 and below that the 2610 level are opportunities if we can continue this slow decline downside. We have the extension of the move at 2590 as key level support, so we feel that’s the ideal long trade for the swing up, if attacked.
Looking at the chart in more detail, and applying the red boxes, we can see we have defence above at 2635-40, which if held, can continue this move down into the red box 2625 as the immediate level for the range. A break of that level will take us further into breaker move 2610 and 2590 before any exhaustion.
As we close in to the festive period, we can expect volume to be thin over the coming weeks as well as sudden burst of profit taking, so please trade carefully for the remainder of the month, reduce your lot sizes and make sure you have a sensible risk model in place.
KOG’s Bias for the week:
Bearish below 2665 with targets below 2620 and below that 2610
Bullish on break of 2665 with targets above 2670 and above that 2685
RED BOXES:
Break above 2639 for 2650, 2660, 2663 and 2670 in extension of the move
Break below 2627 for 2620, 2610 and 2595 in extension of the move
Please do support us by hitting the like button, leaving a comment, and giving us a follow. We’ve been doing this for a long time now providing traders with in-depth free analysis on Gold, so your likes and comments are very much appreciated.
As always, trade safe.
KOG
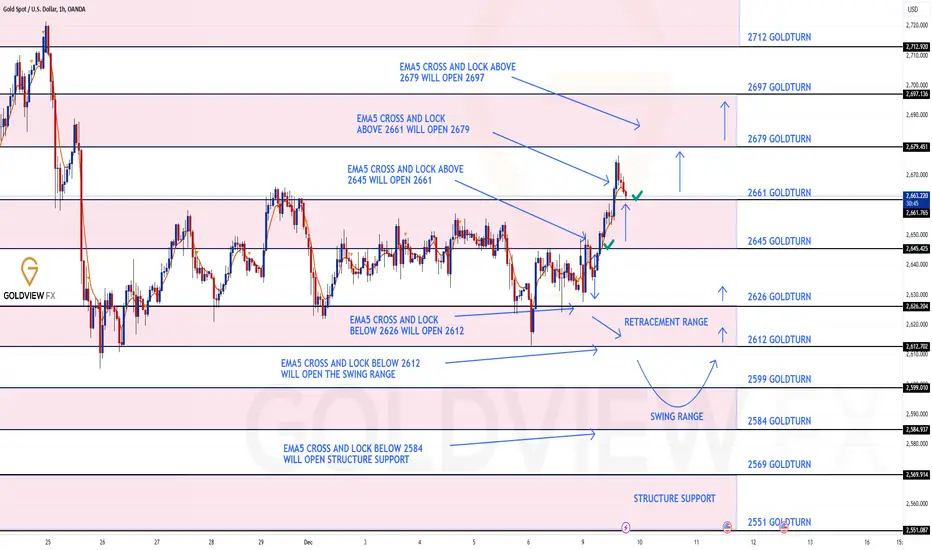
GOLD 1H CHART ROUTE MAP & TRADING PLAN FOR THE WEEKHey Everyone,
Please see our updated 1h chart levels and targets for the coming week.
We are seeing price play between two weighted levels with a gap above at 2645 and a gap below at 2626. We will need to see ema5 cross and lock on either weighted level to determine the next range.
We will see levels tested side by side until one of the weighted levels break and lock to confirm direction for the next range.
We will keep the above in mind when taking buys from dips. Our updated levels and weighted levels will allow us to track the movement down and then catch bounces up.
We will continue to buy dips using our support levels taking 30 to 40 pips. As stated before each of our level structures give 20 to 40 pip bounces, which is enough for a nice entry and exit. If you back test the levels we shared every week for the past 24 months, you can see how effectively they were used to trade with or against short/mid term swings and trends.
BULLISH TARGET
2645
EMA5 CROSS AND LOCK ABOVE 2645 WILL OPEN THE FOLLOWING BULLISH TARGET
2661
EMA5 CROSS AND LOCK ABOVE 2661 WILL OPEN THE FOLLOWING BULLISH TARGET
2679
EMA5 CROSS AND LOCK ABOVE 2679 WILL OPEN THE FOLLOWING BULLISH TARGET
2697
BEARISH TARGETS
2626
EMA5 CROSS AND LOCK BELOW 2626 WILL OPEN THE FOLLOWING BEARISH TARGET
2612
EMA5 CROSS AND LOCK BELOW 2612 WILL OPEN THE SWING RANGE
SWING RANGE
2599 - 2584
As always, we will keep you all updated with regular updates throughout the week and how we manage the active ideas and setups. Thank you all for your likes, comments and follows, we really appreciate it!
Mr Gold
GoldViewFX

GOLD 4H CHART ROUTE MAP & TRADING PLAN FOR THE WEEKHey Everyone,
Please see our updated 4h chart levels and targets for the coming week.
We are seeing price lay between two weighted levels with a gap above at 2648 and a gap below at 2629, as weighted Goldturns and will need ema5 cross and lock on either weighted level to determine the next range.
We will see levels tested side by side until one of the weighted levels break and lock to confirm direction for the next range.
We will keep the above in mind when taking buys from dips. Our updated levels and weighted levels will allow us to track the movement down and then catch bounces up.
We will continue to buy dips using our support levels taking 30 to 40 pips. As stated before each of our level structures give 20 to 40 pip bounces, which is enough for a nice entry and exit. If you back test the levels we shared every week for the past 24 months, you can see how effectively they were used to trade with or against short/mid term swings and trends.
BULLISH TARGET
2648
EMA5 CROSS AND LOCK ABOVE 2648 WILL OPEN THE FOLLOWING BULLISH TARGET
2675
EMA5 CROSS AND LOCK ABOVE 2675 WILL OPEN THE FOLLOWING BULLISH TARGET
2701
EMA5 CROSS AND LOCK ABOVE 2701 WILL OPEN THE FOLLOWING BULLISH TARGET
2726
EMA5 CROSS AND LOCK ABOVE 2726 WILL OPEN THE FOLLOWING BULLISH TARGET
2749
BEARISH TARGETS
2629
EMA5 CROSS AND LOCK BELOW 2729 WILL OPEN THE FOLLOWING BEARISH TARGET
2604
EMA5 CROSS AND LOCK BELOW 2604 WILL OPEN THE SWING RANGE
SWING RANGE
2583 - 2561
As always, we will keep you all updated with regular updates throughout the week and how we manage the active ideas and setups. Thank you all for your likes, comments and follows, we really appreciate it!
Mr Gold
GoldViewFX

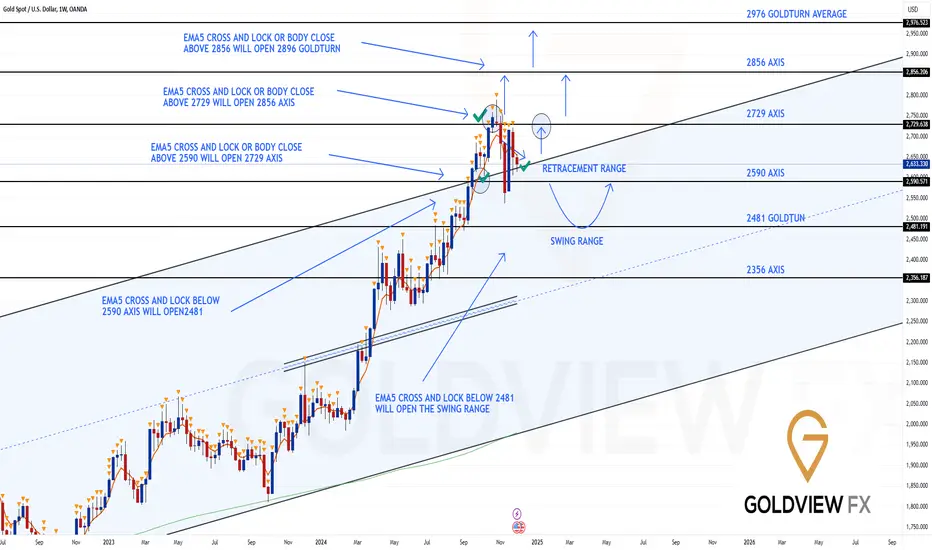
WEEKLY CHART MID/LONG TERM ROUTE MAPHey Everyone,
Another update on the weekly chart idea we have been tracking for over a month now and still playing out as analysed.
As stated already this chart allowed us to project the long term corrections and direction. We are using this chart to track our bullish targets until no ema5 lock to confirm rejections on the levels.
The channel top is continuing to provide support like we stated last week, although we saw candle body close below the channel 2 weeks ago, there was no ema5 break into the channel confirming the support and rejection, which allowed us to identify the fake-out and confirm the support.
This is the beauty of our Gold channels, which we draw in our unique way, using averages rather than the price. This enables us to identify fake-outs and breakouts clearly, as minimal noise in the way our channels are drawn.
As long as we see no lock below into the channel, we cane safely continue with our plans to buy dips in this range.
We will continue to track the movement down and trade the bounces up, inline with our plans to buy dips, using our smaller time-frames, keeping in mind the long range gaps above for the future.
Thank you all for your likes, comments and follows, we really appreciate it!
Mr Gold
GoldViewFX
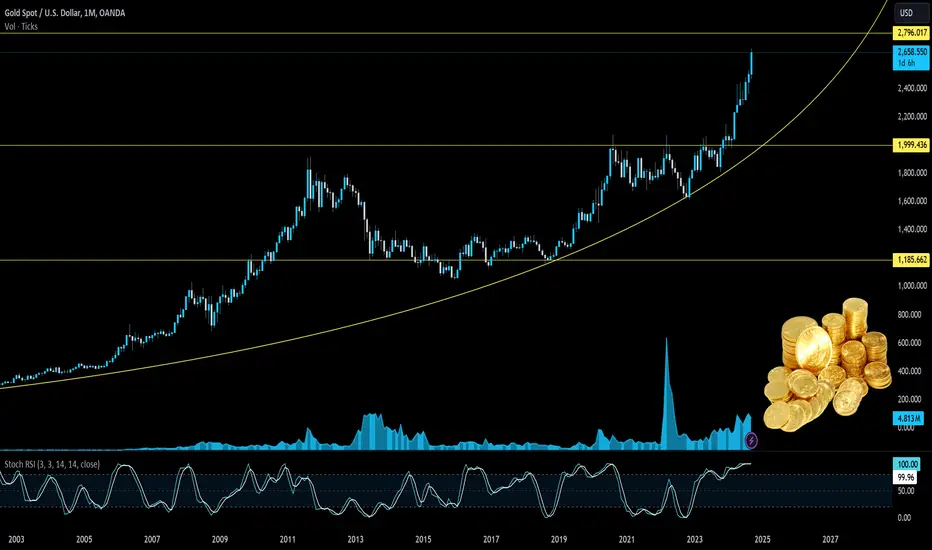
GOLD MONTHLY CHART LONG TERM/RANGE ROUTE MAPHey Everyone,
This is the monthly chart idea for our long term/range analysis, which we shared last update in November. Previously after completing the bull targets, we were left with a big detachment to ema5. This was hit and completed for the correction, as highlighted by the circle on the chart, which also gave the bounce, allowing us to buy dips inline with our plans.
This month also started with a detachment to ema5 below for a correction, which was nearly completed and can be pulled up to complete, also highlighted with a small mini circle on the charts for visual purpose.
This area above 2689 is a strong level of support with ema5 providing dynamic support now for a bounce. Each of the lower Goldturn levels below are likely to give re-actional bounces just like our shorter time frame ideas.
However, we will keep in mind the channel top that may require a support test. We will continue use all support structures, across all our multi time frame chart ideas to buy dips also keeping in mind our long term gap above. Short term we may look bearish but looking at the monthly chart allows us to see the bigger picture and the overall long term Bullish trend.
As always, we will keep you all updated with regular updates throughout the week and how we manage the active ideas and setups. Thank you all for your likes, comments and follows, we really appreciate it!
Mr Gold
GoldViewFX

GOLD ROUTE MAP UPDATEHey Everyone,
A Piptastic finish to the week with our chart levels respecting and playing out like we analysed.
We tracked and traded the 1H chart all week, which was playing in a tight range, allowing us to use the weighted levels for the bounces throughout the week, taking advantage of the 30 to 40 pip weighted bounces.
This is now the 4h chart that we shared on Sunday and as you can see the retracement range was tested to perfection today, clearing 2612 bearish target, followed with the bounce just like we stated, completing the week with a bag full of pips.
We will now come back Sunday with our updated Multi time-frame analysis, Gold route map and trading plans for the week ahead.
Have a smashing weekend!! And once again, thank you all for your likes, comments and follows, we really appreciate it!
Mr Gold
GoldViewFX
GOLD DAILY CHART UPDATEHey Everyone,
Another ranging day on the charts today, which works perfectly with our strategy and plans to buy dips, as we are able to continue to use the weighted level to take the bounces.
Please see the daily chart update, to give you all an overall view of the range. We are playing between two weighted levels 2629 and 2686. 2629 is still providing support with no ema5 lock below.
This is allowing us to use our smaller timeframe analysis on the 1H chart to buy dips from the weighted Goldturns for 30 to 40 pips clean. Ranging markets are perfectly suited for this type of trading, instead of trying to hold longer positions and getting chopped up in the swings up and down in the range.
We will keep the above in mind when taking buys from dips. Our updated levels and weighted levels will allow us to track the movement down and then catch bounces up using our smaller timeframe ideas.
Our long term bias is Bullish and therefore we look forward to drops like this, which allows us to continue to use our smaller timeframes to buy dips using our levels and setups.
Buying dips allows us to safely manage any swings rather then chasing the bull from the top.
Thank you all for your likes, comments and follows, we really appreciate it!
Mr Gold
GoldViewFX

Gold trading insights: 05-DEC-2024Gold trading insights: Not signals, but informative zones to aid your decision-making. Please note: These zones are not trading advice. Use them as a starting point for your own analysis.

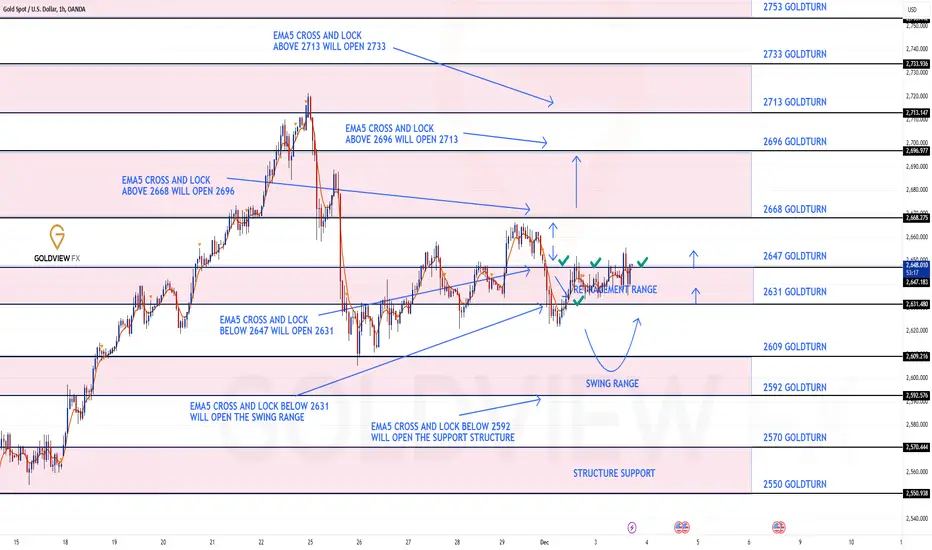
GOLD ROUTE MAP UPDATEHey Everyone,
Once again our chart idea delivered the goods with our weighted retracement level providing support and bounce like we highlighted.
We were once again able to buy dips inline with our plans with the movement from 2631 to 2647. However, now we have ema5 cross and lock above 2647 opening the range above.
We have been in a similar play range all week with both ranges below and above now left open. This is typical of ranging market conditions and as always our strategy to buy dips from our weighted levels allows us to navigate the traps and secure the pips.
Our lower weighted levels are in place for bounces inline with our plans, should we see a failure to fill the gap above and see a drop below.
We will keep the above in mind when taking buys from dips. Our updated levels and weighted levels will allow us to track the movement down and then catch bounces up.
We will continue to buy dips using our support levels taking 30 to 40 pips. As stated before each of our level structures give 20 to 40 pip bounces, which is enough for a nice entry and exit. If you back test the levels we shared every week for the past 24 months, you can see how effectively they were used to trade with or against short/mid term swings and trends.
BULLISH TARGET
2668
EMA5 CROSS AND LOCK ABOVE 2668 WILL OPEN THE FOLLOWING BULLISH TARGET
2696
EMA5 CROSS AND LOCK ABOVE 2696 WILL OPEN THE FOLLOWING BULLISH TARGET
2713
EMA5 CROSS AND LOCK ABOVE 2713 WILL OPEN THE FOLLOWING BULLISH TARGET
2733
BEARISH TARGETS
2647 - DONE
EMA5 CROSS AND LOCK BELOW 2647 WILL OPEN THE FOLLOWING BEARISH TARGET
2631 - DONE
EMA5 CROSS AND LOCK BELOW 2631 WILL OPEN THE SWING RANGE
SWING RANGE
2609 - 2592
As always, we will keep you all updated with regular updates throughout the week and how we manage the active ideas and setups. Thank you all for your likes, comments and follows, we really appreciate it!
Mr Gold
GoldViewFX
Gold Valuable Insights: 04-DEC-2024 Today's Gold trading zones: For educational purposes only. Use at your own risk.

GOLD ROUTE MAP UPDATEHey Everyone,
Another great day on the charts today, allowing us to continue to track and trade our route map.
Playing in a tight range today and therefore not much update needed from yesterday. We are in a similar play range, as price is still within the retracement range, allowing us to buy dips into 2647. We need a ema5 cross and lock above 2647 for a continuation above.
Our lower weighted levels are in place for bounces inline with our plans to buy dips, should we see a failure to lock above and see a drop below.
We will keep the above in mind when taking buys from dips. Our updated levels and weighted levels will allow us to track the movement down and then catch bounces up.
We will continue to buy dips using our support levels taking 30 to 40 pips. As stated before each of our level structures give 20 to 40 pip bounces, which is enough for a nice entry and exit. If you back test the levels we shared every week for the past 24 months, you can see how effectively they were used to trade with or against short/mid term swings and trends.
BULLISH TARGET
2668
EMA5 CROSS AND LOCK ABOVE 2668 WILL OPEN THE FOLLOWING BULLISH TARGET
2696
EMA5 CROSS AND LOCK ABOVE 2696 WILL OPEN THE FOLLOWING BULLISH TARGET
2713
EMA5 CROSS AND LOCK ABOVE 2713 WILL OPEN THE FOLLOWING BULLISH TARGET
2733
BEARISH TARGETS
2647 - DONE
EMA5 CROSS AND LOCK BELOW 2647 WILL OPEN THE FOLLOWING BEARISH TARGET
2631 - DONE
EMA5 CROSS AND LOCK BELOW 2631 WILL OPEN THE SWING RANGE
SWING RANGE
2609 - 2592
As always, we will keep you all updated with regular updates throughout the week and how we manage the active ideas and setups. Thank you all for your likes, comments and follows, we really appreciate it!
Mr Gold
GoldViewFX
Gold Insights: 03-DEC-2024Discover today's Gold trading zones and refine your market analysis skills.

Gold zones: 02-Dec-2024Happy New Month! Improve your trading strategy with our Gold zones. Understand market dynamics and make informed decisions.

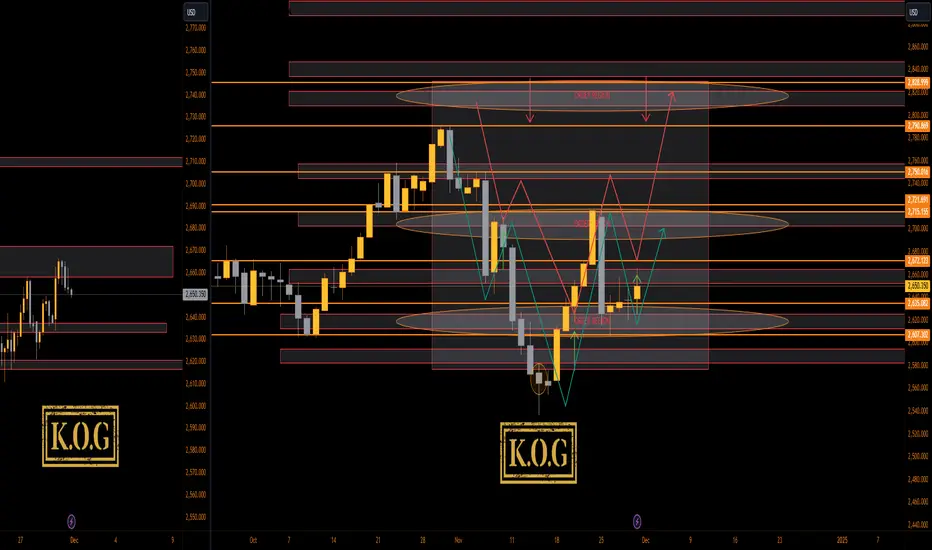
THE KOG REPORT - ELECTION SPECIAL - UpdateQuick update on our Election special chart which we posted prior to the election giving our view of what to expect in terms of movement in Gold.
The Red arrow was the projected path, the green arrow is real time movement.
Can quite honestly say it's worked well for us, not exact, but close enough when fine tuned with the red boxes, Knights inid, and of course Excalibur.
We'll keep tracking this.
Please do support us by hitting the like button, leaving a comment, and giving us a follow. We’ve been doing this for a long time now providing traders with in-depth free analysis on Gold, so your likes and comments are very much appreciated.
As always, trade safe.
KOG
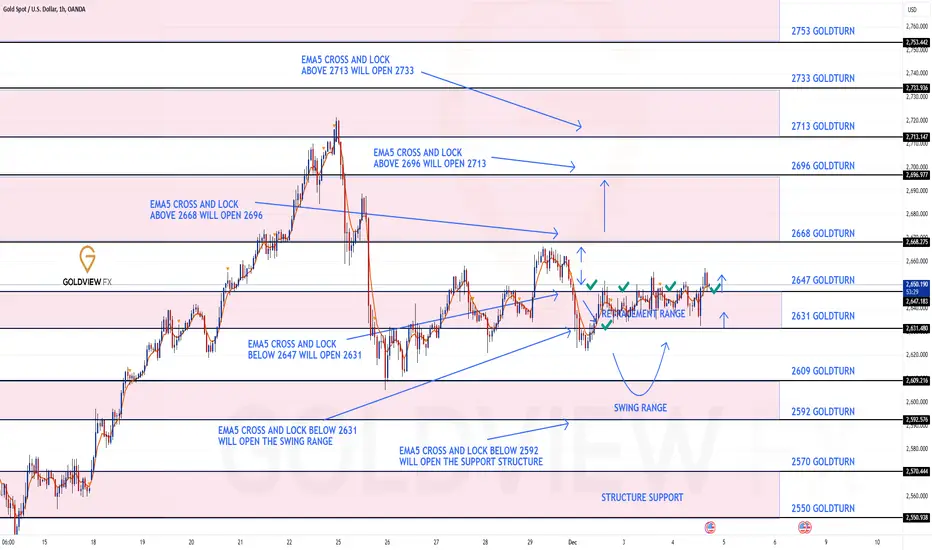
GOLD 1H CHART ROUTE MAP & TRADING PLAN FOR THE WEEKHey Everyone,
Please see our updated 1h chart levels and targets for the coming week.
We are seeing EMA5 play between two weighted levels with a gap above at 2668 and a gap below at 2647. We will need to see ema5 cross and lock on either weighted level to determine the next range.
We will see levels tested side by side until one of the weighted levels break and lock to confirm direction for the next range.
We will keep the above in mind when taking buys from dips. Our updated levels and weighted levels will allow us to track the movement down and then catch bounces up.
We will continue to buy dips using our support levels taking 30 to 40 pips. As stated before each of our level structures give 20 to 40 pip bounces, which is enough for a nice entry and exit. If you back test the levels we shared every week for the past 24 months, you can see how effectively they were used to trade with or against short/mid term swings and trends.
BULLISH TARGET
2668
EMA5 CROSS AND LOCK ABOVE 2668 WILL OPEN THE FOLLOWING BULLISH TARGET
2696
EMA5 CROSS AND LOCK ABOVE 2696 WILL OPEN THE FOLLOWING BULLISH TARGET
2713
EMA5 CROSS AND LOCK ABOVE 2713 WILL OPEN THE FOLLOWING BULLISH TARGET
2733
BEARISH TARGETS
2647
EMA5 CROSS AND LOCK BELOW 2647 WILL OPEN THE FOLLOWING BEARISH TARGET
2631
EMA5 CROSS AND LOCK BELOW 2631 WILL OPEN THE SWING RANGE
SWING RANGE
2609 - 2592
As always, we will keep you all updated with regular updates throughout the week and how we manage the active ideas and setups. Thank you all for your likes, comments and follows, we really appreciate it!
Mr Gold
GoldViewFX

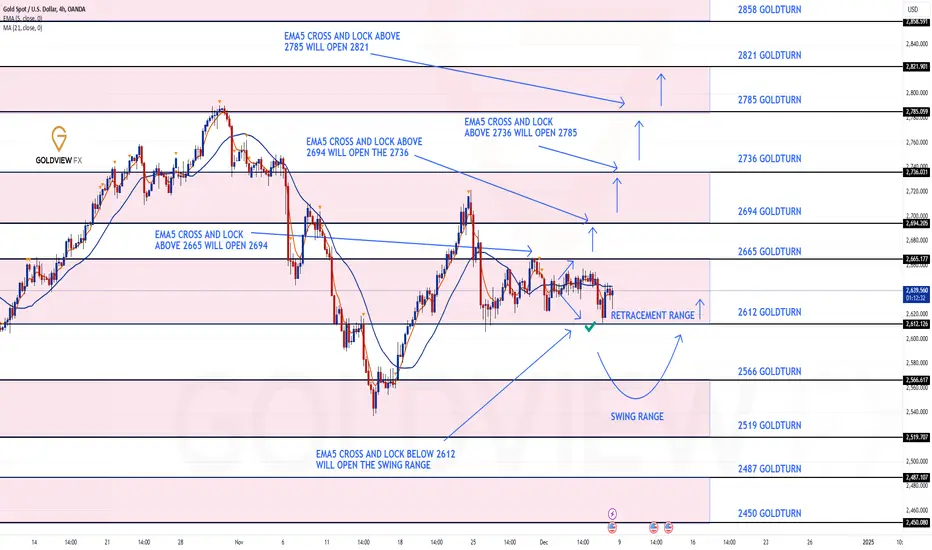
GOLD 4H CHART ROUTE MAP & TRADING PLAN FOR THE WEEKHey Everyone,
Please see our updated 4h chart levels and targets for the coming week.
We are seeing price lay between two weighted levels with a gap above at 2665 and a gap below at 2612, as weighted Goldturns and will need ema5 cross and lock on either weighted level to determine the next range.
We will see levels tested side by side until one of the weighted levels break and lock to confirm direction for the next range.
We will keep the above in mind when taking buys from dips. Our updated levels and weighted levels will allow us to track the movement down and then catch bounces up.
We will continue to buy dips using our support levels taking 30 to 40 pips. As stated before each of our level structures give 20 to 40 pip bounces, which is enough for a nice entry and exit. If you back test the levels we shared every week for the past 24 months, you can see how effectively they were used to trade with or against short/mid term swings and trends.
BULLISH TARGET
2665
EMA5 CROSS AND LOCK ABOVE 2665 WILL OPEN THE FOLLOWING BULLISH TARGET
2694
EMA5 CROSS AND LOCK ABOVE 2694 WILL OPEN THE FOLLOWING BULLISH TARGET
2736
EMA5 CROSS AND LOCK ABOVE 2736 WILL OPEN THE FOLLOWING BULLISH TARGET
2785
BEARISH TARGETS
2612
EMA5 CROSS AND LOCK BELOW 2612 WILL OPEN THE SWING RANGE
SWING RANGE
2566 - 2519
As always, we will keep you all updated with regular updates throughout the week and how we manage the active ideas and setups. Thank you all for your likes, comments and follows, we really appreciate it!
Mr Gold
GoldViewFX

GOLD DAILY CHART MID/LONG TERM UPDATE.Hey Everyone,
Please see our mid to long term daily chart update.
After completing our bullish targets 2629 and 2686 we were left with a candle body close above 2686 leaving a gap above at 2760 last week and stated that we needed ema5 cross and lock to confirm this or a rejection will see the lower Goldlturn levels for support.
- EMA5 failed to cross 2686 with a turn confirming the rejection. We are enow seeing a test at the 1st stage of the retracement range at 2629 and expecting a reaction here for a bounce. EMA5 cross and lock below this level will confirm test for the full retracement range. Failure to lock below will see bounce from this retracement range inline with our plans to buy dips.
We will keep the above in mind when taking buys from dips. Our updated levels and weighted levels will allow us to track the movement down and then catch bounces up using our smaller timeframe ideas.
Our long term bias is Bullish and therefore we look forward to drops like this, which allows us to continue to use our smaller timeframes to buy dips using our levels and setups.
Buying dips allows us to safely manage any swings rather then chasing the bull from the top.
Thank you all for your likes, comments and follows, we really appreciate it!
Mr Gold
GoldViewFX

WEEKLY CHART MID/LONG TERM ROUTE MAPHey Everyone,
This is an update on the weekly chart idea we have been tracking for over a month now and playing out exactly like we analysed.
Last week we stated that this chart allowed us to project the long term corrections and direction. We were able to track our bullish targets until no ema5 lock to confirm rejection into the retracement range below for the correction.
We also remined everyone that we had been suggesting over the last few weeks that we will be looking for the channel top and the retracement range to provide the support for a reactional bounce.
- This played out perfectly last week with the weekly candle testing the channel top and then wicked out for the support and bounce like we analysed.
Overall the channel top is providing the support like we analysed. Although we saw candle body closes below the channel there was no ema5 break into the channel, which allowed us to identify the fake-out and confirm the support. This is the beauty of our Gold channels, which we draw in our unique way, using averages rather than the price. This enables us to identify fake-outs and breakouts clearly, as minimal noise in the way our channels are drawn.
We will continue to track the movement down and trade the bounces up, inline with our plans to buy dips, using our smaller time-frames, keeping in mind the long range gaps above for the future..
Thank you all for your likes, comments and follows, we really appreciate it!
Mr Gold
GoldViewFX

GOLD UPSIDE IDEAPrevious idea cause us to think about 2770 zone for shorts. but price retrace, I conclude this idea can go higher either.
This is only my view. my longterm target would be the previous ATH.
this is not a financial advice. stoploss at below the candle of 2581. so you could have small stoploss at 2577.
Trade wisely.
Goodluck. Ciao....

Gold Becomes the Second Largest Central Bank Reserve AssetGold's importance as a reserve asset for central banks is on the rise
According to Bank of America, gold has now overtaken the euro to become the second largest reserve asset, To be more precise, B of A should have specified that it is the eastern hemisphere Central Banks that are diversifying out of the U.S. dollar and the euro and buying gold and yuan. Currently, gold accounts for 16% of global bank reserves, while the dollar has dropped to about 58%, down from over 70% in 2002.
Poland emerged as the largest buyer of gold in the second quarter of this year (though the specific amount purchased by China's PBoC remains undisclosed). Additionally, Poland is requiring that the gold it acquires be delivered directly to its Central Bank, rather than being stored by London banks. Turkey is another significant gold purchaser, and several African nations have also announced plans to increase Central Bank gold reserves.
While it may not happen immediately, there’s potential for gold to surpass the dollar as the top reserve asset, especially if the BRIC nations and other Eastern hemisphere countries go forward with their rumored plans for a gold-backed trade currency. A BRICS Summit will be held in Kazan, Russia, from October 22nd to 24th, where discussions on a new trading currency may take place, though this has not been officially confirmed.
On September 5th, Russia announced plans to ramp up its daily gold purchases from $13.5 million to $93 million (1.2 billion rubles to 8.2 billion rubles) for the next month, using surplus revenue from oil and gas. This information was reported by the Russian news agency, Interfax. This move seems to align with the potential development of a BRICS gold-backed trade settlement currency, or even a broader gold-backed currency system.
I raise this point because the U.S. Federal Reserve is in a difficult position. It’s facing immense pressure from the market and Wall Street to reduce interest rates, but doing so could trigger a sharp decline in the value of the dollar.
The chart referenced above shows a 5-year daily performance of the US dollar index, with the dollar currently testing the 100 level—a key technical support since early 2023. If the Federal Reserve begins cutting interest rates, it's highly likely the dollar will fall to 90, a level last seen in mid-2021. This decline would likely push gold prices toward $3,000 and silver toward $50.
A weakening dollar presents several challenges. First, it could accelerate the reduction in the dollar's role as a reserve asset for global central banks. Even more concerning for the US, a depreciating dollar coupled with lower interest rates would make it harder to attract foreign investment to finance additional Treasury debt, a challenge that is already becoming evident.
Additionally, the Fed is aware that inflation is running higher than what is reported by the CPI. Reducing rates will further drive real interest rates deeper into negative territory. While the official CPI suggests real rates are positive, using more comprehensive measures like the Shadow Stats Alternative CPI, real rates are currently at -3% using the 1990 CPI method and -6% based on the 1980 version. Negative real interest rates fuel price inflation, contributing to its persistence. Cutting rates further would likely intensify this inflationary pressure.
This is one reason gold has been reaching new all time highs almost daily since the Fed cut rates earlier this month. Silver, similarly, is on the verge of breaking into the high $33 range.
Precious metals markets are anticipating more than just optimistic Fed rhetoric about a strong economy and lower inflation; they are also predicting a potential return to money printing policies