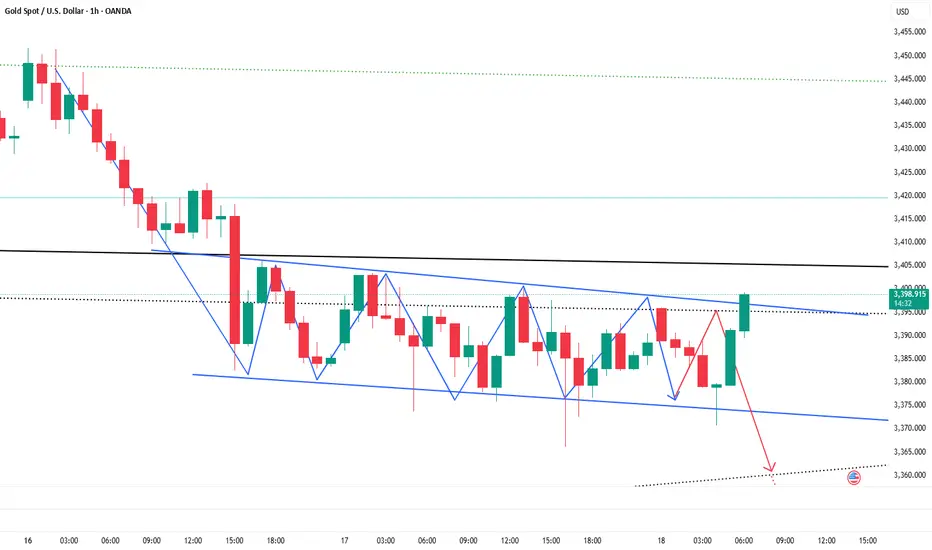
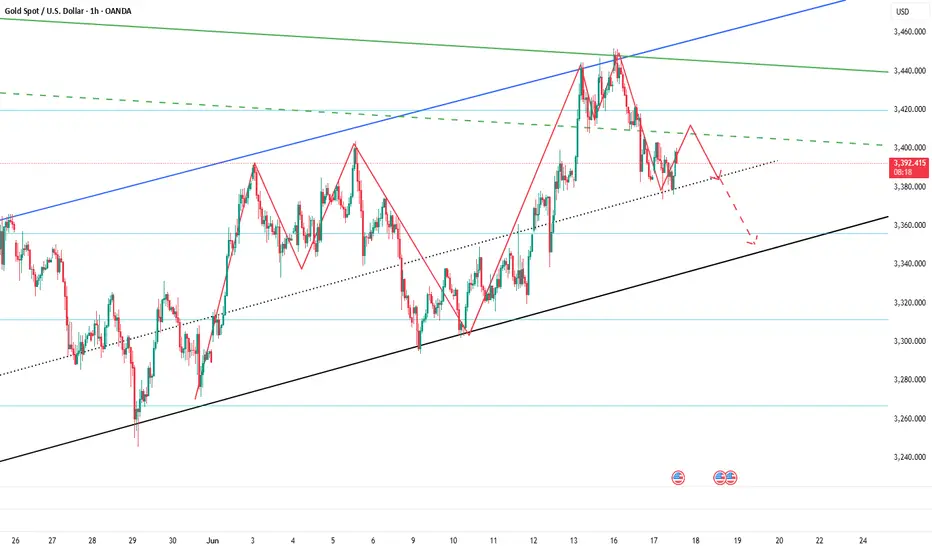
Gold breaks down, short-term bears dominate the rhythmThe Fed's June resolution kept interest rates unchanged, but Powell's remarks (expected to slow down the pace of future rate cuts) suppressed gold prices, causing gold prices to fall from around $3,396 to $3,362; the rebound of the US dollar index put short-term pressure on gold, but gold rebounded slightly when the US dollar pulled back; the conflict between Iran and Israel continued to ferment, and the safe-haven demand partially supported the gold price, limiting the decline. After several days of volatility, gold opened slightly higher today and then fell sharply to $3,347.56 per ounce, breaking the unilateral decline in the volatile trend. The 4-hour moving average is in a short position, the Bollinger band is narrowing, and the gold price is running near the lower Bollinger band. Therefore, today's operation is to rebound and short.
Operational suggestions: Arrange short positions in batches in the 3370-3385 range, follow the trend, and control risks. Target 3350-3340.
Goldtradingstrategy

Range oscillation, strategy remains unchanged!The Federal Reserve kept the interest rate unchanged. Gold did not break through the range we gave after all. The important support below is still at 3365-3360. Today, we continue to operate in the range and keep high and low as yesterday. Gold touched the lowest level of 3362 without breaking through, and still rebounded. The long orders of 3372 and 3363 that we arranged have successfully stopped profit at 3380, so we continue to operate in the range.
From the current analysis of gold trend, gold continues to focus on the important support of 3365-3360 below, and focuses on the short-term suppression of 3400-3415 above in the short term. The operation is mainly carried out in the range for the time being, and there is a high probability of continued volatility in the short term.
Gold operation strategy: Go long when gold falls back to 3375-3370, and cover long positions when it falls back to 3365-3360, with the target of 3380-3390-3400.
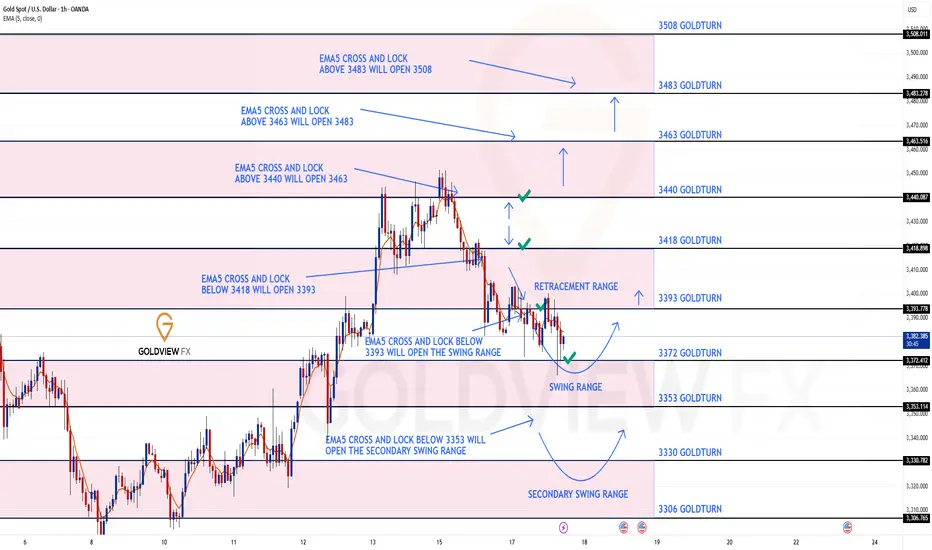
GOLD ROUTE MAP UPDATEHey Everyone,
A PIPTASTIC day on the markets with our chart idea playing out perfectly!!!
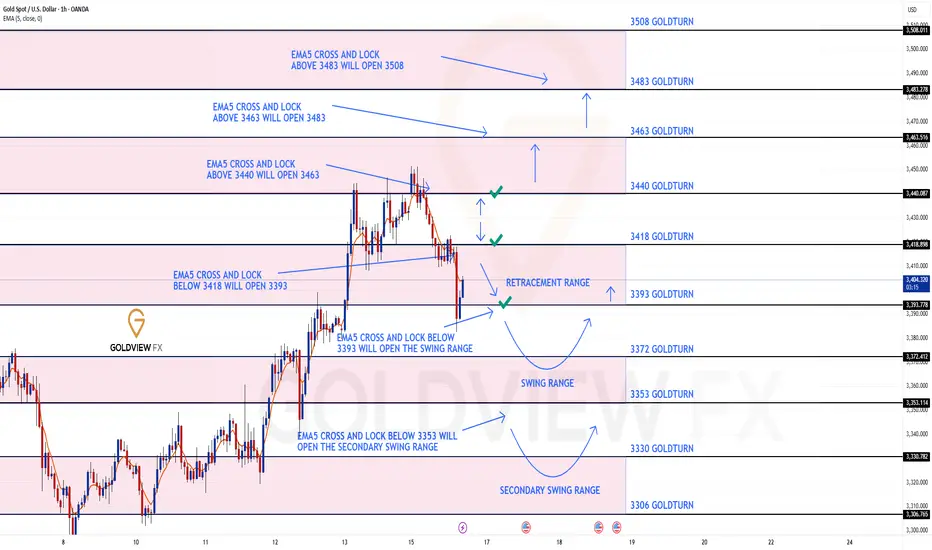
Yesterdays update, we stated how we hit our Bullish target, followed with no cross and lock confirming the rejection. We then stated, how we tracked the movement down with ema5 lock confirmation into the swing range and ended with waiting for the full swing to complete into 3393.
🔄 Update:
Today we got the move into 3393 just like we analysed. We continued to see play between 3372 and 3393, giving multiple opportunities to catch bounces from the dip. We will now look for ema5 to cross and lock 3372 or 3393 to confirm direction.
We will see levels tested side by side until one of the weighted levels break and lock to confirm direction for the next range
We will keep the above in mind when taking buys from dips. Our updated levels and weighted levels will allow us to track the movement down and then catch bounces up.
We will continue to buy dips using our support levels, taking 20 to 40 pips. As stated before, each of our level structures gives 20 to 40 pip bounces, which is enough for a nice entry and exit. If you back-test the levels we shared every week for the past 24 months, you can see how effectively they were used to trade with or against short/mid-term swings and trends.
🌀 The swing ranges give bigger bounces than our weighted levels - that's the difference between the two.
BULLISH TARGET
3440 - DONE
EMA5 CROSS AND LOCK ABOVE 3340 WILL OPEN THE FOLLOWING BULLISH TARGETS
3463
EMA5 CROSS AND LOCK ABOVE 3463 WILL OPEN THE FOLLOWING BULLISH TARGET
3483
EMA5 CROSS AND LOCK ABOVE 3483 WILL OPEN THE FOLLOWING BULLISH TARGET
3508
BEARISH TARGETS
3418 -DONE
EMA5 CROSS AND LOCK BELOW 3418 WILL OPEN THE FOLLOWING BEARISH TARGET
3393 - DONE
EMA5 CROSS AND LOCK BELOW 3393 WILL OPEN THE SWING RANGE
3372 - DONE
3353
EMA5 CROSS AND LOCK BELOW 3353 WILL OPEN THE SECONDARY SWING RANGE
3330
3306
As always, we will keep you all updated with regular updates throughout the week and how we manage the active ideas and setups. Thank you all for your likes, comments and follows, we really appreciate it!
Mr Gold
GoldViewFX
Stick to shorting goldGold is currently fluctuating in a narrow range of 3380-3385, and the trend is relatively slow. We also need more patience. In comparison, I think the current short-selling force has a slight upper hand, because gold has shown signs of accelerating decline after a difficult rebound many times, and has fallen below 3380 many times. According to the current gold structure, gold does not have sufficient room for decline, and it is still possible to continue to fall to the 3365-3355 area.
It is expected that gold will not fluctuate too much before the Fed's interest rate decision and Powell's monetary policy press conference. For this interest rate decision, I think the possibility of a rate cut is not great, and the current interest rate may still remain unchanged. The reduction in the expectation of a rate cut may stimulate a wave of gold declines in the short term. So in the short term, I still prefer a short trade in gold. Obviously, gold is currently under pressure in the 3395-3405 area, so we can still try to short gold in this area.
Accurate operation, both long and short gains!Gold has experienced a typical volatile market today, first rising to 3400 and then falling back to around 3380 as expected. The short order plan we arranged in advance was successfully closed, and we successfully took this wave of callback profits. What is more worth mentioning is that we also accurately entered the long order in the previous round of retracement and steadily harvested the rebound profits. The rhythm of long and short switching is smooth, the strategy is clear, and the execution is decisive - this is what trading should be like. The market is repetitive, and opportunities are always there. Whether you can put the profit steadily into your pocket depends not on how many times you are right, but on whether you can execute it at the key points.
At present, the trend of gold shows that although there is a rebound after each decline, the strength is generally weak and it has never been able to break through the 3405 suppression level. The overall situation is still in a range of fluctuations, and market sentiment is still waiting for further guidance from the Fed. Therefore, short-term operations are still based on key points, and the market rhythm is slow, requiring more patience. In the case of no break at present, continue today's thinking to operate, unless there are sharp fluctuations in the short term or sudden news or geopolitical situations, then make adjustments.
Gold operation suggestions: 1. Gold short orders: short near 3397-3405, target 3385-3375. 2. Gold long orders: long near 3375-3370, 3365-3360 can cover positions, target 3380-3390-3400.
If you still lack direction in gold trading, you might as well try to follow my pace. The strategy is open and transparent, and the execution logic is clear and definite, which may bring new breakthroughs to your trading. The real value does not rely on verbal promises, but is verified by the market and time.

Once again, we seized a golden opportunityYesterday, gold fluctuated throughout the day and failed to break through the key range we pointed out. The current structure continues to fluctuate. During the day, we will continue to pay attention to the strong support of 3365-3360 below. This area is the key defensive position we emphasized yesterday. As long as this area is not broken, the bulls still have a chance to make a comeback. The long orders we arranged today at 3370-3375 have all been taken profit near 3387, and the short-term is perfectly realized! At present, 3400 above is the primary pressure position. We have also given a short order plan. We continue to hold it at present, and the target is to take profit when it falls back to 3380-3375.
The overall idea is to maintain the main long and auxiliary short rhythm. In terms of operation, the interval thinking is prioritized, and wait for the key points to be confirmed before taking action. If it breaks through, change the idea in time.
Operation suggestion: Gold falls back to 3375-3370 and goes long with a light position, and further falls back to 3365-3360 to cover the position. The target is 3380-3390-3400.
If you still lack direction in gold trading, you might as well try to follow my pace. The strategy is open and transparent, and the execution logic is clear and definite, which may bring new breakthroughs to your trading. The real value does not rely on verbal promises, but is verified by the market and time.

Seize the opportunity to short gold after the reboundBecause gold fell back to the expected support area of 3375-3365 first, I just took the opportunity to go long on gold near 3372 and set TP: 3390. Obviously, our long position ended the transaction by hitting TP, and we made a profit of 180pips.
At present, gold continues to rebound to around 3396, and is facing the short-term resistance area of 3395-3405, and the upside may be limited. And I think before the Fed's interest rate decision and Powell's monetary policy conference, gold is likely to maintain a range of fluctuations, and the willingness of both long and short parties to break through may not be strong in the short term. And from the current structure, gold tends to fluctuate downward as a whole.
So for short-term trading, we might as well try to short gold in the resistance area. I think it is still very likely to retreat to at least the 3385-3380 area.
Golden opportunity comes again!Gold fluctuated all day yesterday, and finally did not break the range we gave. Today we continue to focus on the strong support range of 3365-3360, because this position is also the important key support we gave yesterday. Today we continue to look for opportunities to go long when we step back. As long as the strong support position below is not broken, there will be hope for the bulls to make a comeback.
From the current analysis of gold trends, gold continues to focus on the short-term support near 3375-3370 below, and the important support is around 3365-3360. The short-term focus is on the short-term suppression near 3400-3415 above. The operation is temporarily based on the range. There is a high probability that the short-term fluctuations will continue. Wait patiently for the key points to enter the market.
Gold operation strategy: Go long when gold steps back to 3375-3370, and cover long positions when it steps back to 3365-3360. The target is around 3380-3390-3400.
If you still lack direction in gold trading, you might as well try to follow my pace. The strategy is open and transparent, and the execution logic is clear and definite, which may bring new breakthroughs to your trading. The real value does not rely on verbal promises, but is verified by the market and time.
Have you caught up with this golden opportunity?The 4-hour K-line pattern of gold shows that the upward trend remains intact, focusing on the strong support range of 3360-3365 (technical resonance with the 5-week moving average). Before the price effectively breaks below the support band, the bulls still have upward momentum, otherwise the trend may reverse. The 3365-3400 range is maintained for intraday fluctuations. The gold operation strategy recommends arranging long orders in the 3370-3375 area when the price falls back, and adding positions to long positions if the support of 3360-3365 is broken.
Operation strategy: Gold recommends going long near 3370-3375 now, and adding positions to long positions in the support area of 3360-3365 when the price breaks, with the target of 3380-3390.
If you still lack direction in gold trading, you might as well try to follow my pace. The strategy is open and transparent, and the execution logic is clear and definite, which may bring new breakthroughs to your trading. The real value does not rely on verbal promises, but is verified by the market and time.
GOLD ROUTE MAP UPDATEHey Everyone,
Another great day on the markets with our chart idea playing out, as analysed!
Yesterday we started with our Bullish target at 3440 hit, followed with no EMA5 cross and lock, confirming the perfect rejection and showcasing the accuracy of our levels. This rejection went on to hit our Bearish target, followed by EMA5 cross and lock opening 3393, which was also hit perfectly.
🔄 Update:
After testing 3393, we got the EMA5 cross and lock, opening the swing range. The first level was tested perfectly and gave the bigger bounce. Let’s see if it completes the full swing back to 3393, or if it goes for the full swing test below.
We will keep the above in mind when taking buys from dips. Our updated levels and weighted levels will allow us to track the movement down and then catch bounces up.
We will continue to buy dips using our support levels, taking 20 to 40 pips. As stated before, each of our level structures gives 20 to 40 pip bounces, which is enough for a nice entry and exit. If you back-test the levels we shared every week for the past 24 months, you can see how effectively they were used to trade with or against short/mid-term swings and trends.
🌀 The swing ranges give bigger bounces than our weighted levels - that's the difference between the two.
BULLISH TARGET
3440 - DONE
EMA5 CROSS AND LOCK ABOVE 3340 WILL OPEN THE FOLLOWING BULLISH TARGETS
3463
EMA5 CROSS AND LOCK ABOVE 3463 WILL OPEN THE FOLLOWING BULLISH TARGET
3483
EMA5 CROSS AND LOCK ABOVE 3483 WILL OPEN THE FOLLOWING BULLISH TARGET
3508
BEARISH TARGETS
3418 -DONE
EMA5 CROSS AND LOCK BELOW 3418 WILL OPEN THE FOLLOWING BEARISH TARGET
3393 DONE
EMA5 CROSS AND LOCK BELOW 3393 WILL OPEN THE SWING RANGE
3372 - DONE
3353
EMA5 CROSS AND LOCK BELOW 3353 WILL OPEN THE SECONDARY SWING RANGE
3330
3306
As always, we will keep you all updated with regular updates throughout the week and how we manage the active ideas and setups. Thank you all for your likes, comments and follows, we really appreciate it!
Mr Gold
GoldViewFX
Continue to try to short gold,It's expected to touch 3355-3345 Gold has broken through 3380 twice, but recovered quickly, indicating that the bulls still have some defensive power. At present, gold has touched 3400 again; it can be seen that the bulls' potential defense is still good, but it is not enough to support the continued rebound of gold in the short term. Obviously, gold is still under pressure in the 3410-3420 area in the short term. If gold cannot break through this resistance area in the short term, gold may continue to maintain a volatile state and continue to seek strong support downward. Only after gold breaks through the 3410-3420 area, it is expected to continue to rise and touch the area near 3450 again.
When gold tested the support near 3380 several times during the day and tried to break through this area, after gold failed to break through the 3410-3420 area in the short term, I think gold will be more likely to choose a downward direction, or even continue to test the 3355-3345 area. Therefore, for short-term trading, before breaking through the 3410-3420 area, we should not chase gold too much, and we can try to short gold in this area appropriately.
Short gold, it needs to retreat to the area around 3350!Gold is currently testing the support near 3380 again. According to the current trend of gold, gold is likely to break through 3380, and gold has stopped near 3400 many times during the rebound process, and the rebound strength of gold is lacking. If gold really wants to rebound, then after testing near 3380 many times and getting support at 3390, it should have rebounded to the 3410-3420 area, but it is obvious that gold has not yet touched the 3410-3420 area. Therefore, gold's performance is relatively weak and its correction trend should continue for now.
In terms of fundamentals, Iran is not decisive in its retaliatory behavior, so if the conflict in the Middle East does not escalate, gold may find it difficult to continue to rise. So according to the current trend and performance of gold, we should not be stubborn in long gold trading for the time being, and adjust our trading plan reasonably according to the market and price behavior. If gold continues to retreat, the first thing we need to pay attention to below is the 3355-3345 area, followed by the area near 3330. So for the next short-term trading, we can try to short gold in the 3395-3405 area.
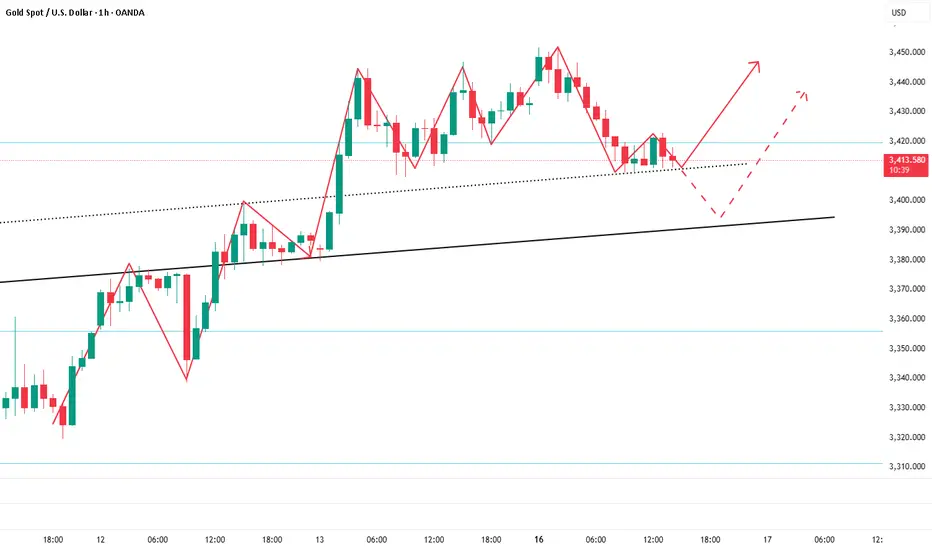
Continue to be bullish after successful adjustment of low longToday, gold opened high at 3448, and fell under pressure after touching 3452. It fell after repeatedly confirming resistance at high levels. We arranged short orders in the 3445-3450 area, successfully touched the target of 3330, and realized profit-taking. Then the market fell back to around 3409 and stabilized and rebounded. We arranged long orders and stopped profit at around 3420. Then we fell back and arranged long orders of 3385 and 3395 to take profits at 3405.
Overall, gold fell slowly after opening high, and maintained sideways consolidation in the European session. The US session continued to fall due to the easing of the geopolitical situation. At present, the focus of the evening is on the support of 3390. If it does not break after the retracement, it can still go long. Pay attention to the key pressure levels of 3410 and 3422 above. The current market is still in the adjustment stage of the upward trend. After the adjustment, it is expected to continue the upward rhythm.
Operation suggestion: Go long on gold when it falls back to around 3390-3392, with the target at 3410 and 3435.
If you still lack direction in gold trading, you might as well try to follow my pace. The strategy is open and transparent, and the execution logic is clear and definite, which may bring new breakthroughs to your trading. The real value does not rely on verbal promises, but is verified by the market and time.
Adjustments do not change the trend, continue to be bullishToday, gold opened high at 3448, and fell under pressure after reaching 3452. After repeatedly confirming resistance at high levels, it went down. We arranged short orders in the 3445-3450 area, successfully reached the target of 3330, and secured profits. Then the market fell back to around 3409 and stabilized and rebounded. We arranged long orders to stop profit near 3420. The current market is still in a bullish trend after the shock and retracement. Adjustment does not change the trend. Retracement is an opportunity. The key is to find the right entry point.
From a technical perspective, the support below focuses on the 3410-3405 area, and the key support is at 3400-3390. If the daily level stabilizes in the above area, the upward structure will continue, and the short-term is still expected to test the previous high. Short orders need to strictly control risks, and the trend of low and long is still the main theme.
Gold operation strategy: Buy gold when it falls back to around 3410-3405, and consider covering positions when it falls back to 3400-3395, with the target at 3430-3440.
For more real-time strategies, I will remind you at the key points as soon as possible,🌐 remember to pay attention!
If you still lack direction in gold trading, you might as well try to follow my pace. The strategy is open and transparent, and the execution logic is clear and definite, which may bring new breakthroughs to your trading. The real value does not rely on verbal promises, but is verified by the market and time.
GOLD ROUTE MAP UPDATEHey Everyone,
Great start to the week with our chart idea playing out to perfection once again!!
We started with our Bullish target at 3440 hit followed with no ema5 cross and lock confirming the perfect rejection, showcasing the accuracy of our levels. This rejection went onto hitting our Bearish target, followed with ema5 cross and lock opening 3393, which was also hit perfectly.
We will now look for ema5 lock below 3393 to open the swing range or failure to lock below will see the upper Goldturns tested again.
We will see levels tested side by side until one of the weighted levels break and lock to confirm direction for the next range.
We will keep the above in mind when taking buys from dips. Our updated levels and weighted levels will allow us to track the movement down and then catch bounces up.
We will continue to buy dips using our support levels taking 20 to 40 pips. As stated before each of our level structures give 20 to 40 pip bounces, which is enough for a nice entry and exit. If you back test the levels we shared every week for the past 24 months, you can see how effectively they were used to trade with or against short/mid term swings and trends.
The swing range give bigger bounces then our weighted levels that's the difference between weighted levels and swing ranges.
BULLISH TARGET
3440 - DONE
EMA5 CROSS AND LOCK ABOVE 3340 WILL OPEN THE FOLLOWING BULLISH TARGETS
3463
EMA5 CROSS AND LOCK ABOVE 3463 WILL OPEN THE FOLLOWING BULLISH TARGET
3483
EMA5 CROSS AND LOCK ABOVE 3483 WILL OPEN THE FOLLOWING BULLISH TARGET
3508
BEARISH TARGETS
3418 -DONE
EMA5 CROSS AND LOCK BELOW 3418 WILL OPEN THE FOLLOWING BEARISH TARGET
3393 DONE
EMA5 CROSS AND LOCK BELOW 3393 WILL OPEN THE SWING RANGE
3372
3353
EMA5 CROSS AND LOCK BELOW 3353 WILL OPEN THE SECONDARY SWING RANGE
3330
3306
As always, we will keep you all updated with regular updates throughout the week and how we manage the active ideas and setups. Thank you all for your likes, comments and follows, we really appreciate it!
Mr Gold
GoldViewFX
Gold bulls may restart at any time, buy gold!Although compared with the performance of gold during the day, gold only touched 3452 and then began to retreat, and even failed to approach the previous high of 3500, gold is not strong; but based on the current fundamentals and technical structure, gold is currently in a very strong bullish structure; so I think the gold retracement is not a sign of gold weakness, but to increase liquidity, so that gold can rise better and prepare in advance for breaking through 3500! Gold bulls are ready to restart at any time after the retracement!
So for short-term trading, I don’t think the gold retracement is a reason for weakness, nor is it a certificate for chasing short gold; on the contrary, I think the gold retracement is a good time to buy on dips; first of all, the support area we have to pay attention to is the 3410-3400 area, and the second must pay attention to the 3390-3380 area support.
So in the next transaction, we might as well use these two support areas as defense and start to go long on gold in batches!
Short positions fall as expected, long opportunities reappearToday, gold maintained high and fluctuated repeatedly after opening, but the upper side has not been effectively broken through. After repeated pressure, the resistance signal was confirmed. We arranged short orders near 3445. The market fell back as expected and accurately hit the target position. The trend was highly consistent with the prediction, which once again confirmed the trading concept of "planning before the market, execution before emotion".
From the current trend structure, gold is still in a bullish trend as a whole, and short-term adjustments are normal. The support below focuses on the 3420-3415 area, which is the first defense position for short-term retracement; and the more critical bullish defense line is still at the 3405-3400 line. If this area stabilizes, it is still our core layout area for low-multiples with the trend.
The daily structure is still intact, and the long arrangement of the moving average system has not been destroyed. Short-term fluctuations do not affect the overall bullish logic. Therefore, the operation is still based on retracement and main longs, and following the trend is the kingly way. Short orders can only be participated in the short term, and stop when you reach the point, and do not hold against the trend. I will remind you of the specific operation strategy at the bottom, and pay attention to it in time. The key next is to pay attention to the stabilization signals below and wait for the market to provide new opportunities for momentum release.
If you still lack direction in gold trading, you might as well try to follow my pace. The strategy is open and transparent, and the execution logic is clear and definite, which may bring new breakthroughs to your trading. The real value does not rely on verbal promises, but is verified by the market and time. 🌐
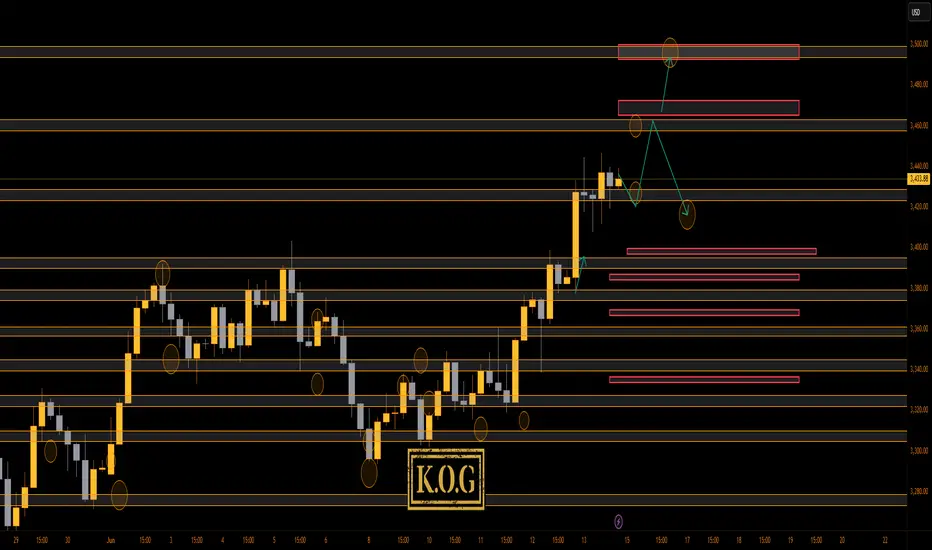
THE KOG REPORTTHE KOG REPORT
In last week’s KOG Report we said we would want the lower level red box to be tested and rejected in order to give us the move upside into that 3330-35 region where we wanted to monitor the price for the short. We managed to get a pin point move, however, we had to exit the short trades early due to the support level holding us up. We then continued to follow Excalibur and the red box indi’s which were suggesting higher pricing and by the end of the week we had completed all our bullish above target levels, plus Excalibur trade targets and LiTE again performed at 100% accuracy.
A phenomenal week in Camelot, not only on Gold but the numerous other pairs we trade, analysis and post on.
So, what can we expect from the week ahead?
For this week we can expect some gaps on open which is going to make it difficult due to skewed data. We will however stick with the red box levels and the tools we have to make a plan for the two scenarios we may see potential of.
Scenario one:
Price opens and gaps upside, we’ll be looking for the levels of 3455-60 for a potential reaction in price, if achieved, an opportunity may be available to short there back down into the 3450, 3443 and 3435 levels.
Scenario two:
If we do open and gap downside, we’ll look for the levels of 3430-23 to hold us up, and if achieved, an opportunity to long there back up into the 3450-5 level and in extension of the move 3465 may be available.
It’s a difficult one again as no one knows how the market is going to open and what is going to happen. So we’ll update traders as much as we can during the day and the week with KOG’s bias of the day and red box target levels
KOG’s bias of the week:
Bearish below 3465 with targets below 3425, 3420, 3410 and 3406
Bullish on break of 3465 with targets above 3477, 3485, 3492, 3495 and 3503
Red Boxes:
Break above 3435 for 3443, 3448, 3465 and 3476 in extension of the move
Break below 3420 for 3410, 3406, 3397, 3385 and 3380 in extension of the move
Many of our followers and traders have seen the power of the red boxes, Imagine this on your own TV screen, 4H for swing trading, 1H for day trading and 15min for scalping. Any pair on any chart 23hrs a day. Add to that the Knights indicator giving you swing points, key levels and retracement levels and our custom volume indicator telling you when to long, when to short and when to stand back from your trades.
LEARN AND GENERATE YOUR OWN SIGNALS. You don't need any of us to guide you.
Please do support us by hitting the like button, leaving a comment, and giving us a follow. We’ve been doing this for a long time now providing traders with in-depth free analysis on Gold, so your likes and comments are very much appreciated.
As always, trade safe.
KOG
The golden opportunity comes again.This week, gold showed a slow bullish upward pattern, rising repeatedly and circuitously, and finally closed positive on the weekly line. On Friday, it was blocked twice at the high level of 3445, and the closing price remained sideways. The market is expected to continue the upward trend next week. If it breaks through 3445, it is expected to further challenge the 3500 mark or even set a new high. Combined with the recent fundamentals and the continued warming of the geopolitical situation, it provides solid support for bulls. However, the current market shock sweep is still the main rhythm, and it is not advisable to blindly chase highs in operation. It is still recommended to focus on retracement and long positions. The key support of the daily line refers to the top and bottom conversion position of 3403 and the low point of 3419 on Friday. If it falls back to the above area, you can rely on the support to arrange long positions at the right time. The overall trend is still inclined to bulls, and short positions can only be tried with a light position. Remember that strict risk control is required against the trend. I will remind you of the specific operation strategy at the bottom, and pay attention to it in time.
Operation suggestion: Gold is recommended to go long near 3405-3400, with the target looking at 3445 and 3465. If it is strong, rely on the support of 3420-3415 area and choose the opportunity to go long.
If you still lack direction in gold trading, you might as well try to follow my pace. The strategy is open and transparent, and the execution logic is clear and definite, which may bring new breakthroughs to your trading. The real value does not rely on verbal promises, but is verified by the market and time. 🌐
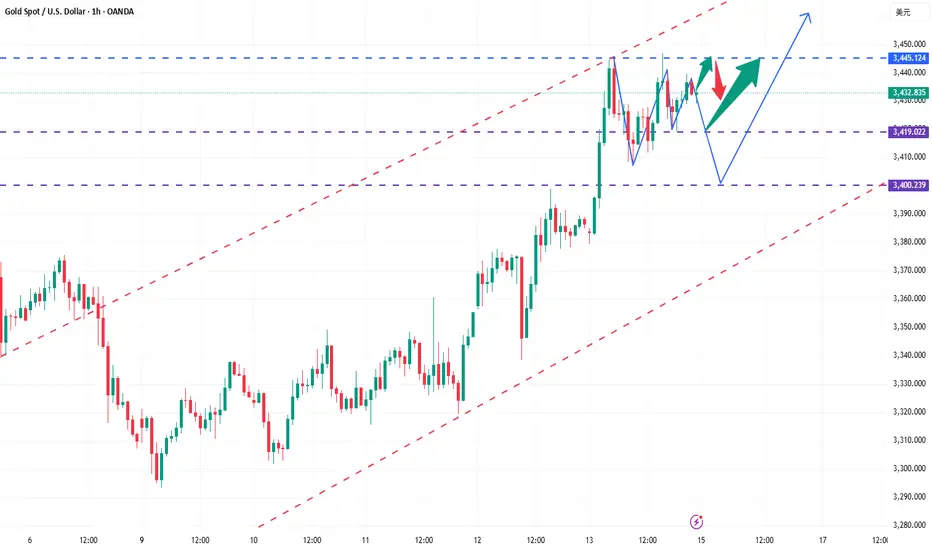
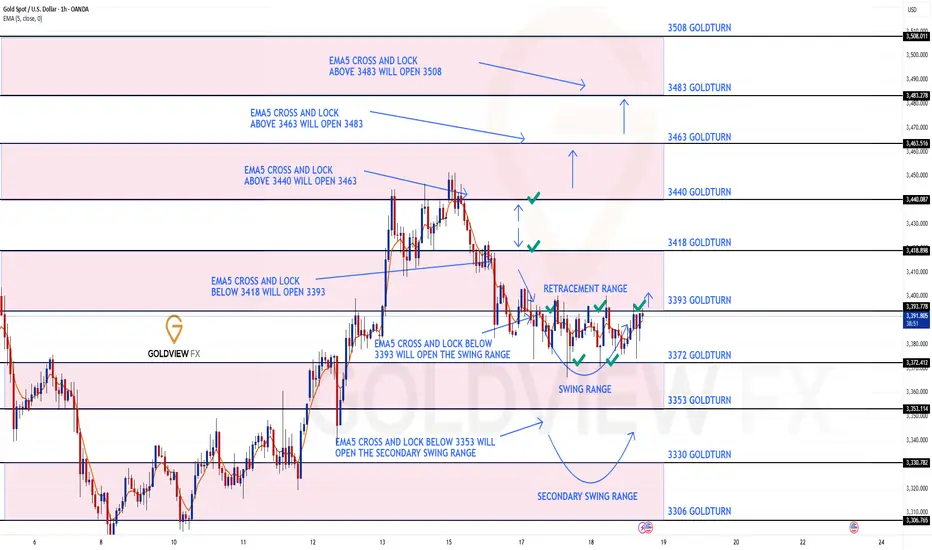
GOLD 1H CHART ROUTE MAP UPDATE & TRADING PLAN FOR THE WEEKHey Everyone,
Please see our updated 1h chart levels and targets for the coming week.
We are seeing price play between two weighted levels with a gap above at 3340 and a gap below at 3418. We will need to see ema5 cross and lock on either weighted level to determine the next range.
We will see levels tested side by side until one of the weighted levels break and lock to confirm direction for the next range.
We will keep the above in mind when taking buys from dips. Our updated levels and weighted levels will allow us to track the movement down and then catch bounces up.
We will continue to buy dips using our support levels taking 20 to 40 pips. As stated before each of our level structures give 20 to 40 pip bounces, which is enough for a nice entry and exit. If you back test the levels we shared every week for the past 24 months, you can see how effectively they were used to trade with or against short/mid term swings and trends.
The swing range give bigger bounces then our weighted levels that's the difference between weighted levels and swing ranges.
BULLISH TARGET
3340
EMA5 CROSS AND LOCK ABOVE 3340 WILL OPEN THE FOLLOWING BULLISH TARGETS
3463
EMA5 CROSS AND LOCK ABOVE 3463 WILL OPEN THE FOLLOWING BULLISH TARGET
3483
EMA5 CROSS AND LOCK ABOVE 3483 WILL OPEN THE FOLLOWING BULLISH TARGET
3508
BEARISH TARGETS
3418
EMA5 CROSS AND LOCK BELOW 3418 WILL OPEN THE FOLLOWING BEARISH TARGET
3393
EMA5 CROSS AND LOCK BELOW 3393 WILL OPEN THE SWING RANGE
3372
3353
EMA5 CROSS AND LOCK BELOW 3393 WILL OPEN THE SECONDARY SWING RANGE
3330
3306
As always, we will keep you all updated with regular updates throughout the week and how we manage the active ideas and setups. Thank you all for your likes, comments and follows, we really appreciate it!
Mr Gold
GoldViewFX
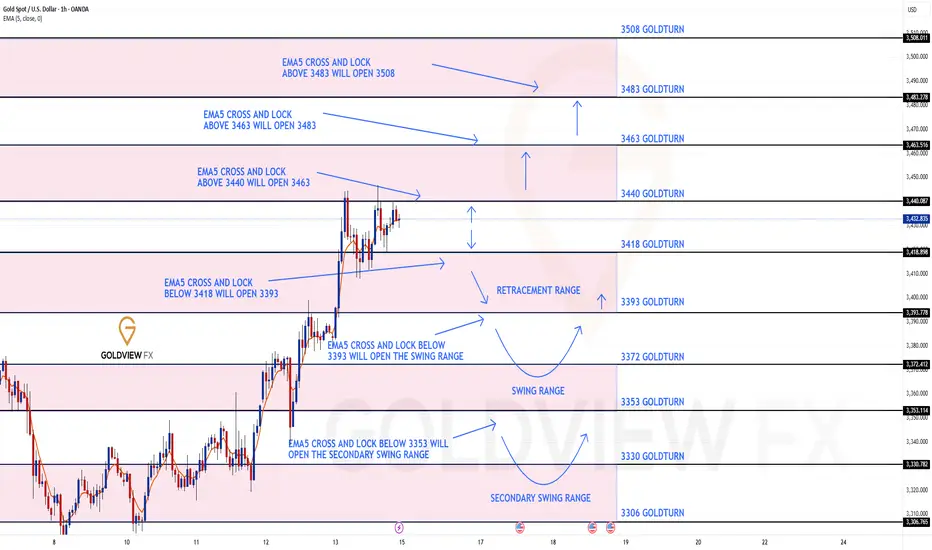
GOLD 4H CHART ROUTE MAP UPDATE & TRADING PLAN FOR THE WEEKHey Everyone,
This is an update from last weeks 4H chart route map, as levels are still valid and playing out as analysed. I have only updated the swing ranges accordingly.
3376 and 3438 was hit perfectly last week with ema5 cross and lock confirmation. We are now looking for ema5 cross and lock above 3438 for a continuation into 3498. Failure to lock above will follow with a rejection into the lower Goldturns for support and bounce inline with our plans to buy dips.
We will see levels tested side by side until one of the weighted levels break and lock to confirm direction for the next range.
We will keep the above in mind when taking buys from dips. Our updated levels and weighted levels will allow us to track the movement down and then catch bounces up.
We will continue to buy dips using our support levels taking 20 to 40 pips. As stated before each of our level structures give 20 to 40 pip bounces, which is enough for a nice entry and exit. If you back test the levels we shared every week for the past 24 months, you can see how effectively they were used to trade with or against short/mid term swings and trends.
The swing range give bigger bounces then our weighted levels that's the difference between weighted levels and swing ranges.
BULLISH TARGET
3376 - DONE
EMA5 CROSS AND LOCK ABOVE 3376 WILL OPEN THE FOLLOWING BULLISH TARGETS
3438 - DONE
EMA5 CROSS AND LOCK ABOVE 3438 WILL OPEN THE FOLLOWING BULLISH TARGET
3498
EMA5 CROSS AND LOCK ABOVE 3498 WILL OPEN THE FOLLOWING BULLISH TARGET
3551
BEARISH TARGETS
3302
EMA5 CROSS AND LOCK BELOW 3302 WILL OPEN THE FOLLOWING BEARISH TARGET
3235
EMA5 CROSS AND LOCK BELOW 3235 WILL OPEN THE SWING RANGE
3171
3113
EMA5 CROSS AND LOCK BELOW 3113 WILL OPEN THE SECONDARY SWING RANGE
3045
2987
As always, we will keep you all updated with regular updates throughout the week and how we manage the active ideas and setups. Thank you all for your likes, comments and follows, we really appreciate it!
Mr Gold
GoldViewFX
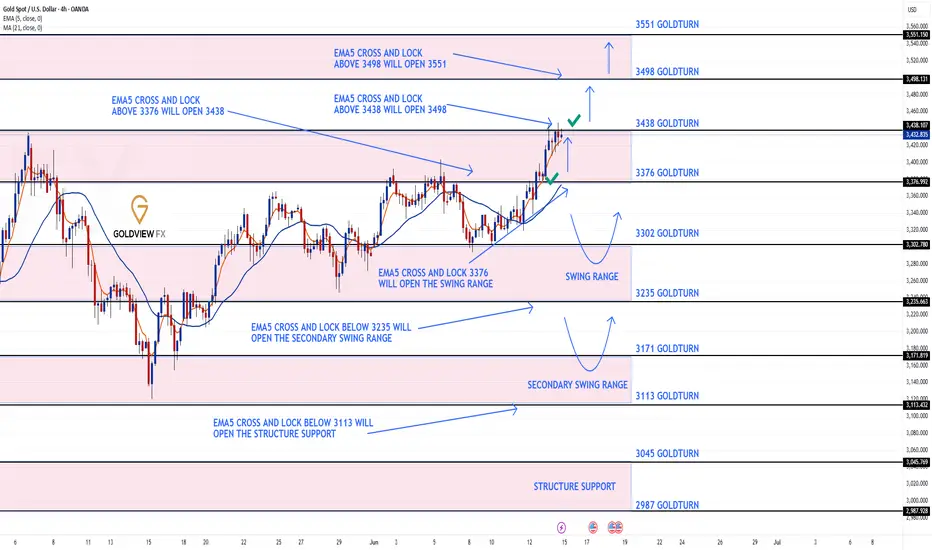
GOLD DAILY CHART ROUTE MAPHey Everyone,
Following up on our previous analysis, price action has continued to respect our Goldturn channel beautifully. After the strong move to 3272, we saw another push toward the channel top near 3433. This time, the ascending movement to the channel top was completed perfectly, hitting inline with our 3433 axis target.
The key takeaway here is that the channel levels are being respected with precision, validating the strength and reliability of our Goldturn channel framework. 3272 continues to provide solid support, and price remains well-contained within our defined range, reaffirming our strategy of buying dips near the lower end rather than chasing strength at the top.
We will now look for a break above the channel and then support to form above the channel top to confirm a continuation higher. However, failure to lock above the channel will likely result in a rejection back into the range, reinforcing the significance of these key levels.
We remain focused on trading within this structure, using our weighted Goldturns to guide entries on the lower timeframes (1H and 4H). As long as the range remains intact, we’ll continue to target quick 30–40 pip intraday moves while keeping an eye out for a breakout setup.
This is the beauty of our Goldturn channels, drawn using weighted averages rather than pure price action. This method helps us filter out noise and stay on the right side of the market, avoiding common traps.
Keep a close eye on how price behaves around 3272 and 3433. A clean break and sustained hold above the channel top could shift the game, but until that happens, we stick to the range plan.
Let’s stay patient and disciplined.
Mr Gold
GoldViewFX
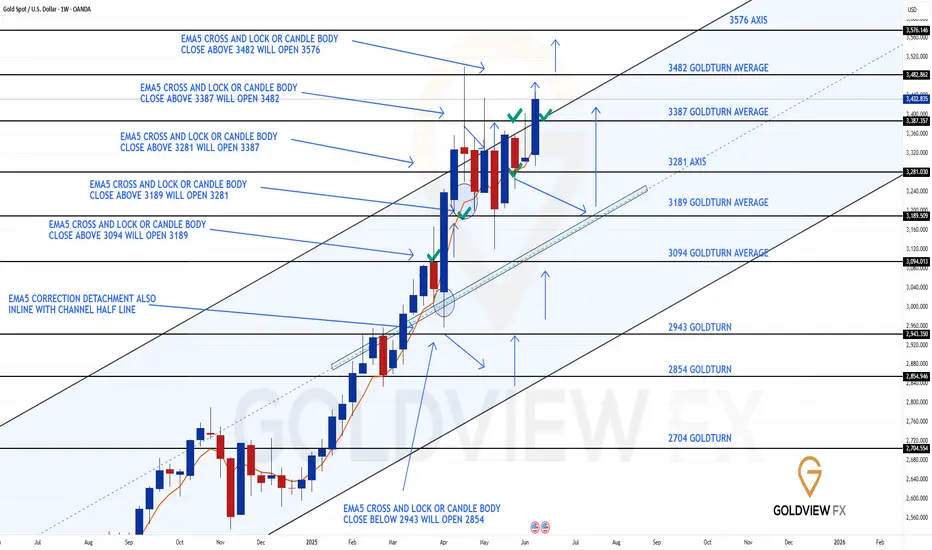
GOLD WEEKLY CHART MID/LONG TERM ROUTE MAPHey Everyone,
Following up on last week’s chart update, we saw another perfect test of the channel top, right in line with our Goldturn Channel expectations. The new weekly candle completed the channel top challenge with precision.
Our weekly chart idea is now playing out perfectly. We continued to get strong support above 3281, followed by another hit onto the 3387 channel top. But this time, we got something new: a body close above 3387, which confirms the gap to 3482 as active. We’ll now look for that 3482 target to be hit, ascending inline with the channel top.
Any rejection around these upper levels will likely see price retrace to find support at lower Goldturn levels. These are opportunities we’ll be watching closely to buy back in.
Price action remains well-contained between 3281 and 3387, but with that recent close above 3387, we’re now shifting focus toward higher expansion. The structure is rising, and the channel is guiding price beautifully, offering more room for smart, calculated positioning.
As long as we hold above the half-line and especially above 3281, we stay in buy-the-dip mode, favouring long setups from intraday Goldturn zones for quick 20–40 pip scalps or more extended swing entries when structure permits.
Should we see a failure to maintain above 3387 or a close back below 3281, we’ll reassess potential movement toward the lower channel boundary. Until then, the structure remains bullish within the channel and price is following our path perfectly.
The Goldturn methodology continues to prove its worth, cutting through noise, filtering out the fake outs, and keeping us on the right side of the market.
Stay sharp, stay patient.
MR GOLD
GOLDVIEWFX