GOLD 11/07 – STRUCTURE REMAINS BULLISH, WATCH 3318 & 3340 REAC📰 Fundamental News
The world’s largest gold ETF, SPDR Gold Trust, increased its holdings by 1.44 tons, reaching 948.81 tons, a sign of rising institutional interest.
Market expectations of a rate cut in September are growing, but the pricing in futures markets is still incomplete.
Global risk sentiment remains cautious, making gold a preferred safe haven amid economic uncertainty.
📉 Technical Analysis
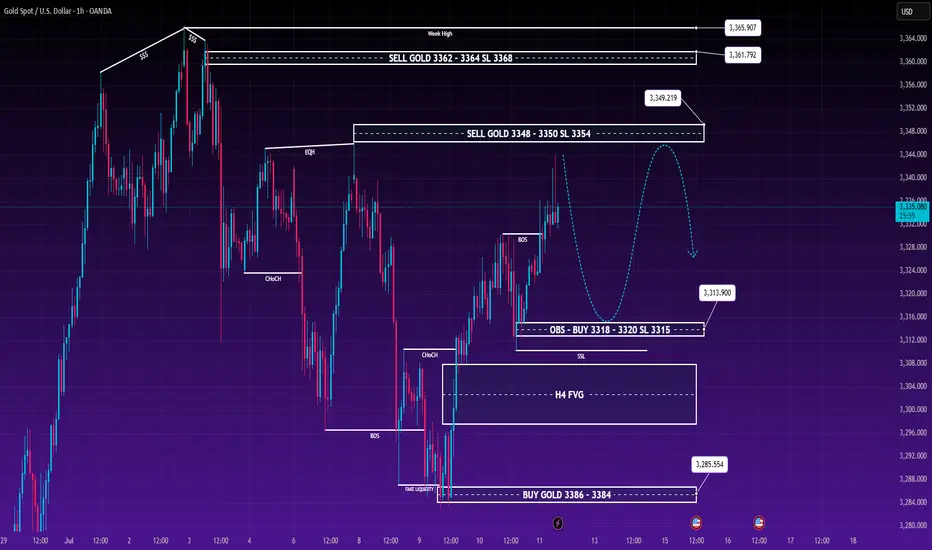
Gold has broken through the descending trendline, confirming bullish momentum and rejecting deep pullbacks during the Asian session.
A sharp fake-out move (liquidity grab) occurred around the 3284–3286 zone, after which the market rallied and formed a BOS (Break of Structure) and CHoCH confirmation on lower timeframes.
The current price action respects the Wyckoff accumulation model, and Wave (5) might be in its final stages as seen on M15–H1.
Liquidity zones are forming around key psychological levels: 3318–3319 and 3334–3340, where short-term corrective moves may happen before further bullish continuation.
🔍 Key Levels to Watch
Zone Type Price Range Notes
🟢 Buy Zone 3315 – 3318 Optimal Buy Limit (OBS + SSL Zone)
🛑 Stop Loss Below 3315.5 For aggressive buyers
🔵 Resistance 3334 – 3340 Potential reaction / pullback zone
🔴 Sell Zone 3348 – 3350 Scalp Sell area with SL at 3354
🟠 Major Sell 3362 – 3364 Institutional level – Week High zone
📊 Trading Scenarios
BUY SCENARIO – High Probability
Buy Limit: 3315 – 3318
SL: 3310 – 3315 (based on risk tolerance)
TP1: 3320
TP2: 3334
TP3: 3348 – 3350 (partial exit or scale-out)
SELL SCALP SCENARIO – Short-Term
Sell Zone: 3348 – 3350
SL: 3354
TP: 3344 - 3334 zone (quick pullback)
SELL HOLD SETUP
Sell Zone: 3362 – 3364 (Week High)
SL: 3368
TP: 3340 and trail further if momentum shifts
🧠 Note for Traders
Gold remains in a bullish structure, and as long as price holds above 3315, the bias remains to the upside. Watch for liquidity reactions at 3334 and 3340 for potential pullbacks. Avoid chasing price and wait for cleaner entries near liquidity zones.
Goldtrends
[XAU/USD] GOLD TODAY – PREFER BUY SCENARIO – WAVE 5 COMPLETION🔎 TECHNICAL ANALYSIS
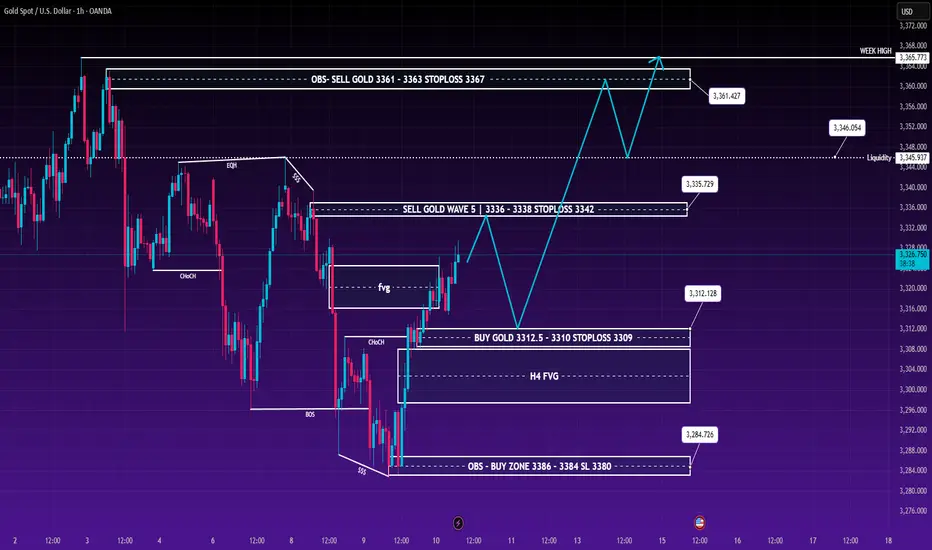
Currently, Gold is moving in Wave 5 of the primary impulse structure. Key price zones have been clearly identified:
🟢 Main Trading Plan: Prefer BUY
✅ BUY LIMIT around: 3312.5
🛡 Stoploss: 3309
🎯 Expected Target:
Short-term: 3336–3342
Medium-term: 3361 (OBS Supply)
Longer-term: Potentially test WEEK HIGH ~3365–3367
Note: 3312.5 is a strong confluence zone consisting of:
H4 FVG
Liquidity Pool
Option data shows concentration of funds at this zone
Wyckoff structure clearly indicates ST (secondary test) at this zone
🛑 SELL Setup – If you're scalping or trading corrective waves:
SELL GOLD WAVE 5 Zone: 3336–3338
SL: 3342
Expect a pullback to 3312.5 before continuing upwards
Scenario: This is a small corrective wave 4 within the larger Wave 5.
📊 CHART 2 – WYCKOFF PHASE C–D SUPPORT
The supplementary chart shows a clear WYCKOFF accumulation model:
Phase C is complete → Currently in Phase D (Markup Phase)
The upward wave from ~3285 has completed 5 small Elliott steps, preparing for a pullback to the support zone (3312.5) before breaking higher.
🌐 MACROECONOMIC NEWS AFFECTING GOLD
🏦 The Fed is expected to keep interest rates high in July with a 93.3% probability → Weaker USD, supporting higher Gold prices
📉 US bond yields are declining, increasing demand for safe-haven assets
🪙 Tether is quietly accumulating 80 tonnes of gold in Switzerland – A signal of the trend toward physical asset accumulation for safety
🧾 FOMC meeting minutes: Most members believe tariffs could have a long-term impact on inflation → Expect Gold to remain positively supported
✅ CONCLUSION
For today and the next few sessions, the BUY GOLD scenario at 3312.5 remains the main strategy, with expectations of movement towards higher levels. Be cautious when the price reaches the 3336–3338 zone, as a small pullback could occur.
"Price doesn't just reflect technicals; it also reflects sentiment – and today sentiment favours the buyers."
📌 SUMMARY TRADING PLAN:
BUY Limit: 3312.5
STOPLOSS: 3309
TP: 3336 - 3361 – 3367
Wave 5 Channel + Liquidity
SELL Scalp: 3336–3338
Stoploss: 3342 - 3312.5
Corrective wave, light scalp
📌 If you're trading Gold this week, remember to set clear SL levels and prefer to wait for a pullback – avoid FOMO at high prices.
Gold Market Outlook: Testing Key Liquidity Zones🔹 Gold Faces Liquidity Pressure at 3300 - Can It Hold or Will a Deeper Pullback Occur?
Gold has been under pressure after rejecting key resistance levels, with the market now entering a crucial phase where liquidity zones are key to determining the next move. As global trade developments unfold and the latest economic data trickles in, traders are eyeing whether the gold market will continue its bullish momentum or face a deeper pullback.
🔹 Market Context – US Dollar Gains Strength Amid Positive Trade Sentiment
The US dollar is showing a notable rebound, driven by positive trade negotiations and agreements between the US and other major nations. As a result, the greenback is receiving short-term support, which is creating downward pressure on gold as traders rotate into a more risk-on environment. Additionally, lower-than-expected inflation data out of the US suggests the Fed may hold off on rate hikes, further boosting the dollar.
🔹 Geopolitical Factors Easing
Geopolitical tensions have somewhat eased, reducing the need for safe-haven assets like gold. This has contributed to a calm in the market, but it’s crucial to watch for any new developments that might trigger renewed interest in gold as a hedge.
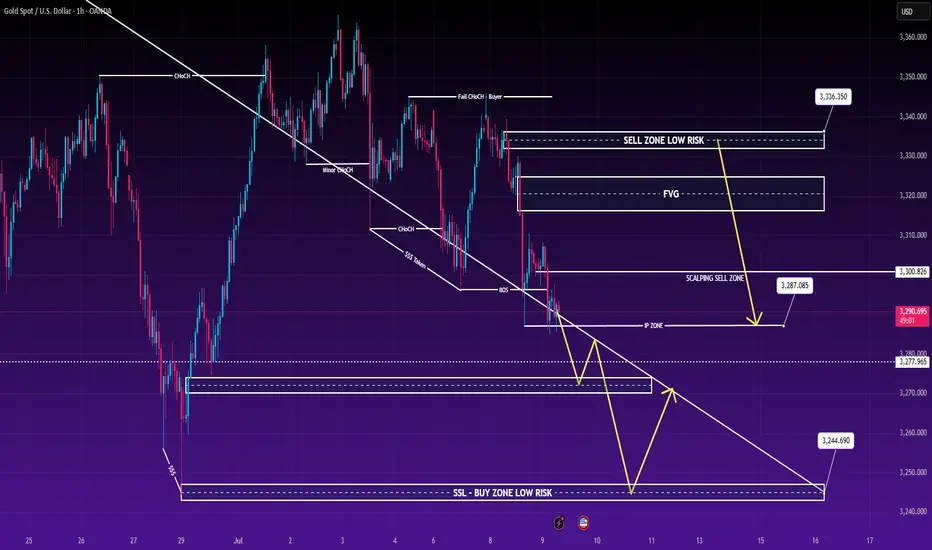
🔹 Technical Outlook – Gold in Range-Bound Consolidation
On the H1 chart, gold is trending within a well-defined downward channel, ranging from 3360 to 3290. This range is currently acting as a resistance and support zone. If gold remains in this range, it could pull back further to the 3250 liquidity area. The market is effectively testing lower liquidity zones, and the reaction at these levels will be vital for determining the short-term direction.
🔹 Strategic View – Monitoring for Breakout or Continuation
Given the current price structure, we are likely to see the market retest key liquidity zones around 3320-3325. If the price holds above this zone, we might see buying pressure that leads to a bounce. However, traders should remain cautious as false breakouts are common, particularly when the market is moving fast and without confirmation from higher timeframes.
🔹TRADING STRATEGY:
BUY ZONE: 3346 – 3344 | Stop Loss: 3340 | TP 3350 - 3361 - 3372 - OPEN
SCALPING SELL ZONE: 3305 – 3307 | Stop Loss: 3310 | TP 3300 - 3395 - 3387 - OPEN
LIMIT SELL ZONE: 3334 – 3336 | Stop Loss: 3340 | TP 3327 - 3310 - 3300
As always, patience is key. Ensure you wait for solid confirmation signals, especially at these critical liquidity zones. False breakouts are frequent, and it's important to trade with a structured risk management plan.
🔹 Conclusion
The market is at a crucial inflection point. While we may see some upside pressure if buyers gain momentum, the risk of a further correction is present, especially if liquidity demand shifts. Watch how price behaves around the 3300 level, and be prepared to adapt to market conditions as they unfold.
Week Opens with a Sharp Sell-Off – But Is It Really Bearish?At the start of this trading week, Gold took a significant plunge to $3306, breaking below the critical $3300 support and reaching as low as the $329x area. While this sharp drop may seem alarming, it is unlikely to signal a sustained bearish trend. Instead, this move could be a liquidity sweep, a common occurrence before the market reaccumulates.
🌐 Macroeconomic Landscape Impacting Gold:
US Inflation Continues to Cool: This offers the Federal Reserve more flexibility for potential easing in the near future.
FOMC Minutes are Coming This Week: Traders are eagerly awaiting insights from the Federal Reserve's meeting minutes to gauge any hints of a rate cut.
Gaza Tensions Ease Temporarily: With geopolitical tensions easing, the demand for safe havens like Gold may slightly decrease.
🔸 Additional Factors:
Trump’s New Tax Bill: The passage of Trump's tax reform has put additional pressure on US public debt, potentially impacting market sentiment.
US–China Trade War: Delays in negotiations between the US and China may reduce short-term risk appetite among traders.
Market Consolidation: Overall, the market seems to be in a consolidation phase, with a potential breakout on the horizon in the coming sessions.
📉 Technical Focus – Continuation Pattern (CP) Emerges
From a technical perspective, a Continuation Pattern (CP) is forming, which typically suggests a temporary pullback before the price resumes its primary trend. Here's a breakdown of key levels:
3,336 Resistance Rejected: After failing to break the 3,336 resistance level, Gold quickly fell through the 3,323 support, testing the important 3,303 zone.
3,293 Support Zone: If the 3,293 level fails to hold, the next downside target will likely be the deeper liquidity zone around 3,278. This level could trigger a more significant buying reaction, providing a potential opportunity for bulls to re-enter the market.
🔑 Key Levels to Watch:
Buy Zone 3291-3289:
Stop Loss (SL): 3287
Take Profit (TP): 3299, 3310, OPEN
Buy Zone 3244-3246:
Stop Loss (SL): 3238
Take Profit (TP): 3255, 3263, OPEN
Sell Zone Scalping 3337-3339:
Stop Loss (SL): 3343
Take Profit (TP): 3325, 3313, OPEN
Sell Zone 3362-3364:
Stop Loss (SL): 3367
Take Profit (TP): 3353, 3341, OPEN
📊 Conclusion:
The market is currently in a consolidation phase, with strong support and resistance zones in play. The recent pullback offers potential opportunities for both buyers and sellers, depending on how the market reacts to key technical levels. The next few sessions will be crucial in determining whether the market breaks out of this consolidation, and traders should stay alert to adjust their strategies accordingly.
